Steemit Crypto Academy Season 5 Week 3 [Beginner's Course] - Understanding Trends II By @kingworldline

I welcome every one to my assessment on "understanding your trend".
Am kingworldline

B) HOW CAN A FAKE REVERSAL SIGNAL BE AVOIDED IN THE MARKET? (SCREENSHOT NEEDED).
The trend reversal is a point where by a change is observed in stock or asset Trading, hence this change is observed to take an opposite direction from the main trend which can be of uptrends or the reverse down trends, this is figured out with the help of the market indicator (candle stick) which move according to the price valuation depending on the buy and sell setting at a point in time.
Therefore the trend reversal can take place in two main dimensions which are based in bullish reversal and down bearish reversal.
Hence the bullish reversal is a price action which tends to be in accordance with highs and high lows before reversing in the opposite direction towards the down trends, hence this is the reflection of the market situation at a period of time.
In the other way round the bearish trend reversal which is the opposite side of the bullish trend, is also a price action which moves in accordance with the highs and lower lows which tends to move down the trends at a setting point.
The benefit in spotting the Trend reversal is actually of two main benefits, it actually signals you when to exit from the market in order to protect a trader's capital and to stem losses.
The second benefit is that it actually signal a trader's opportunity to take advantage of the market by buying, which means it tells a trader when to buy an asset in the market.
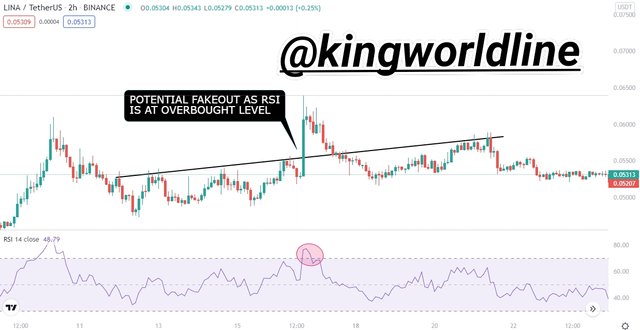
Hence the fake out reversal is a temporal move of price above or below the initial trend which tends to retreats back to its previous position.
Hence the fake reversal can be avoided through so many means by identifying of the breakout in the trendmarket can actually help to exempt yourself from this, also by observing the fake out by waiting for some period of time before taking action entering or exiting the market, Hence
applying this will give us a stand of what the market looks like.
Hence another means of doing this is by making use of as many indicators a trader can use, although the indications are not 100% efficient but can still be used to monitor when to enter and when to exit from the market.
A) BREAK OF MARKET STRUCTURE.
B) BREAK OF TRENDLINE.
C) DIVERGENCE
D) DOUBLE TOP AND DOUBLE BOTTOM
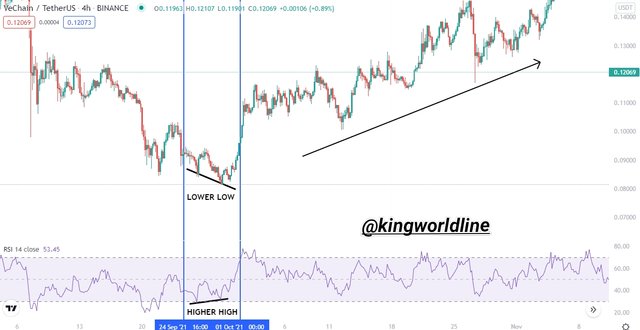
Based on this type of trend reversal came to be as a result of the market structure which tends to maintain its higher high and the higher low which tends to have a new highe higher than the previous high and also the previous high being lower than the previous low. Hence this shows a bullish trend which tends to project toward its future until when the new highs are not formed which now indicates that the projection of the trends has broken off which reverses as the trend moves to form a bearish trend, as shown on the screenshot chart below.
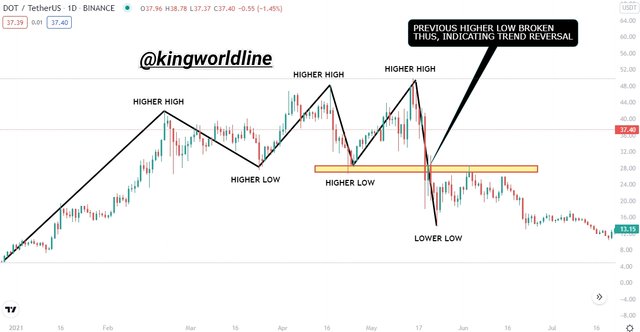
Based on the chart above, we can observe the projection which continues and a certain point in the screenshot lost the new high on the trends which now break and change due the fact that there is no new high formed again.
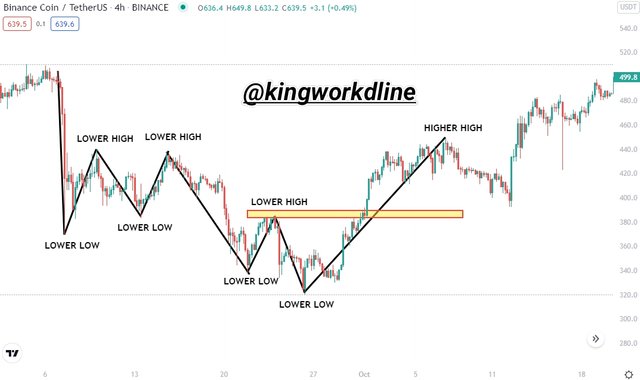
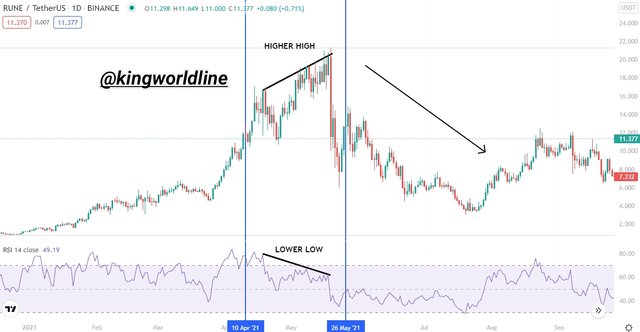
Hence based on the bearish trend it actually shows the the price setting in lower high and lower low which tends to tends to be lower than the previous low and the new high being lower than the previous high, this shows the bearish trend which moves on it trend until there is no new low formed, which now show the break of the trend, which reveal of the trend can be spotted. As show on the screenshot below
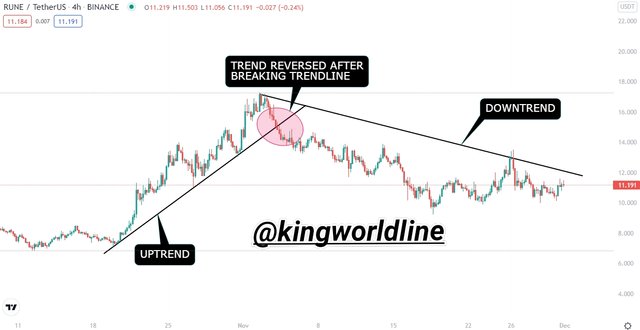
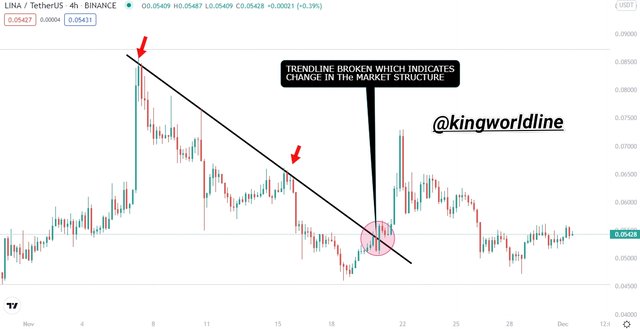
Based on the Break of trendline, this is a supplimatory tool very useful in determining the trendline which connects two main points of the lows to make an uptrend in the other way round the bearish are seen in that formation.
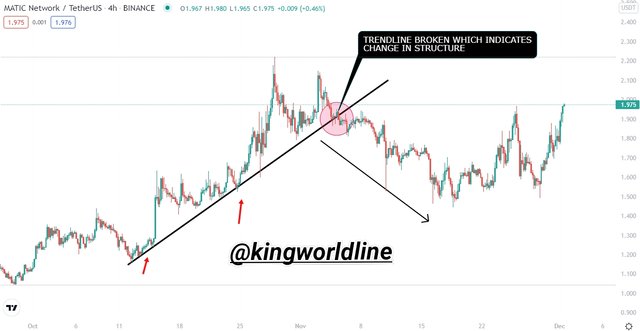
Hence, when we closely observe this we can observe the break off of the trend line,
which shows us the market movement at a calculated period of time alongside with the structure of the buying and selling setting.
Divergence as the name implies, this is used in identifying the change in the market, hence this works along side with technical indicators to determine the price change in the market, therefore when ever the is divergence, the indicators and the price moves in an opposite directions which shows that the market cannot meet, hence the are to main types of divergence which are the bullish and the bearish divergence.
Based on the bullish divergence actually occurs whenever the price action formulates the low formation meanwhile the indicator formulates the high formation, hence this shows a sign that the down trend is gradually turning to be an uptrend which shows the sellers are getting overshadowed by the buyers as the trend projects towards the bullish direction showing take over.
Based on the bearish divergence, this place whenever the price obtained it's higher high and the indicator also attains its lower low, which tries to subdue the selling pressure which forms the downtrend, meanwhile the downtrends figure out the reversal of the of the downtrend which shows that the buyer are submitting to the market while the sellers are getting dominion over the market which show the reversal of the down trend taking charge.
The double top is a means of figuring and identifying the trend change in two main double structure, this is the rise of the price to a certain point and pullback and retrace to the previous price which sub pass the previous top, hence the price forms the higher highs and as well the lower low in the uptrend and as well the downtrend respectively. Therefore the pullback signifies that the buyers are loose in the market as shown on the screenshot.
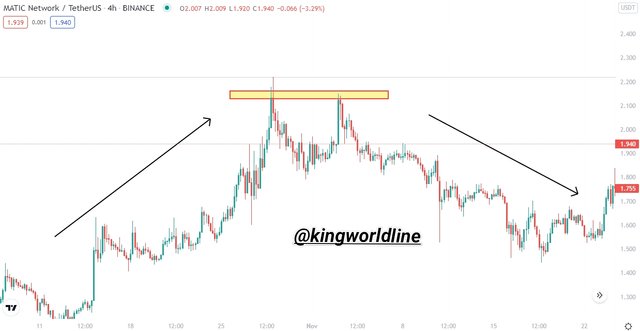
Hence based on this, shows that uptrend is turning to be downtrend, which shows the strategic points of selling in order to make profit.
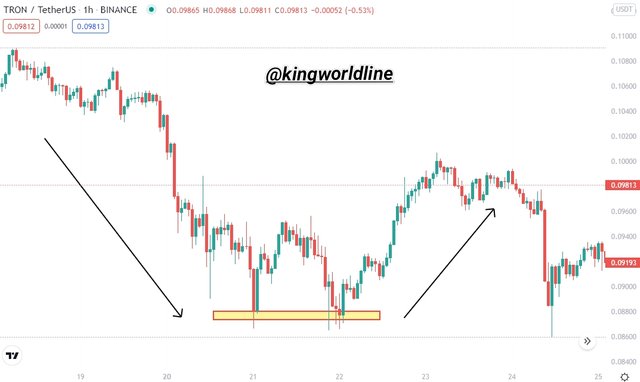
Therefore the double bottom happens whenever the seller fails to raise the price, which shows that sellers are losing their position to the buyers, hence the downtrend happened to take place in the downtrend hence the price cannot be seen to fall below the previous.
Link
Hence based on this trading with any of the trend reversal / pattern, i will be using the demo in carrying out the buy and sell which require the use of one of the the above trend reversal pattern.
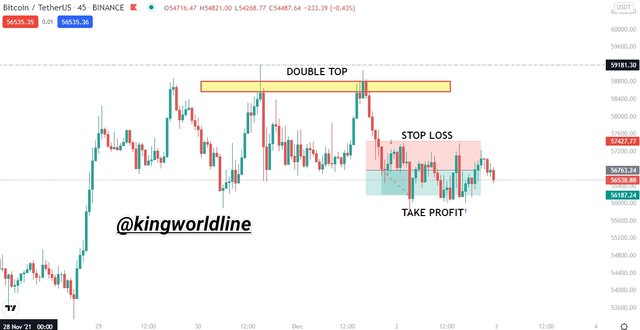
Hence the first thing to carry out is to get my currency pair BTC/USDT, Hence I open by buying at 0.05 BTC with a stop loss at 5747 and take profit at 56093.
Link
Here is my entry of asset sold.

Hence all this reversal shown are very important, which help and as well serves as a guild for Trading, therefore is quit important to be friendly with all this trends as our topic says " Understanding Trends".
Cc: @reminiscence01
#reminiscence01-s5week3 #cryptoacademy #club5050 #steemexclusive #trend #trendreversal #nigeria
Hello @kingworldline , I’m glad you participated in the 3rd week Season 5 of the Beginner’s class at the Steemit Crypto Academy. Your grades in this task are as follows:
Recommendation / Feedback:
Thank you for submitting your homework task.