[Hekin-Ashi Trading Strategy]- Steemit Crypto Academy | S4W2 | Homework post for @reddileep
Is my pleasure to participate on this assignment on Heikin-Ashi Trading Strategy by professor @reddileep, thank you so much for this wonderful opportunity and knowledge, i welcome every one to my homework i hope you will enjoy the writeup
Am @kingworldline

QUESTION ONE
1- Define Heikin-Ashi Technique in your own words.
Heikin -Ashi Technique is a japanese Candlestick which depends on technical trading tools which actually use a chart of candlestick to show and represent and also visualize the market price data. Meanwhile is also is used to mark trend signals and to predict and forecast what the future have for the market based on price movement.
Also the Heikin-Ashi method utilize the average price data in filtering out the noise around the market.
Heikin-Ashi Technique is actually a brainchaild of a man kmown as Munehisa
Homma who is known to be the father of the candlestick pattern.
The candlestick pattern was modified to Heikin-Ashi, Heikin-Ashi trading technique was actually developed by Munehisa Homma in the year 1700s in japan, meanwhile the word Heikin means “average” or “balance,” while the Ashi also means “bar” or “foot.” therefore adding up the names give you average data which means in the other way round Heikin-Ashi.
Meanwhile juldging in the both side of the Heikin-Ashi and Candlestick, they all look alike when view at a long rang but main looking at it in close rang it looks smooth and show clear market trends they all differs based on there trend which is stipulated on the current candle data, based on the result of the average of the previous candle.
Meanwhile this enhance the trader to forecast the market with the help of the datas, in other to known when to buy or sell their asset.
Therefore Heikin-Ashi is a body with a lower
Shadow and and a upper shadow each of the two side having high and low and as well the open and the close path, further more the Heikin Ashi uses his components to determine the next candle to come up, the repeatation of this forms patterns, therefore the Heikin-Ashi candle stick show a clear chart.
QUESTION TWO
2- Make your own research and differentiate between the traditional candlestick chart and the Heikin-Ashi chart. (Screenshots required from both chart patterns)
Based on the individual difference on the
Heikin-Ashi Chart and the Traditional candlestick chart, there individual differences are shown below.
• THE OPENING OF A FRESH CANDLES:
Bases on the opening of the both chart, the Heikin Ashi chart always open or start from the middle of the previous one while in the Traditional candle the case is not the same, therefore is irregular in terms of maitaining its Pattern of opening.
•THE NOISE AND SMOOTHNESS OF THE CHART
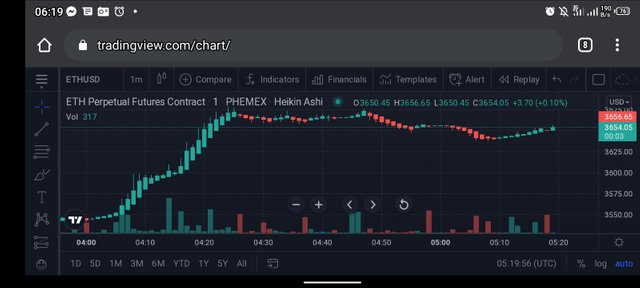
Juldging on their screenshot below the Heiken-Ashi chart reduce the rate of the noise compared to the traditional candlestick base on the price, whereas in the traditional candle stick show even the little effect in the market making it so noisy in the chart where as is not so in the Heiken-Ashi chart chart. Screenshot shown below.
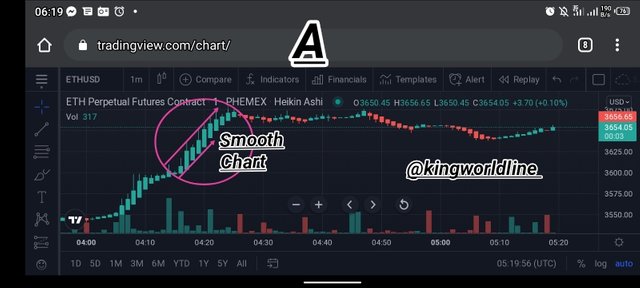
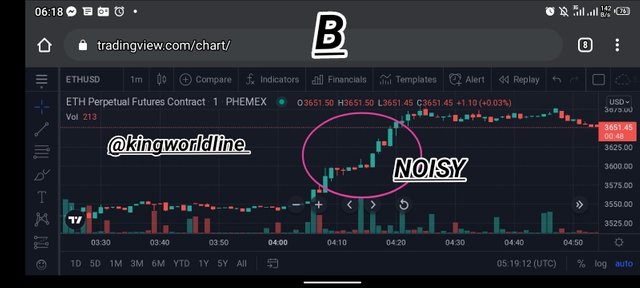
• EASY DETERMINATION OF THE MARKET TREND
On the Heikin-Ashi is so easy to determine the the market direction at point in time in order to know when to buy or sell, where is not the same with the traditional candle stick, Heikin-Ashi makes the chart look neat the below screenshort shows the individual differences.
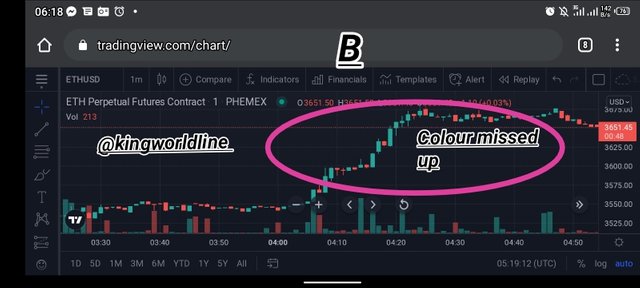
•COLOUR DIFFERENCES IN THE CANDLES
Base on the colour Heikin-Ashi a slight change in the market does not affect the colour trend in the chart where as in the traditional candle a slight change in the market affect the colour trend the chart
QUESTION THREE
3- Explain the Heikin-Ashi Formula. (In addition to simply stating the formula, you should provide a clear explanation about the calculation)
As regards to the calculation on Heikin-Ashi calculation and formular in uses open, the close, low and the high of the the last proceeding or the previous candle to calculate the next up coming candle.
Therefore further explanation below.
•FOR THE OPENING CALCULATION
NOTE:
NC is Next candle
PC Previous price
Based on the mathematical expression Heikin-Ashi can be calculated by
Open=( Open of a previous candle + close of the previous candle)/2
The interpretation behind this, is that the open of the previous is being added to the close of the first previous candle and the total of this two is divided by 2 which means that the up coming candle will start at the middle of the previous. Candle
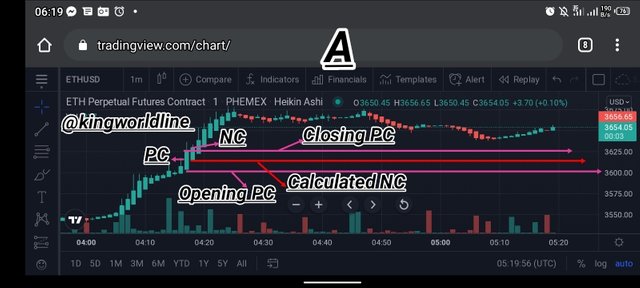
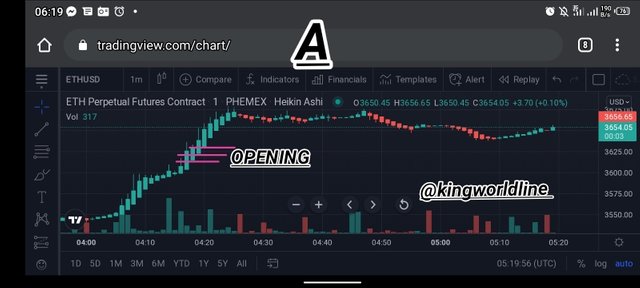
The screenshot of the chart is base on the ETH/USD, the pink arrow indicates the previous candle which is the open price at.
The open price of the candle is 3600.00 and the closing price 3625.00. hence the expression is as follows
NC=3600.00+3625.00/2 =3612.5
CALCULATION BASE ON THE CLOSE
Based on the close of the candle is calculated by dividing all this (the open, close, high, and low) divided by four, which can expressed as (open+close+high+low)/4
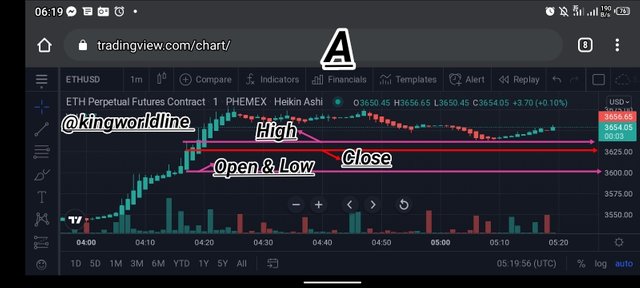
CALCULATIONBOF THE HIGH
Bases on Heikin-Ashi chart the high is calculated based on the value of the high on Open and close of the current candle. Hence the mathmatical interpretation is, HIGH= Max value among (High, Open or close)
The highest value among the three is considered as the HIGH
CALCULATION OF THE LOW
As regards to the Heikin candle Chart, this is calculated by finding the minimum value among the (Low, Open and Close) of the current or the present candle. Therefore mathematically it can be justify as;
LOW= Min value among (Low, Open, and Close) which implies the minimum among the value on the bracket is considered as the LOW.
QUESTION FOUR
4- Graphically explain trends and buying opportunities through Heikin-Ashi Candles. (Screenshots required)
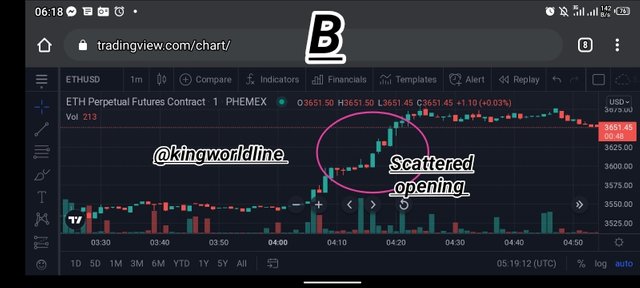
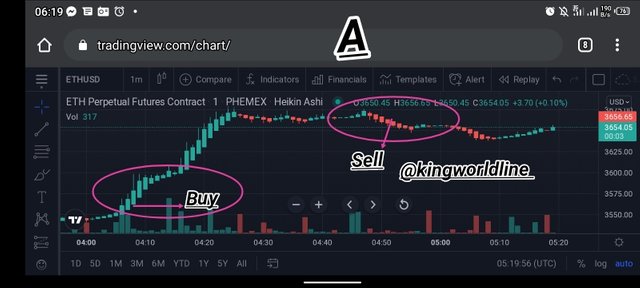
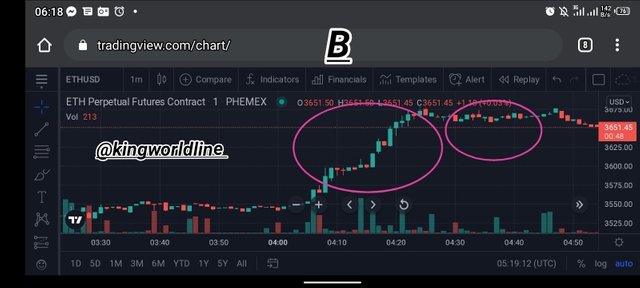
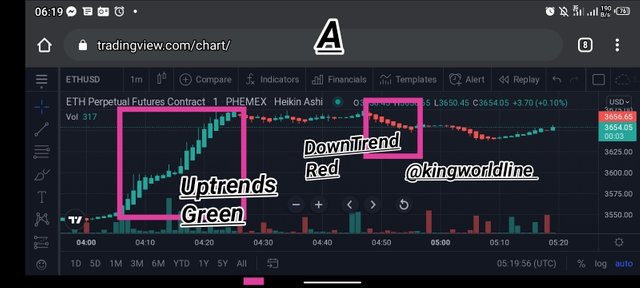
Heikin-Ashi candles are being used in the capturing the current and previous trend on the market as regard to a pictorial chart, below show the market action on n the chart.
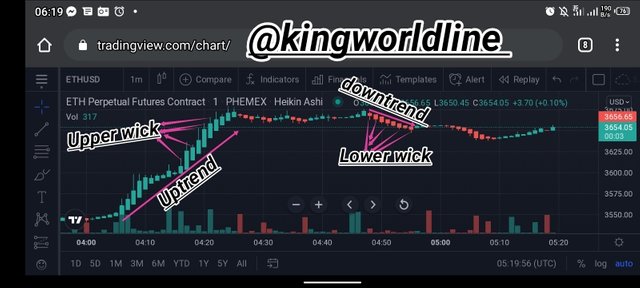
Therefore as to interprete the Buying opportunity in the market, the above thiny line on top of the candle body which are known as the wick, when ever their is a continuation of the wick as the top of the candle bodly shows the uptrend, whereby the buying opportunity can be spoted as shown in the chart.
Meanwhile the the colour trend can also help in determining the based on the buy and sell order, meanwhile the GREEN Heikin-Ashi candles signifies the bullish oder while the RED orders shows the down trend which is bearish trend where selling takes chances.
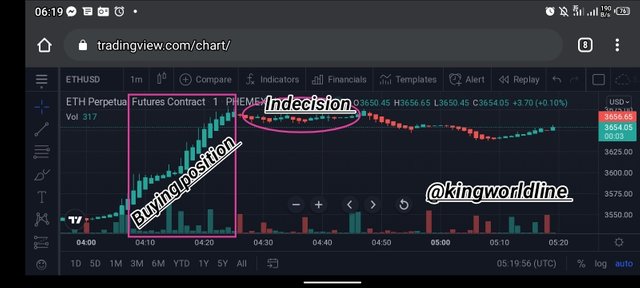
Meanwhile the indicision in the chart shows that the market is unclear, Hence the traders at this point the are in between decision, waiting for the next move to take on the market.
The chart all inprete the question in quote, below is the chart.
QUESTION FIVE
5- Is it possible to transact only with signals received using the Heikin-Ashi Technique? Explain the reasons for your answer.
Too my own understanding towards the chart i will say is NOT possible to transact with the signal on Heikin-Ashi only due to the market price situations, for support and effectiveness in trading we have to support it with other indicator to enhance the strategies.
Meanwhile is well known that crytocurency is highly volatile meaning is unstable which tells that the market is not 100% predictable, therefore other indicator have to be in place to interpret the situation of the market based on yo wait, buy or sell.
QUESTION SIX
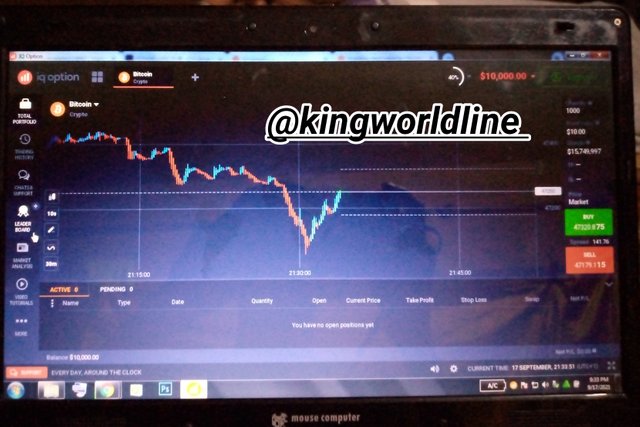
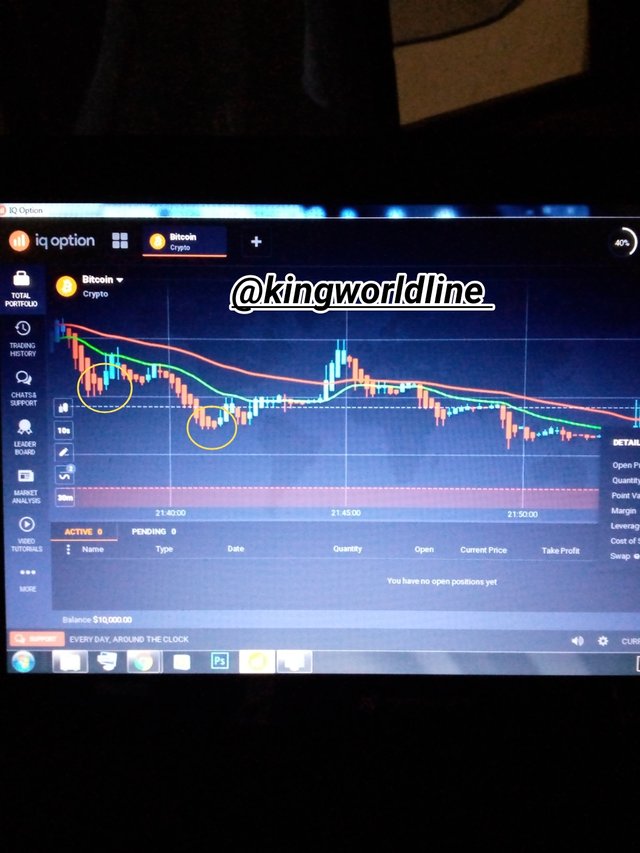
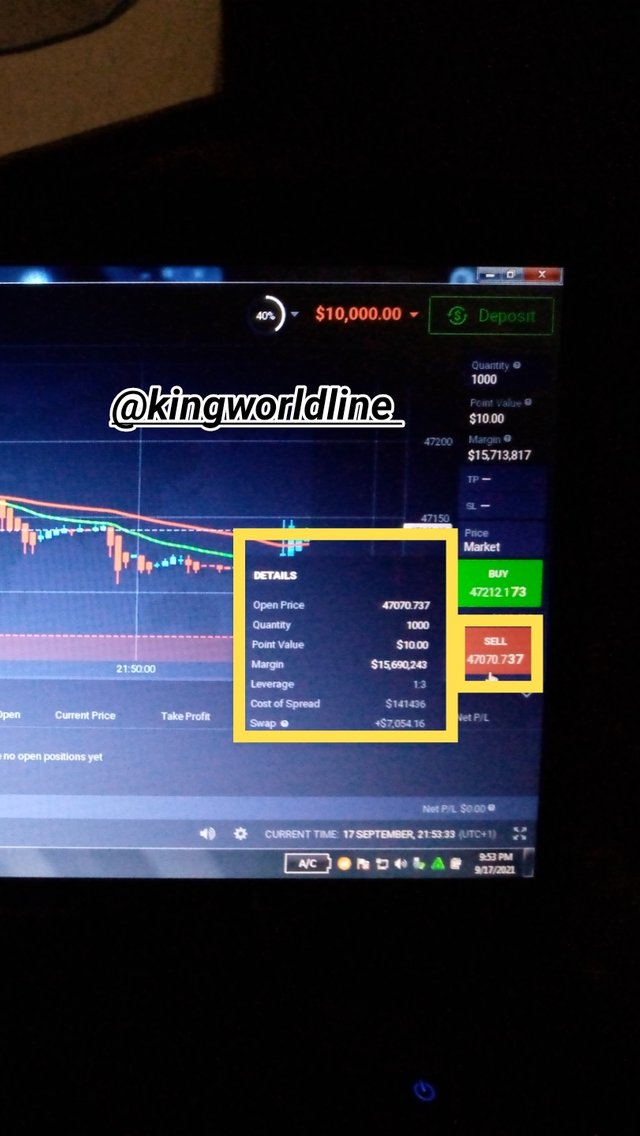
6- By using a Demo account, perform both Buy and Sell orders using Heikin-Ashi+ 55 EMA+21 EMA.
Bases on my understanding on what i have learnt am going to use my demo account IQoption, meanwhile i will use the necesary procedure required, i will be using a pairs in performing this operations as indicated by the Moving Average and as well the Heikin-Ashi by fellowing it's strategy asbthe indicators indicates.
I will be using the BTC/USD in other change the candle as shown in the chart.
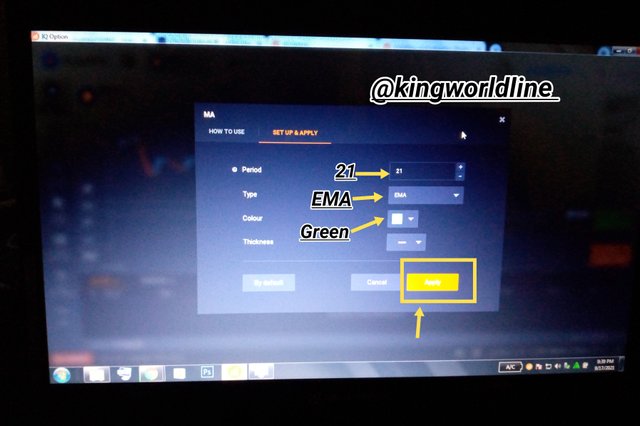
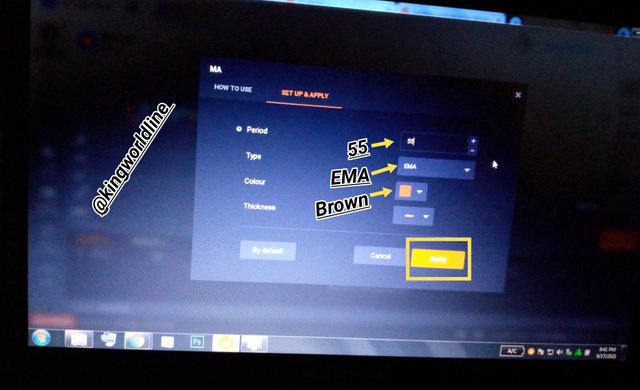
Therefore the pairs involve, changes the style, then i click on option and add the Period, EMA, Colour, thickness.
NOTE:*** EMA=21 is (Green) while EMA=55 is =(Brown)as shown below.
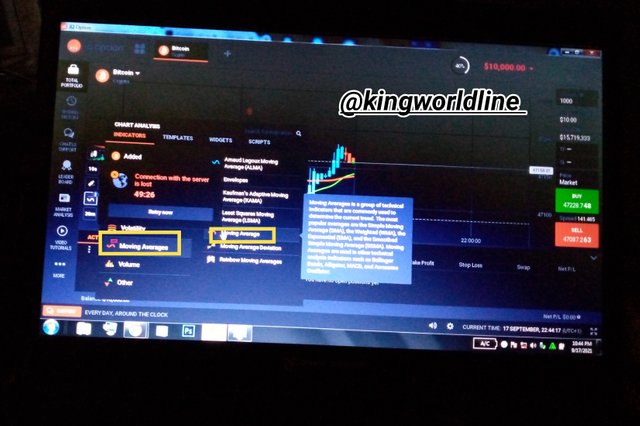
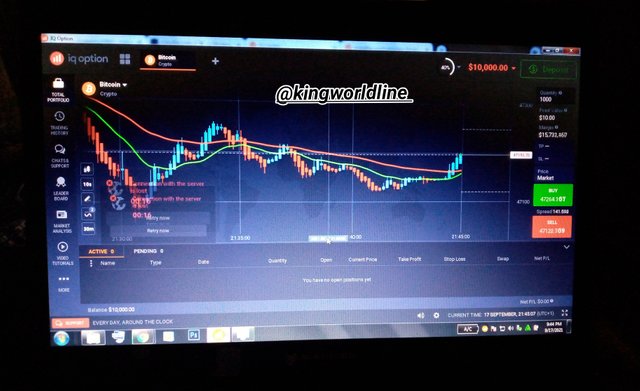
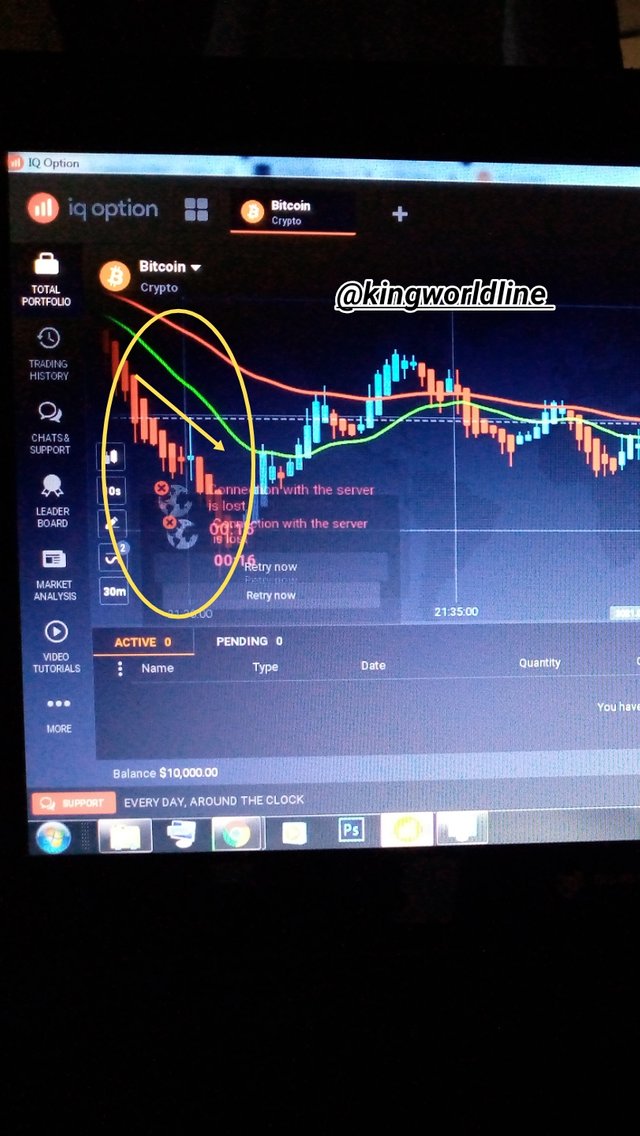
Here are the two moving average on the chart, base on the report from the graph we can say the EMA of 21 nearly come come across at the middle of the chart with that of EMA of 55 which signify a change in the trend, meanwhile the indicision candle are seen at the middle of the Heikin-Ashi chart with other procedure as shown below.
CONCLUSION
Heikin-Ashi this is a technical and as well a strategy in trading which enhance and as well serves for the trader on when to buy or sell which is the entry and the exist point in the market point.
In a nut shell no indicator is perfect in trading, meaning no one is 100% effecient, therefore the greater number of indicators in the chart, the greater the chance of achievening in terms getting where the market is swinging to whether to buy or sell.
#reddileep-s4week2 #cryptoacademy #heikin-ashi #trading #strategy #nigeria