Crypto Academy S3: W3 | Trend, Support, Resistance and Simple Chart Patterns

GOOD DAY...
Welcome to my home work asigned by @lenonmc21,
Am @kingworldline
Enjoy the reading...

QUESTION ONE
Define In Your Own Words What Is A "Trend" And Trend Lines And What Is Their Role In Charts?
.jpeg)
Link
Trend is the market momentum of the market values or price move which involved the upward known as the bullish and down trend which is the bearish or the sideways which is known as the flat, this trends do not have a specified timeline for any direction for any trend, mean while the longer the direction continuously at a certain level, the more qualified the trend becomes.
Identifying trends is carried out by observing the raw price of the asset, mean while we can identify up trend when the Price is found consistently in higher highs and also in the other way when is lower high and also when the trend is found in horizontal pattern known as the sideways which oscillate at the range of support and the resistance points.
Bullish, bearish, sideway all have their characteristic as regards to speed(momentum) and direction.
A trendline is series of high and low pivots of trends which is in alignment of a straight line which are dependent of the support and resistantce with a time frame, they determine the speed of the price and as well explain the patterns at a period of a reversible reduction in size.
This is constructed by conjoining two or more price point at a junction with a straight line which determine the trendline.
The trendline determine the current direction of the market prices and as well the history.
They are of two type trendlines which depends on ascending and decending.
1.Ascending trendline is formulated by joining the high and lows where the recent low is set to be higher than the previous low.
This type of trendline determine the future which can be peak at the support level or beyond.
This ascending trendline shows the price action of the buyer and sellers towards the (bullish)
2.Decending trendline is the reverse and opposite of the ascending trendline, this is formulated by join low and high and when the recent high is set to be lower than the previous high.
This decline the projection of the trend towards the future, which focus it towards the support level
This as well shows the extent price action of the buyer and sellers towards the Downtrend (bearish)
QUESTION TWO
Explain how to draw an uptrend line and a downtrend line (Show a screenshot of each).
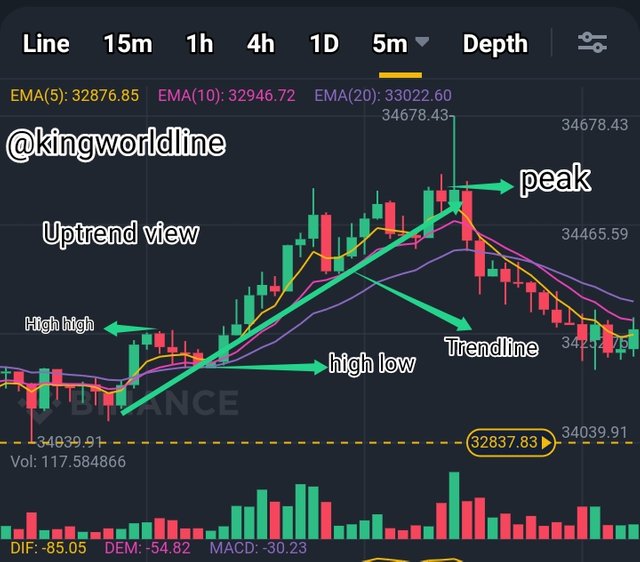
1.Uptrend
An uptrend spot and decribe the movement of financial asset, i observed that each successive uptrend peak is lower to the next uptrend ahead of it, the uptrend is constitute higher wing low and higher swing highs, so far as there is progress in the uptrend means that the trends is intact progressively.
Consideration while drawing the trendline.
•Is that we need a two point which is base on the market price.
•Next thing is to identify is the upper and the lower point based the and high low for uptrend for the two ending point
•Lastly draw your line from the starting to end of the trend.

2.Downtrend
An downtrend spot and deacribe the movement of financial asset, i observed that each successive downtrend lowest point is higher to the next downtrend ahead of it, the downtrend is constitute low wing and low swing lows, so far as, there is progress in the downtrend means that the trends is intact progressively.
Knowing what trendline is all about,
Consideration while drawing the trendline.
•Is that we need a two point which is base on the market price.
•Next thing is to identify the upper and the lower point point based the low, high for downtrend for the two ending pointpoint of the trend from the higest low to lowest.
•Lastly draw your line from the starting to end of the the two point.
QUESTION THREE
Define in your own words what "Supports and Resistances are and how we can identify both zones (Show a screenshot of each one).
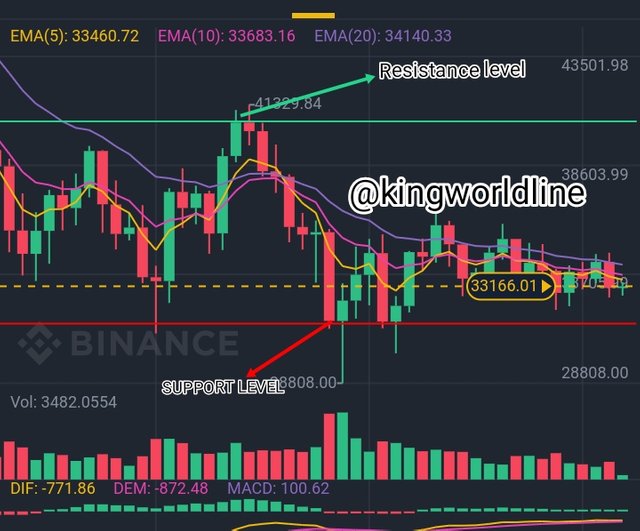
Support and Resistance are two levels which are important in technical analysis
1.Support level can be define as the stop and change of price to the opposite direction due to the higher number of buyer which increases the price. support level is the "floor" which support or hold the prices.
While the
2.Resistance levels is similar to support levels but at this case resistance levelling is at the opposite direction to support level.
Resistance can be defined as the stop and change in price to the opposite direction due to higher number of seller which decrease in price in the market.
They are known as price levelling
To start with, we at least we need at least one, two price point to place horizontal line
On a chart simply join the swing highs or the swing low project it trendline towards the future.
QUESTION FOUR
Explain in your own words at least 2 simple chart patterns with screensholevel.
Chart pattern is a chart that covers the price which suggest what could likely be the next price judging from the past
history of the price, and this is technical analysis which demands a trader to know what he is looking for.
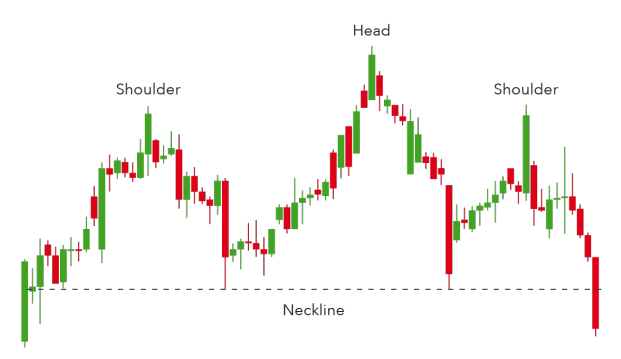
1.Head And Shoulder is chart pattern which have smaller peak in his both side, with this pattern trader focus on it to determine the bullish to bearish reversal.
Base on this pattern, the two shoulders and the head all have there origin from the support levels, when the third peak found itself at the support level they assume they should be breakout in downtrend (bearish).
Link
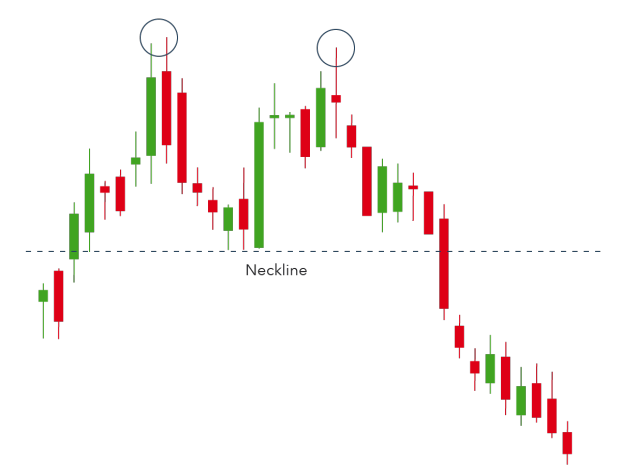
2.Double Top is a pattern that trader make use of in highlighting trends reversals.
This is the projecting of the asset price with a retrace back to support level which also retrace itself again before remaining parmanent with the prvailling trend.
THANKS FOR
READING...