Crypto Academy ||Season 3 ||Week 2 || - Homework Post for Professor @reminiscence01

Wao.. is always my pleasure to participate on crypto academy, i really enjoy the lecture from my professor @Reminiscence01
i welcome my fellow student, good day all.

QUESTION ONE
Explain the Japanese Candlestick Chart? (Chart screenshot required)
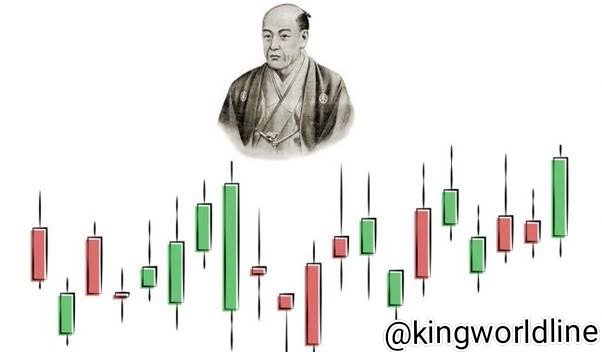
To start with what is japanese candle stick chart; This are known as technical analysis which is actually rely on the tools of which the user or traders use in figuring out information about the price trend and is know as well the concept of as regards to candlestick chart which was initiated by a Japanese rice trader by name Munehisa Homma who was influenced with emotion from the traders, of which he acknowledged the fact behind economics which are the rule guilding demand and supply.
This man by name Homma initiate and develop candlestick from the point of view from graphical presentation or display of which he can use the chart to determine the price fluctuation and trends by indicating it with different color as we have the (RED AND BLUE)
this colour actually shows the difference between the both, the candle stick can be of a pattern of price situation depending on the direction.
•How Does Japanese Candlestick works
This known as Japanese candlestick actually give out more information and detail on the price movements,
which is present the demand and supply in a graphical order with time of actions
each candlestick should have a central portion which split the distance from the the upon and that of the closing. The area of the candle stick is known as the body while the upper, the upper shadow indicates the price distance and as well the trading period and as well when the shadow is low the so called price distance from the botton of that of the body and as well that of the trading period.
Reading the candlestick from that perspective with the closing price we can determine whether it is on a bullish
or bearish move.
The main body is always white, it is note if the candlestick close at a top price than how it started which means closing price is said to be seen at the top while opening price is being main to be in the botton.
•Candlestick Patterns
The japanese Candlestick is a form of pattern of which trader utilize it to analyze and to figure out the current and past price based on it move.
Example of the candlestick are as follows;
Th Doji: is an candlestick is generated when the both side of the opening and closing are said to be the same or quit close.
•Gravestone Doji: This is formed or generated when that of the open and close seem to occur in a low of the period.
•Dragonfly Doji: is also formed when ever that of the opening and that closing prices of that of the security and as well in a higher time.
•Bearish Engulfying pattern: This patttern shows that of the bears in the control or handle the market, which include the large body and engulfs the previous, the closing price is set to under the opening price, when this shows up, it shows bearish reversal.
•Bulllish Engulfing Patterm:
This is parttern that always formulate at the ending side of the down trend, which include smaller candlestick which it body is said to be engulfed with that of a large candlestick.
Hammer: Hadiffeern this comprises of the long tail at its lower end. Is a signal for that of the market reversal neither behigher,
QUESTION TWO
Describe any other two types of charts? (Screenshot ranalysis)
But i will explain just two chart as the question two demands
The chart are in form of pictorial form which send out message based on fact and figure and as well assist in analizing data, types of charts includes,
The line chart
The bar chart
The candle stick chart
Point and figure chart
But i will explain just two chart as the question two demands.
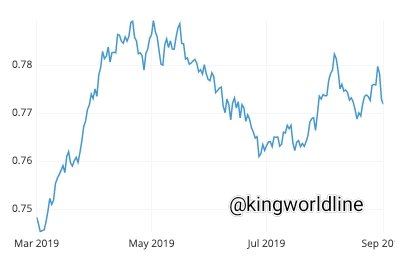
The line Chart: This is quit simple form of a chart, the line chart actually have what we called line data which appears horinzontally with that of the price data vertically, this is formed by relating or connecting with that of the closing prices. which can be pictured
at hours, daily, weekly, monthly as the case may be.
this so called line chart does not actually reflect the opening, low data high data which are said to the major analysis.
Link
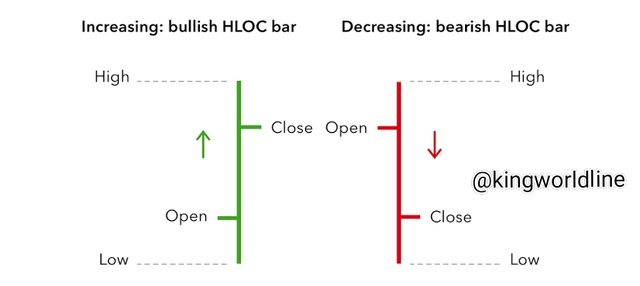
The Bar Chart: This particular chart shows the high, low, open, and close data. when ever that of the open is above that of the Day's close, which is differentiated with the green and red colour. The bar chart actually assist us to determine the the trading range as it
point out the high and the low.
QUESTION THREE
In your own words, explain why the Japanese Candlestick chart is mostly used by traders.
Over the decades now, trader use candlestick charts always and frequently more than any other tool for technical analysis due to the fact that is very easy and self explanatory to analyze it features, it actually provides more information with details concerning the market than that of the line and the bar chart.
Some of my reason behind this based on the benefit of bit which are as follows;
• it actually determine the recent state and condition of the market in view.
main looking at the two colours involved and the length of the candlestick tells you the information in it, with that traders can stand determine and predict whether the market is becoming bullish or bearish.
•Another benefit of it is that it will show you the exact direction of the market easily
in a candlestick charts, base on the size and the colour of the candlestick can tell trader whether is at the uptrend part or at the bearish.
•It also assist us in determining the pattern of the market quickly, this specically display that of the bullish and the bearish reversal, which are different pattern which can not be spot in other charts.
QUESTION FOUR
Describe a bullish candle and a bearish candle identifying its anatomy? (Screenshot is required)
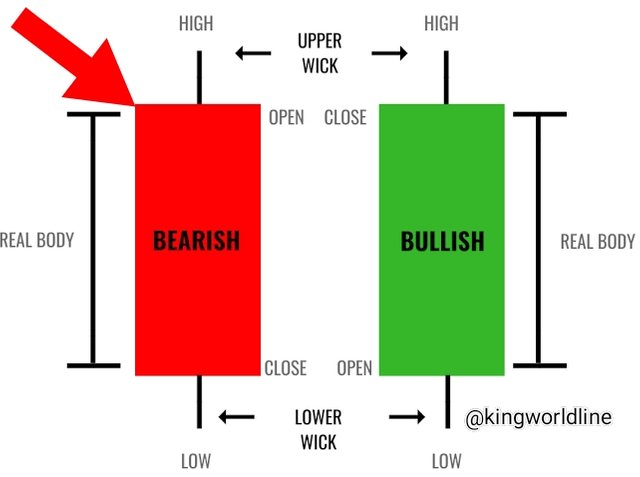
•The Bullish and Bearish Candlesticks
The bullish and the bearish candlestick are two candlestick which are quit different in their function in their perspective, of which they have there feature.
Link
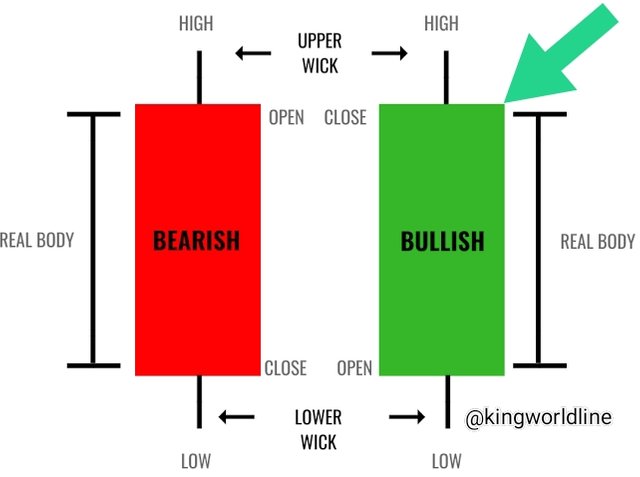
•The Bullish Candlestick: This is when the close is said to be high than that of the open, with that of the bullish candlestick it actually means that the buyers are more dorminant in the market than the sellers which means the demand is more than that of the supply, the bullish candlestick can appear in a open, close and as well the high and the low.
Link
The Bearish Candlestick: The bearish is when the close is said to be lower than that of the open, is an opposition to the bullish candlestick, this bearish simplely means that that seller are more dorminant than that of the buyer in the market, of which supply is more than the demand and it can appear in open, close, low and and high as well.
| BULLISH | BEARISH |
| 1. The bullish candlestick is always on green or white | The bearish candlestick is always red or black |
| 2.The opening price start from the botton of the candlestick | The opening price is always high while the closing is always lower | 3.The opening price start from the botton of the candlestick | The opening price is alwas high while the closing is always lower |
| 4.The closing price is high | The closings price is set to be lower |
CONCLUSION
This actually all about demand and and supply at which of the candlestick initiated by the Japanese Homma came out with a postulate of which the the bullish and Bearish trend run on the chart to determine the market conditions, which is applicable in market trading.
This home work is done by
@kingworldline
And my special regards to
@reminiscence my professor
#reminiscence01-s3week2 #cryptoacademy #steemexclusive #nigeria
Hello @kingworldline , I’m glad you participated in the 2nd week of the Beginner’s class at the Steemit Crypto Academy. Your grades in this task are as follows:
Recommendation / Feedback:
Thank you for submitting your homework task.