UNDERSTANDING TRENDS II - CRYPTO ACADEMY / S5W3- HOMEWORK POST FOR @reminiscence01

Hello Steemians, I hope you all are doing great today. This week lecture by prof @reminiscence01 is based on Trend continuation and it focuses on identifying trend reversal using several methods. Which include:
- Break of market structure.
- Break of the Trend line.
- Divergences.
- Double top and double bottom formation.
The lesson gave a detailed explanation of the above mentioned methods and I will be giving answers to the questions asked in the homework task from the lesson.


1. a) Explain your Understanding of Trend Reversal. What is the benefit of identifying reversal patterns in the Market?
b) How can a fake reversal signal be avoided in the market? (Screenshot needed).
Every trader is expected to have the understanding that the crypto market will never only trend in a single direction. Understanding that there is always going to be different kind of trends ranging from the bullish market trend to the bearish market trend will help every trader to go into a trade or come out of a trade with profit or at minimal loss level.
Looking at the present state of the crypto market, we can clearly say that the market is in a possible Trend reversal state since it hit a general all time high of $3 trillion. Currently, there has been a pull from the previous trend causing the market to drop to $2.6 trillion which is a clear sign of the bears trying to take over the market once more.

So we can simply explain a Trend Reversal as a change in the market movement either from a bullish trend to an bearish trend or vice versa. Traders who understand the market logic will agree that the current market has been in an uptrend state for a period of time and that now is the right time to pull out profit from the market in order to avoid losses. There have been breaks of market Structure and break of Trend lines which support the possibility of the bears taking over the market. There are no confirmations about a reversal trend for sure, but a trader who understand trends and formation at this point, will be careful enough before opening a position without confirming the trend continuation or reversal.
As a trader, identifying reversal patterns in the market is of great necessity if one must trade profitably. There are various benefits of Identifying reversal patterns in the market and below are a few.
- It give you an idea of the possible direction of the market.
- It makes trading more efficient and profitable.
- It gives you an idea of when to take profit off the market.
- It gives you an idea of when to open a position in the market.
- It makes the market predictable for traders
- Loses can be avoided with the knowledge of a reversal pattern.
- It makes one understand a fake reversal signal from a certain reversal pattern.
Sometimes due to fake reversal signal, investors or traders tend to make a panic sell which in few days there seem to be a trend continuation in the previous direction creating even a new high position. Sometimes a retracement is taken for a reversal signal and most times it happens to be a fake reversal signal. To avoid this one must fully understand when the market is undergoing a minor retracement which can in turn push the market to a new hight entirely. Looking at the screenshot below we will understand how to avoid a fake reversal signal.

2) Give a detailed explanation on the following Trend reversal identification and back up your explanation using the original chart. Do this for both bullish and bearish trends (Screenshots required).
a) Break of market structure.
b) Break of Trendline.
c) Divergence
d) Double top and Double bottom
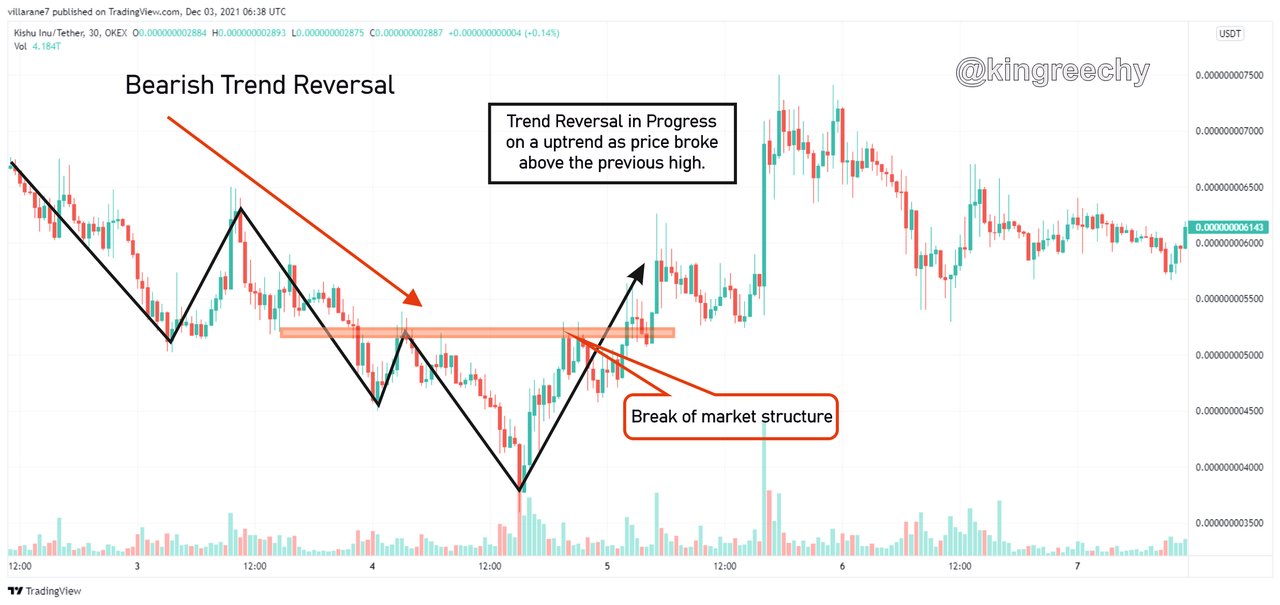
In a market structure, there are both bullish trends and bearish trends. In other for the bullish trend continuation in a market structure, the new high created must be higher than the previous high while the new low formed must be higher than the previous low. In the same understanding, For a bearish trend market structure to continue, the new high created must be lower than the previous high while the new low formed must be lower than the previous low. Therefore, the violation of the statement above for either trend might cause a break in the market structure thereby creating a trend reversal. Below are pictorial examples of a break in the market structure of a bullish and bearish market.

From the above Kishu/USD chart we can observe that the price was moving in an upward trend, creating a higher high and higher low formation but there comes a break in the market structure as price fails to create a new high, higher than the previous high. This is as a result of the buyers being unable to continue pushing the price upward thereby allowing sellers to take over the market which in turn causes a downtrend. This new trend pattern tells us to take profit off the market then wait for a good entry position to buy the dip.
From the Kishu/USD chart above we can see that the price was moving in downtrend, this bearish trend was creating a lower high and lower low formation but we notice a trend reversal as price fails to create a new low lower than the previous low. This is as a result of sellers being unable to keep pushing the price downwards therefore buyers becomes in charge of the market leading to a bullish trend.
A Trendline analysis is an important tool for speculating the trend in the crypto market. The Trendline can either go in an uptrend otherwise knows as a bullish trend or a downtrend otherwise known as a bearish trend. Traders makes use of this representation to determine the trend continuation of a market.
A Trendline is said to be valid if the price keeps being rejected at the trend line which also serves as a support system for traders. The trend line is used a resistance line that points to the continuity or discontinuity in the direction of the price in the market. Therefore, a break in the trendline calls for a trend reversal in the market and at this point, various trading decisions are made by traders to either pull out or remain in the market if the signals are seen as mere retracement before another continuation in a new trendline. Below are pictorial examples of a break of Trend line in a bullish and bearish market.

From the above Kishu/USD chart we can observe that the price was moving in respect to the trendline by rejecting to go below the line during retracement, but after a while we will notice a break in the trendline which is a strong reversal signal as a result of weakness of the buyers thereby causing sellers to take control of the market.

From the Kishu/USD chart above we will notice that the price was moving in respect to the trendline in a downtrend by rejecting to go above the line during retracement, but after a while we will notice a break in the trendline which is a strong reversal signal as a result of the buyers taking over the price movement in the market. This point if understood, can be an exit period in trading.
Another way of identifying trend reversal is by using the Divergence method by simply combining the price action with an indicator. We say there is a divergence in the market when there is an opposite signal between the price action and the indicator signal. A clear example is when the price action of a market signals a bearish trend by creating a lower high formation while the indicator signals a uptrend direction by forming a higher low therefore a trend reversal is formed as an early signal to traders to close up their position before this reversal.
BULLISH DIVERGENCE:
We say there is a bullish divergence when the price action of the market creates a new lower low formation while the indicator creates a higher high formation. This is seen as an initial signal for an incoming bullish trend from the current bearish state of the market. Good traders use this opportunity to quickly stay on the lookout for buy opportunities after closing a sell position. Below is an example of a Bullish Diverging Market.

From the Kishu/USD chart above, we can observe a Bullish divergence between the Price and the Relative strength indicator (RSI). We can observe a clear difference between the direction of the RSI indicator showing an higher high pattern (which is a bullish signal) and the indicator showing a lower low pattern. Immediately after the occurrence of the divergence there was upward trend reversal.
BEARISH DIVERGENCE:
We say there is a bearish divergence when the price action of the market creates a higher high formation while the indicator creates a lower low formation. This is seen as a weakness in the current state of the market as buyers are becoming unable to continue pushing the market in an upward. This is a signal for an incoming bearish trend from the current bullish state of the market. Traders see this as a right time to leave the market before the actual drop. Below is an example of a Bearish Diverging Market.

Looking at the Kishu/USD chart above, we can observe a Bearish divergence between the Price and the Relative strength indicator (RSI). We can notice a clear difference between the direction of the RSI indicator showing a lower low pattern (which is a bearish signal) and the indicator showing a higher high pattern. Immediately after the occurrence of the divergence there was downward trend reversal in the market which can be an early signal to pullout of the market and take profit then wait for a good entry point to buy the dip.
Accordingly to the market structure formation as earlier explained, for a bullish trend continuation in a market structure, the new high created must be higher than the previous high while the new low formed must be higher than the previous low. In the same understanding, For a bearish trend market structure to continue, the new high created must be lower than the previous high while the new low formed must be lower than the previous low. Therefore, the violation of the statement above for either trend might cause a break in the market structure thereby creating a trend reversal.
DOUBLE TOP:
The formation of Double Top can be seen during a bullish market after the price tries retest its previous high by breaking forth to form a new high equal to the previous high. When the price retracement can not continue in the bullish trend it shows that the buyers are becoming unable to keep the current trend going thereby causing a reversal trend. Double tops are signs of a strong reversal patterns which traders can leverage on for a better trading decision.
There are certain criteria that must be met for a Double Top trend reversal to occur.
- The price must not go higher than its previous high.
- The closing price of the new high must not be above the preview high.
Below is a pictorial chart of a Double Top formation of a bullish trend.

DOUBLE BOTTOM:
The formation of Double Bottom can be seen during a downtrend after the price tries retest its previous low but is unable to go lower. When the price can not continue in the bearish trend it shows that the the weakness of the sellers to continue pulling down the market thereby causing a reversal trend in the upside. Double bottom strong reversal signals which experienced traders can leverage on for a better trading decision.
There are certain criteria that must be met for a Double Top trend reversal to occur.
- The price must not go lower than its previous low.
- The closing price of the new low must not be above the preview low.
Below is a pictorial chart of a Double Top formation of a bullish and bearish trend.

3) place a demo trade using any crypto trading platform and enter a buy or sell position using any of the above mentioned trend reversal/continuation pattern.
I used BTC/USDT on Tradingview paper trading platform. I also want to use Break of Market Structure reversal indicator together with Relative Strength Index (RSI) to explain my demo trade.

From the above screenshot, the market structure had a bullish trend going until break of the market structure occurred, leading to a trend reversal in the down trend.
Nevertheless, my trading decision was made with the Relative Strength Index (RSI) indicator before entering the a position for a quick trade.The RSI indicator showed that the market had a good chance of going in an upward trend so I entered the trade and placed a sell order as show in my screenshot below.

Judging from the above screenshot It can be noted that I bought at $47,068.78 and I sold at $47,144.08 therefore making a profit of $55.1 as shown below on my demo account.


Although I placed my Take Profit at $47,200.36 and Stop Loss at $47,068.76 but I pulled out of the market to avoid a loss due to the change in the direct of the RSI indicator.

This lesson has greatly impacted me on major trend reversal signals, ranging from market Structure, break of Trend lines, divergences, double top and double bottom. I have also been able to successfully register a demo trading account and I have successfully used it in making a profitable trade all thanks to the wonderful lesson from @reminiscence01.
Thanks for reading.
All screenshot were taken by me from “tradingview” and edited on corel draw & inshot app.
Hello @kingreechy (59) I’m glad you participated in the 3rd week Season 5 of the Beginner’s class at the Steemit Crypto Academy. Your grades in this task are as follows:
Recommendation / Feedback:
Keep up the good work. Thank you for participating in this homework task.
Thank you very much sir, I look forward to your next homework.