TRADING STRATEGY USING RECTANGLE PATTERN - CRYPTO ACADEMY / S5W4- HOMEWORK POST FOR @sachin08

Hello Steemians, I hope you all are doing great today. In the Previous lecture, by @sachin08, we studied about Recognizing patterns in Trading like Triangles, Flags etc but this week lecture is about Trading Strategy using Rectangle Pattern.
The lesson gave a detailed explanation of the above mentioned topic and I will be giving answers to the questions asked in the homework task from the lesson.


1. Explain Rectangle Pattern in your own word.
2. How to identify Rectangles. Explain with Screenshots.
3. Can we use indicators with this pattern to get accurate results? Explain with Screenshots.
4. Explain Rectangle Tops and Rectangle Bottoms in your own words with Screenshots of both patterns.
5. Show full trade setup using this pattern for both trends. ( Entry Point, Take Profit, Stop Loss, Breakout).
6. Conclusion.
Rectangle Patterns are trend continuation patterns and can also be a trend reversal signal, it occurs when there’s a straight fluctuations of price in an ongoing trend, it consist of two horizontal trendline and the price temporarily bounces between two parallel plane before a trend continuation or reversal occurs.
In a Rectangle pattern, the upper line serves as a resistance while the lower line serves as a support, each of the lines are seen as a trendline and the price action must hit both the top and bottom lines at least twice before a trend continuation or reversal as that is what differentiates a rectangle formation from a double top and double bottom formation. The Exit from any chart pattern is known as a breakout.
In a Rectangular pattern, a break out can be in any direction, either a breakout in an uptrend or a break out in a downtrend, either ways can occur in a rectangular pattern formation. For downward breakout, the price must close at the bottom of the rectangular plain while for an upward breakout, the price closes at the top of the rectangular plain. We can see an example from the chart below.
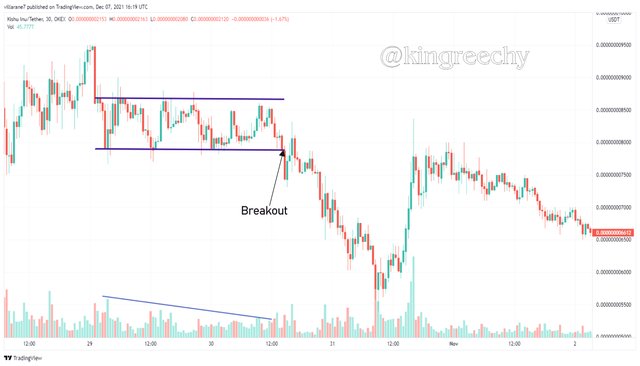
From the above Rectangle we can see that there was a breakout at the support line thereby leading to a downtrend in the price chart as displayed above.
Unlike a single trendline, the Rectangular trend lines does not regularly occur in crypto charts but in other to know when it occurs, some certain points must be observed and these points are listed below.
| S/N | OBSERVATION |
|---|---|
| 1. | There must be a rectangular fluctuations of price in the ongoing trend. |
| 2. | When a trendline is placed above and below the pattern, the price must bounce between both lines forming a parallel plain. |
| 3. | The price action must hit both the top and bottom lines at least twice before a breakout. |
| 4. | There must be a price fluctuation from top to bottom, but should have at least two minor highs and lows coming close to or touching each trendline of the rectangle. |
| 5. | Rectangles may not be purely horizontal but can also be slightly tilted upward or downward but the support and resistant line are always parallel in the same direction. |
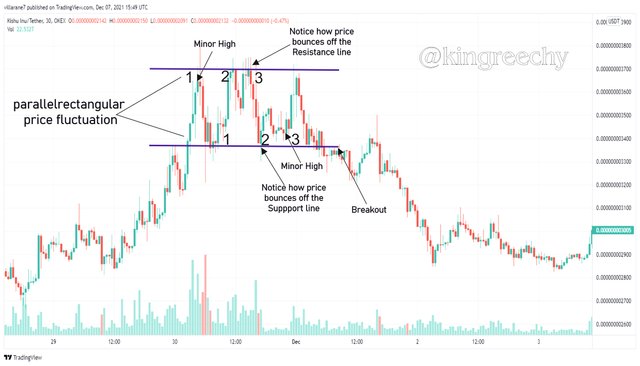
From the above chart we can see a clear description of the steps used in identifying a Rectangle in the price chart of the crypto market.
A rectangular formation sometimes often produces a fake breakout leading to a confusion as to the direction of where the real breakout will occur. Such kind of breakout are usually referred to as a minor breakout and this is due to the little break above or below the trendline. The real breakout often occurs at the direction opposite to the false breakout.
Sometimes indicators can be applied to a rectangular formation to get a possible result as to where the direction of the price will trend. We will be looking at the volume indicator with the rectangular pattern to get an accurate result from the screenshot below.
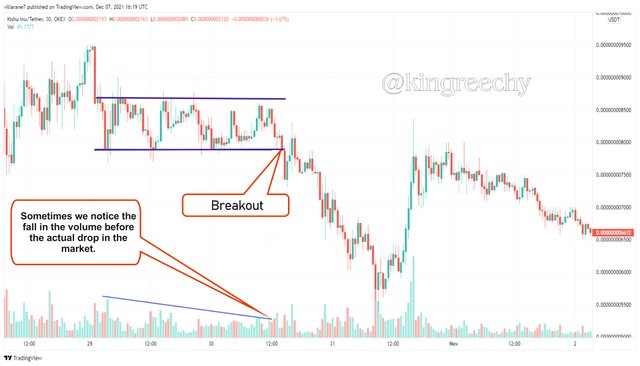
Notice how the volume of the price chart gave a bearish trend signal earlier before the actual downtrend in the price chart. Experienced traders makes use of this indicator most times in predicting the next direction of the price chart in other to know when it is best to open a trade position or to pull out of a trade without incurring loses.
A Rectangular top and bottom can be denoted from the initial direction of each of the trend line, be it an uptrend or downtrend. Rectangular top and bottom tells us the expected direction of a trendline. An example of both rectangles can be seen below.
RECTANGULAR TOP:
A rectangular top is formed when there have been a bullish trend before the formation of the pattern itself. There’s a fluctuations of prices moving up and down between the rectangular trendlines above and below the pattern, these trendline serves as a resistance and support system and after a while we notice a trend continuation in the bullish side as that was its initial direction. Smart Traders use this opportunity sometimes as an entry point. Below is a Rectangular top chart.
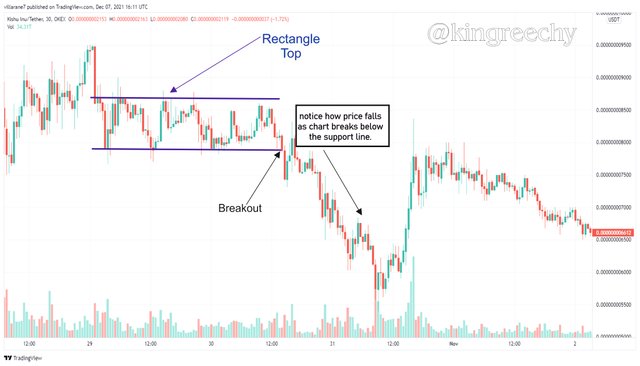
From the chart above we will notice that the price was in a bullish state before the rectangular pattern formation, then notice how the price chart move in a zigzag manner between the walls of the rectangle trendlines. After a while we notice a breakout in the chart movement just below the support level leading to a bearish trend.
RECTANGULAR BOTTOM:
Technical studies have proven that two out of every 3 rectangular formation continues in it’s initial trend direction. A rectangular bottom is formed when there have been a bearish trend before the formation of the pattern itself. There’s also a fluctuation of prices moving up and down between the rectangular trendlines above and below the pattern.
The rectangular trendlines serves as a resistance and support system and after a while, we notice a trend continuation downward as that was its initial direction. Traders use this opportunity to pullout of a trade then wait for a good entry point to buy the dip. Below is a Rectangular bottom chart.
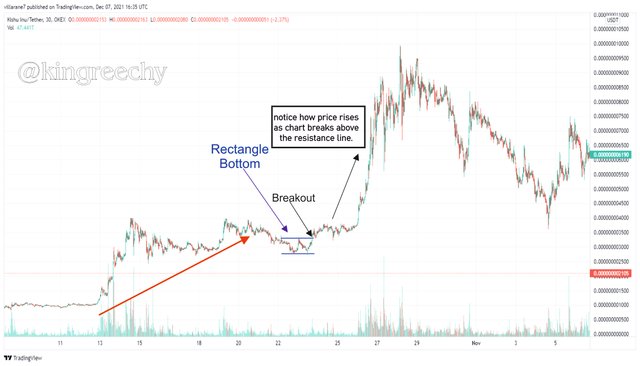
From the chart above we will notice that the price was in a bearish state before the rectangular pattern formation, then notice how the price chart move in a zigzag manner between the walls of the rectangle trendlines. After a while we notice a breakout in the chart movement just above the resistance level leading to a bullish market.
Trade Setup is a standard condition that needs to be met before a trade should be considered. A trend following trader needs to observe certain trade setups before entering or leaving a trade. There ought to be a trading plan or strategy in order to maximize profit and minimize loss. Trade setup plays a crucial role in trading hence it needs to be understood for and should be seen as a reason for trade.
Below I will be showing a full Trade Setup using a rectangular pattern for both bullish and brearish trend. I will be showing an entry point for a trade, the take profit point in a trade, the stop loss point of a trade and finally, how to identify the breakout point in a trade setup.
BULLISH TRADE SETTUP FOR A RECTANGULAR FORMATION :
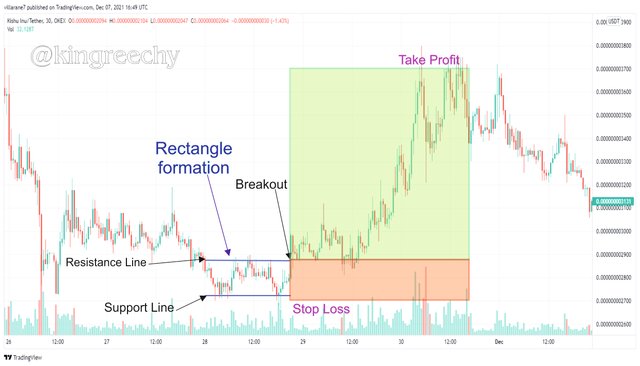
The above Buy Trade Setup shows that after the formation of the rectangle chart pattern, the price broke out at the resistance level, leading to an upward trend in the chart. We will notice a “take profit” level and “stop loss” level which is vital in a making a successful trade and to reduce losses in a trade.
BEARISH TRADE SETTUP FOR A RECTANGULAR FORMATION :
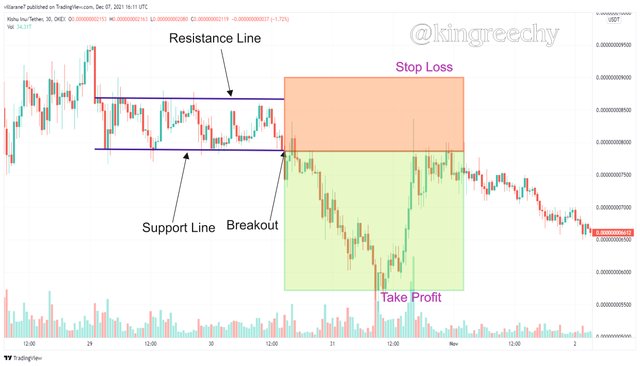
The above sell trade setup shows that after the formation of the rectangle chart pattern, the price broke out at the support level, leading to a downward trend in the chart. We will notice a “take profit” level and “stop loss” level in this chart also which every trader must Setup in order to have a profitable trade and to avoid the risk of high losses.
This lecture has greatly impacted me on how to make use of rectangular trendline in a bullish and bearish market, I have also learnt the importance of trade setup in the crypto market, how to spot an entry point, a take profit and stop loss point in trading all thanks to the wonderful lecture by @sachin08.
Thanks for reading.
All screenshots are Kishu/USDT chart and were taken by me from “tradingview” and edited on corel draw & inshot app.
Nice post, I would like to be like u as I grow on steemit