STEEMCRYPTOACADEMY WEEK16 HOME-WORK POST FOR FENDIT
Hello professor @fendit thank you very much for this wonderful lecture presented by you trust me I really learnt alot, once again thank you very much.
Introduction
share your understanding on composite man, and the fundamental laws what's your point of view?
I understand that a composite man stands still thereby attracting the public to purchase stocks that he has already accumulated, there is a line in regard to shares while making transactions that involves a huge number of shares, there is an effect of advertising a particular accumulated stocks. This helps in making a clear appearance of a particular brand market.
A composite man stands as the most valuable person (Market Maker) in such a wealthy singular institution of investors, it perhaps usually acts as a singular best profit all in order to ensure that he can purchase when the price of stock is very low and then sell in a high amount all in the name of making profit.
Retail investors on my own regard is an opposite of a composite man, retail investor has been observed as in some cases loose money often, according to wyckoff a composite man makes use of prediction strategy to determine the various prices of stocks at which different investors learnt from. Courtesy the lecture I will use a concept to figure out a simplified cycle.
The circle that I will illustrate has four different phases and they include accumulation, uptrend, distribution, and downtrend.
Accumulation
A composite man finds a way to assemble assets before various investors, this particular phase is basically labelled a sideway transgression movement, gathering the various assets is done simultaneously in order to avoid the price deviating significantly.
Uptrend
Let's assume the composite man upholds a massive shares, and the selling price becomes very low what he needs to do in this ocassion is to start championing the market up. Naturally the composite trends finds a way to attract more investors thereby causing the demand to increase.
Note
There may be double phases at which accumulation of Uptrend is observed, we may in this regard name it re-accumulation phase on this facet the higher trend puts to stop and makes up for a while before it's upward movement will then take place again.
When the price of market moves up as they usually do, many other investors out there basically are advised to purchase enough stocks, other public people can key in because when the demand is high the supply will be high too.
Distribution
In this phase the composite man has no issues here what we need to do is to start sharing his stock holdings, he will be pushed to sell his accumulated stocks to those investors who enters the market at a large stage. In this regard the distribution phase is labelled by a root-way transgressive movement that socks the demand in units although it gets exhausted shall.
Downtrend
After the distribution phase the volatile market will then start retarding downward, in other ward after the point composite man has finished selling his stocks, the market will start going down. In this regard the supply will be higher than the demand and the Downtrend is established.
Similarly to the Uptrend phase, the Downtrend in this regard may be tensed to have a re-destribution phase, basically there are short term enthusiasm between the price retardation between the massive prices drops, this particular one comes in conjunction with dead cut bounces or the bull trap in this particular one some investors gets trapped, thereby having in mind for a reversal in trend that hardly happens. If the bearish trend is finally over, new phase will tend to accumulate.
Fundamental Laws
There are three types of laws and I will be highlighting then all here.
The law of supply and demand
This sounds like economic studies, this law states that when there is much demand than supply price will rise, and there will be a drop in the opposite. We have one basics principles of a financial markets and it isn't removable to how wyckoff works. Let me represent this law with the equation below.
✓ Demand > supply = price rises
✓ Demand < supply = price drops
✓ Demand = supply = No significant price change (low volatility)source
Let's me dwell on the first wyckoff law which clearly insinuates that there is an excess in the demand of assets than we have in supply. Different prices tends to move up simply because move people buy than sell. In the financial market. Now let's take a situation where people sell than they buy, then the supply will then surpass the dead this might cause the price to drop.
As an investor I follow Wyckoff method company the various prices to volume bar serves as a way to better see the relationship between supply and then demand, this particular one in most cases provides an insight in the market and the movement of prices.
Law of cause and effect
This particular law states that there are Difference between demand and supply both not at random, thus they come to fruition after thoroll preparations. In wyckoff terms the periods in this case takes time to accumulate (cause) eventually strends to an Uptrend (effect). In this case a period at which distribution takes place basically results to a downtrend effect of prices in the financial market.
Wyckoff implemented a standard technique that is used in chatting today and the various effects of a cause in many terms, he galvanized a standard system of trading this one basically targeted prices based on the time frame of accumulation, and distribution. By so doing he was able to estimate the profitability extension of the market Trend after trading.
Law of Effort vs Result
This is the third law of wyckoff and it states that when there is a changes in any assets/prices, it is a comes as a result of an effort, represented by a trading volume. If the price in particular with the volume is executed then the trend will keep on trending, but if there is a downfall in the price the market will change its fortune.
Share a chart of any cryptocurrency of your choice (BTC or ETH won't be taken into account for this work) and analyze it by applying this method. Show clearly the different phases, how the volume changes and give detail of what you're seeing.
Nice question here I will be showing a chart of two pair of cryptocurrencies Shiba Inu and USDT, SHIB/USDT, I will use a wyckoff method on the chart below to analyze, courtesy Huobi global take a look.
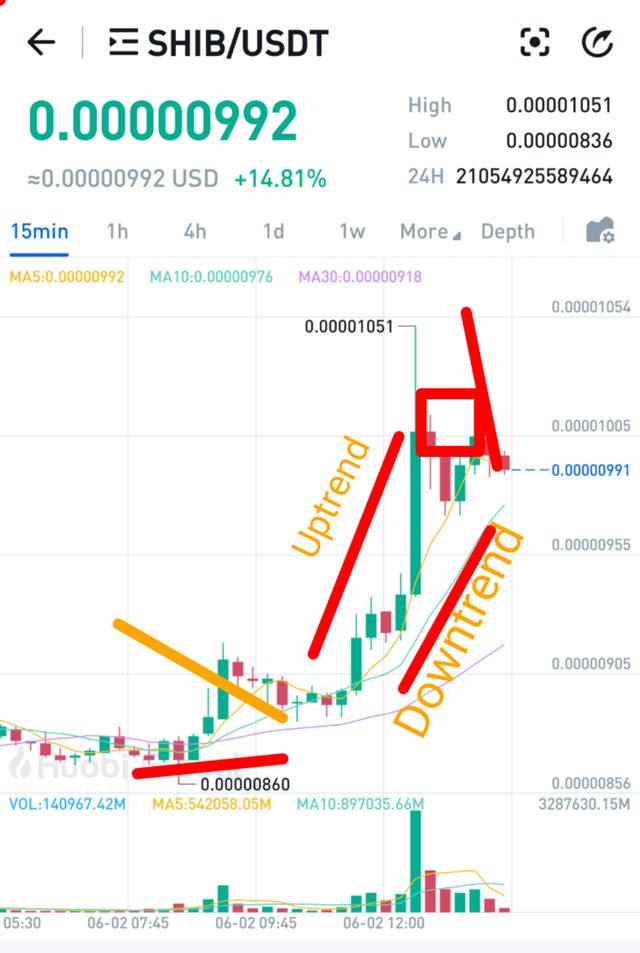
From the image uploaded above I will be analyzing using wyckoff method as you can see from the image some specific areas has officially been labelled out, expecially the Uptrend, and the down, trend, also the accumulator etc.
Price moving Uptrend*
From the chart above you you will understand that the market experienced a fluctuation since yesterday up-til now that the analysis been done as at yesterday there was an Uptrend regarding the price of SHIB/USDT, at a volume at about 140927.42m, it experienced a downtrend, later today in a bearish method in this case investors will be forced to sell their assets in order to make some cool cash.
Price moving downtrend
As at today the market experienced a trend at this time the volume is very low, this basically is the time investors need to accumulate assets so that when it rises they can sell and make massive return in their investment. Some key technical analysis of my have been done and I realized that for newbies short trade system is really the way forward for those who isn't good in technical analysis.
Accumulation
In this case weather the market very volatile indeed I must say experiences a downtrend or an Uptrend won't necessarily be your concern because you will serve as a composite man the volume change isn't so specific as the market in general isn't stable. So the volume tend to change from time to time.
Distribution
A composite man tend to distribute assets that has already been accumulated in this regard some assets may be Oversold, but this can most-likely be done if there is a high demand in the price of a comodity at that particular time, it doesn't naturally matter the volume of the market at this time assets can be shared.
Conclusion
Thank you very much professor @fendit your lecture is fantastic once again thank you very much I really learnt alot.
Cc:@fendit.
Thank you for being part of my lecture and completing the task!
My comments:
There were some answers that were not ok, for instance your analysis on the composite man.
As well as that, the chart's not clear and the phases have not been properly shown.
Overall score:
4/10