STEEMCRYPTOACADEMY WEEK14, HOME-WORK POST FOR FENDIT
Hello professor @fendit thank you very much for reading through I really appreciate, trust me I learnt alot.
Before I answer the question straight ahead let me highlight little about Elliott wave theory, it's more like talking about Dow theory they both recognizes different stock prices accelerating in waves. Elliott in addition knew thefractional nature on how trading market works thus he was able to do a breakdown and he systematically analysed the market in great details.
Fractals are very calculative mathematical it signifies the various sounds on a smaller scale, Elliott was the very first man to discover a stock index price structure shaped up in a particular way. As an intelligent man he galvanized a pattern on how predictions in the market can be possible, there was also indications of future market moves.
Elliott initiated a financial price trend resulting from investors overall physcology he discovered swing in the nature of physcology always towing toward a structured wavelength financial markets. Ralph Nelson Elliott was the man who developed the Elliott wave theory in the year 1930.
We are talking about the application of Elliott theory, there are different ways trading the patterns too are cool, you have to choose any pattern that you like.
Zigzag pattern
Triangular pattern
Flat (Range pattern)
First and femous if you as an investor begins trading on a volatile financial market you will be delighted to select Elliott wave theory as your auxiliary method for your all important analysis, you will be condemed to understand that there is a strategy a way to access possible movement of trends at a particular time.
This this theory in question is more like a galvanized/assembled observation instead of a constitution or 100% valid prediction in the market movement of assets up and down, before you become perfect on it you have to do a comprehensive study for several years of you want to be a successful trader you need to learn the key basics analyzing skills, at the time of learning you will as well as understand the various conditions before placing your trades.
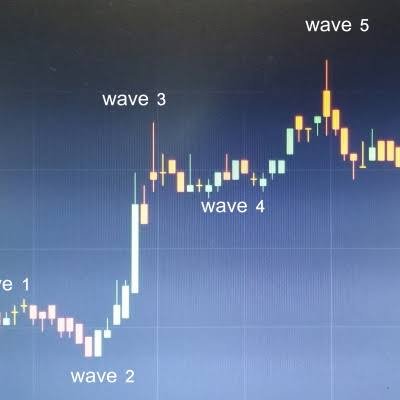
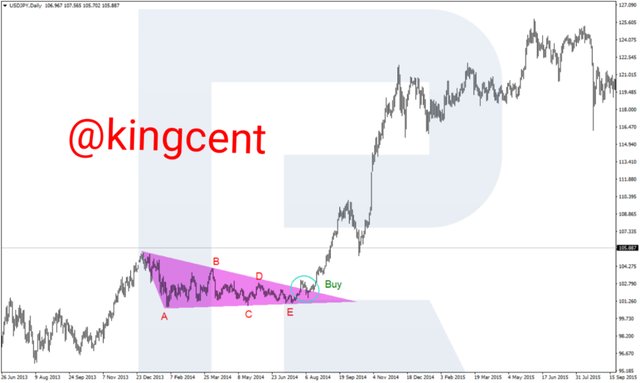
If you as an investor/trader is concerned about the Bullish phase the first, third, and the fifth, wave are ascending, you need a concise interpretation as limed signal to buy, in the number second and fourth wave, you are this condemed to sell. The real task of any trader will be the ability to detect the end-point of the bearish phase and the starting point of the cultural Bullish phase.
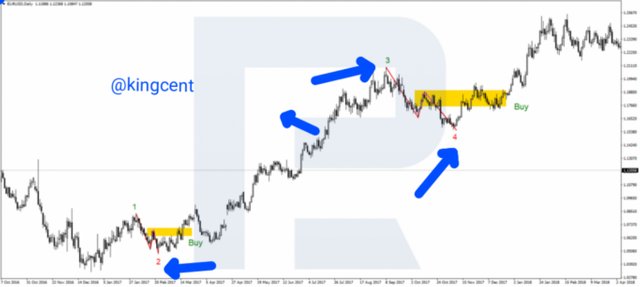
Following the above example still on the application of Elliott wave theory, for you to buy you need to place a pending buy stop order at the head of the peak, for the first and third waves, and for you to sell, you need a sell stop under at the climax of wave A.
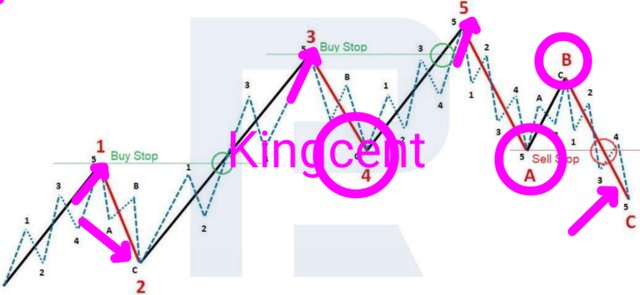
Many will know from the image uploaded that the potential gainful movement after entering this trade is never enough thus even too weak. What you need do next is to recommend a deeper analysis toward the market wave structure e.g, you turn a lower stage to be able to track and discover more meritable entry point.
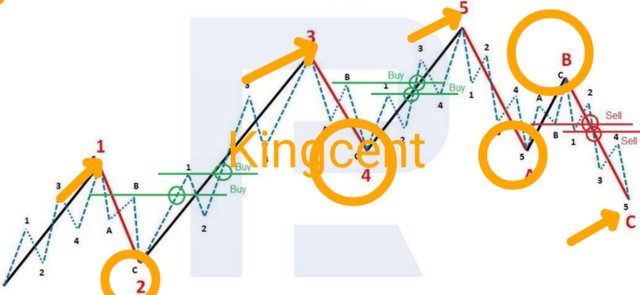
Turning to a lower level simply means searching for the peak in-between the later stage of wave B, and the bigining of wave C, in the second and fourth correctional wave you tap buy stop order above then. The subsequent peak of sub wave one(1) of wave three(3), and five(5), is of a greater level. You as an investor can use this secure method to discover different points in order for you to sell on wave C, maybe after you must hat finished the sub-wave B, including wave B, and A, breakout of the end of wave one(1), in the impulse C.
Trading pattern
Zig-zag pattern
When you hear Zig-zag the first thing that comes to mind is a situation where something isn't stable, but in this case Zig-zag is widespread nice pattern, it is basically seen on different charts more likely than others, it has a very simple structure, we have three wave pattern namely wave A, B, and C.
Zig-zag can be differenciated from other pattern not by the way it appears but by the structure of it's regular parts, imagine wave A, and C, are 5 wave impulses. There will be a method that links wave B, and a little Zig-zag, sometimes formed as low flat triangular form. When you have the Zig-zag formed you must hold on for an impulse to point toward a trend of a particular form.
Triangular pattern
A triangle can be known by joining the heights and downward pattern by lines, remember all waves has a triangle of Zig-zag each have a 3- wave structure, I will show an image below to justify that.
One thing that is common about this pattern is the main fact that waves 4 or B of a zigzag, the most interesting part is that you can trade after all the three different parts of the subsequent patterns has been formulated, wave A,B,C,D and E respectively.
An impulse wave is a kind of trading pattern deployed in technical trading, the term described a rigid move in the financial assets, the price tend to mix with each other on a particular direction.
Impulse wave pattern is used Frequently while talking about Elliott wave theory a key method for the comprehensive analysis and price forecasting the volatile financial market the movement toward the price of assets. Impulse wave in most cases is referred to as the movement in the higher trend desentegration in downtrends.
One thing i so much like about impulse wave is the pattern that it relates toward Elliott wave theory, it paves way for Different strings of waves to last for hours or more various impulse wave are showed in the image that I will be uploading soon.
First wave, I tag it wave 1, wave 3, and wave 5, seemes to be constant while plotting wave. It ranges from wave 1,2,3,4,5. They are all poised to forming a one ledger degree.
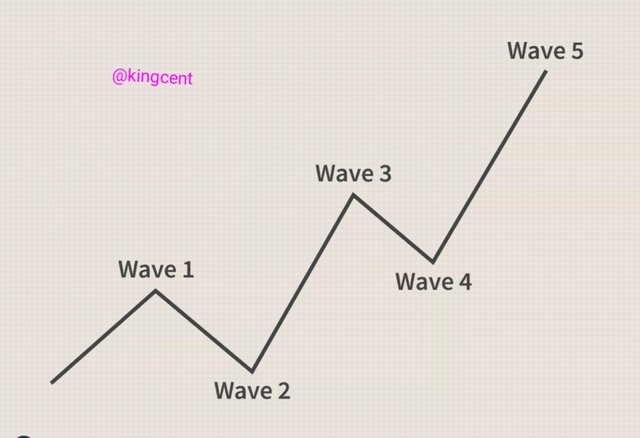
Impulse wave makes up a five sub-wave that contributes and points toward a particular direction as the trending assets at that particular time of asking on like a motive way that consist of a five sub-wave.
They are three in number and they include two corrosive waves, galvanized as a 5,3,5,3,5. Standard structure some of the conditions are that multiple wave or two can't retrieve more than 100%. Of one wave/ wave one. Wave three (3), can never be the shortest of the subsequent wave one, 3 and 5..
Important point to Note
Impulse waves are key trend making sure that different pattern are known by Elliott wave theory.
Impulse wave are made up of five sub wave that moves back and front in a particular direction.
Elliott wave theory method are technically gifted analysis analysis that tend to reduce a long term pricing pattern.
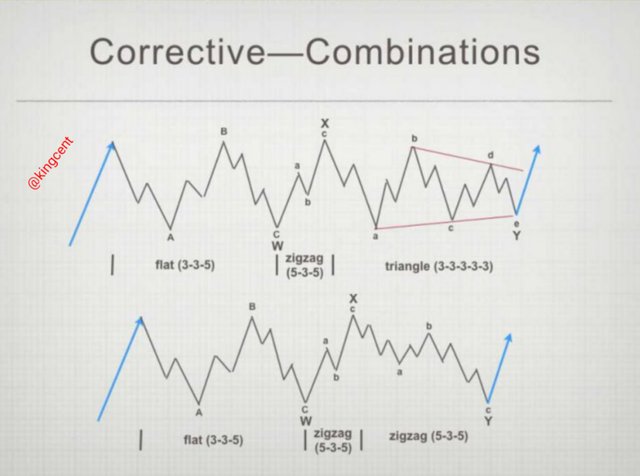
Corrective wave
Corrective wave are pieces of financial assets pricing movement method associated to Elliott wave theory with technical analysis, this two types of wave can be used to detect the various price of trend in the financial market and security too.
It operate in a Zig-zag manner a point where wave A and other wave can't be the same.
It becomes flat, all the wave become the same in tense of it's length.
Elliott wave theory is good to be used while executing your Trading, for me using it I will add a technical analysis too so that I can easily describe the price movement easily.
I so much like the theory and I discovered that it is very easy to identify Different wave that is set up in a specific pattern in order to oppose a larger trend.
Setting each set of wave is rested within a larger wave so that it can adhere to the same impulse and the corrective nature will easily describe the fractal of investment.
I discovered that Elliott wave theory makes it very eazy for Different investors to calculate the market volatility thereby knowing and monitoring the uptight and downward price index. Market forecasting are centralized on Elliott model.
Choosing a coin chart I choose STEEM/USDT
Giving a practical example about Elliott wave theory I'm using STEEM/USDT two days.
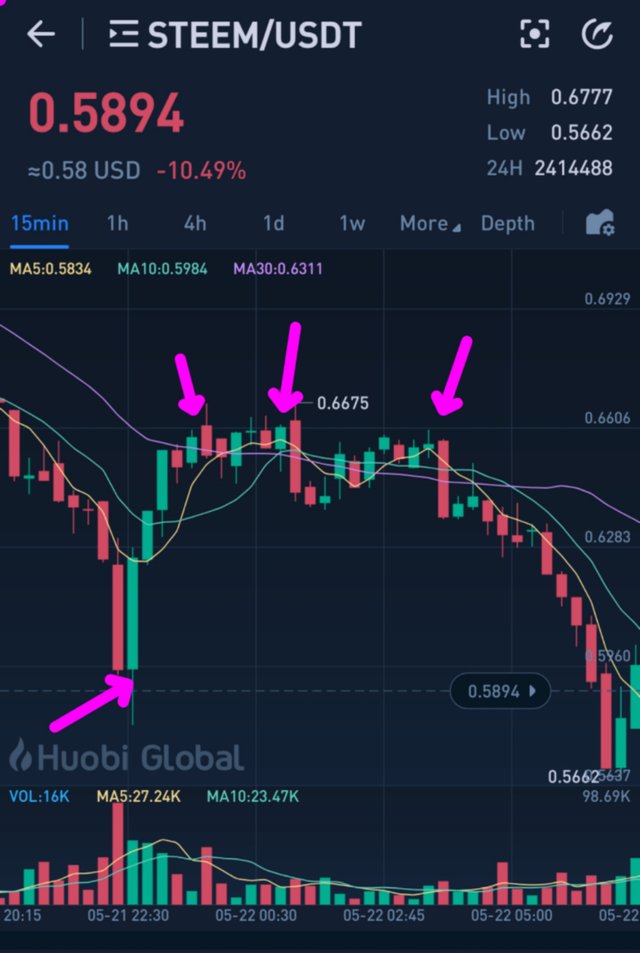
From may 21- may 22 2021. From the image there are four wave, watching critically on 21/05/2021, the price of steem went up to 0.5894% people started selling to maximize their profit that is the ipressive aspect of the market once their is an uprise in the price you find out that investors takes advantage, although people still bought too hoping that the price further increase.
Today been 22/05/2021, the price is dropping at this particular time investors won't sell because of the drastic drop in the price that is wave 3.
On 21/05/2021. The price kept on flotuating and wave A, since it comes before other waves changed the structure of wave 1,2,3,4.
✓ wave 1 >_ wave 2
✓ wave 1 > wave 4
✓ wave 3 is practically shorter.
Conclusion
Thank you very much professor @fendit I really enjoyed your lecture, thank you in advance as you review my post
Cc:@fendit
Thank you for being part of my lecture and completing the task!
My comments:
Your work doesn't make much sense to me.
In some parts, your answer had nothing to do with what was asked and in some other parts, it just seems as if you copied things from different places and got the words spinned...
As well as that, you didn't show the pattern correctly.
Overall score:
2/10