STEEMCRYPTOACADEMY SEASON3, WEEK1 HOMEWORK POST FOR KOUBA01
Hello good steemit people I bring you greetings from Nigeria I'm excited that cryptoacademy is back this for SEASON3, hopefully this time around we will steam to the moon.
What is the Ichimoku Kinko Hyo indicator? What are the different lines that make it up? (screenshots required)
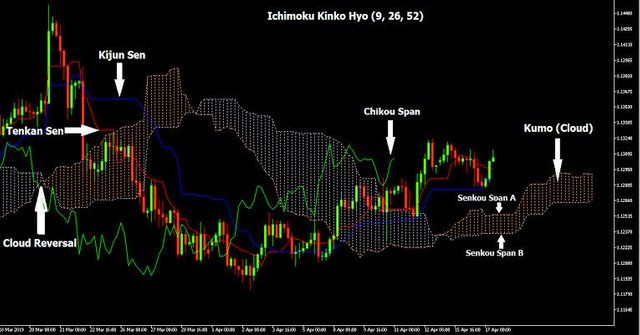
Inchiomoku kinko Hyo is refers to as an indicator basically used to guage momentum, in this regard there are areas of vital support and resistance. They fall in a single indicator, the indicator may be compromised in different facet of lines they incluses, tenkan-sen, kijun-sen, senkou spanA , senkou spanB, and chikou span.
Ichimoku was invented officially in the year 1968, on like most technical indicators and chart pattern, let's not forget that application is key and it's usually galvanized by statistics all requires lot's of mathematical calculations, this particular ichimoku was invented by a man called Goichi Hosoda this particular indicator went viral as it came to usage by so many people including some citizens of Japan and beyond.
It can be used to test the price action by so doing a greather trade is been initiated all comes to fruition through different lines-drawn, now imidiatly you apply a chart in a particular facet you can now translate different components that are accepted by the indicator.
What are the different lines that makes it up?
There are different lines that makes it up and I will be highlighting the various lines as the home-work proceeds.let me start with the first one.
Teken- sen
When a line is high there will be a higher one there you have high/higher, and in reverse low/lower, in this regard the lines will be calculated and divided by two (2). When this calculation's are done it is usually tracked back in order for the previous line period to be calculated.
Kijun sen
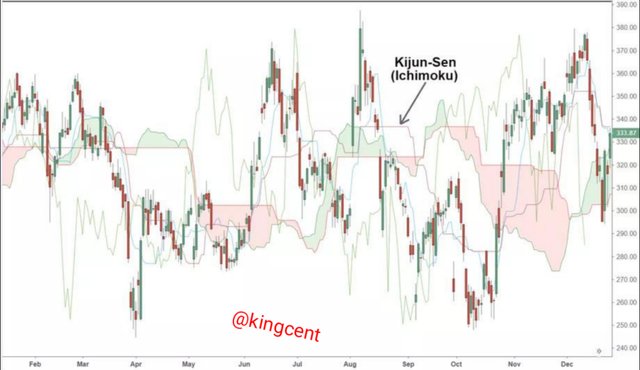
The calculation in this regard is similar to what we have in Teken-sen, but the difference here is that Kijun takes and tolls the previous 26time-frame periods into account. As a trader what you need to do is to make use of the cross-over in order to bring up the position, it looks alike on like the moving cross-over let me show some screenshots here for further explanations.
From the picture I uploaded you will find out that the Cross-over of Tenkan-sen (the black-lines) and on the other hand the Kijim send (the red-line) at a fixed point X. There is a decline this simply means that the closer-figured prices are dripping downward while the longer the price trend, this will push to figuring out the Downtrend or the price will move lower.
Let me further highlight the most vital phase here, this is called the Ichimoku cloud this one indicates and figures out the newest price action. It's behavior is in a simple support and resistance thereby galvanizing a formative barrier.
Senkou spanA
In this particular one the total number of Tekan sen and kijun sen is totally bisected by even number 2. Now when doing the calculation it has to be plotted in different phases in 26 times periods, some will surpass the current price and so on.
Senkou spanB
This has to do with the total sum of the high and low lines divided by 2, this particular calculation is put into concedration, checking out the frame it will be within the range of 52, and the period will be plotted in 26 period ahead.
How to add the Ichimoku indicator to the chart? What are its default settings? And should it be changed or not?(screenshots required)
Ichimoku kinko it can also be called equilibrium chart is isolatory, something can be in equilibrium when it is equal along the process it can be static in FX market today very volatile though, there are lots of probablity. Using ichimoku indicator or the application of this indicator is equity.
Applying it gives room for double test, it also combines various indicators in a single chart, before you go into trading you need to bear so many things in mind one key thing is knowing the various components that contributes to the effectiveness to ichimoku chart very important.
After knowing that a trader can further proceed to carry out he/her chart effectively, when we talk about how to apply ichimoku indicator to a chart it requires alot and most times it is been done by intelligent people, staticians it mathematical gurus in the trading industries. Let's not forget that this particular ichimoku indicator was constructed by Goichi Hosoda, a very intelligent man.
Applying ichimoku to chart you need to consider a four major component and the vital offer it brings, also you the trader must have a concise insight into the market and how it works, also the price action too very important. The first thing is to consider the. Tenken and Kijun sen's lines. The above mentioned lines are basically used prior to the moving average that cross over, it can also be applied along to as a per of 20-50 days moving average, different timeframe is key here.
Ichimoku default settings
The best Ichimoku settings for forex, it's default settings can be 9-26-52 for forex trading
this show's the best results in this particular case study. Remember Ichimoku settings can be adjusted in order to suit a 5-day week at 7-22-44, then 9-30-60, or even 12-24-120 for trending markets, Note.
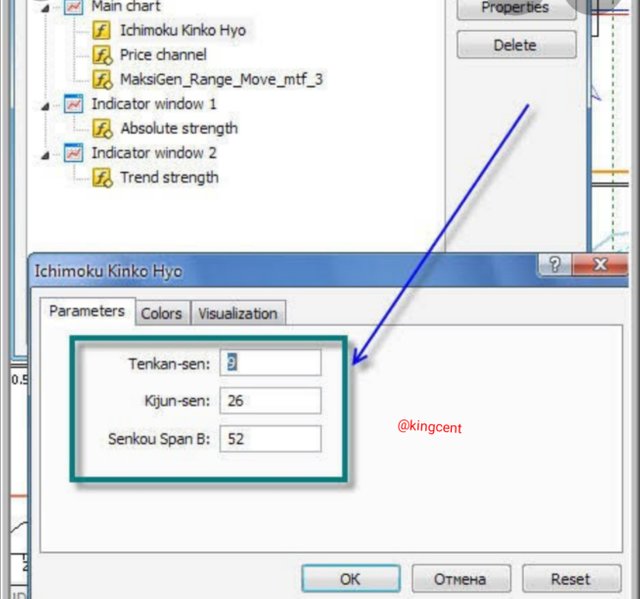
| Ichimoku | settings |
|---|---|
| Tenkan-sen | 9 |
| Kijun-sen | 26 |
| Senkou skan B | 52 |
If you have been on the trading platform for a long time now you will understand that the ichimoku kinko is more like an aparatus to facilitate the lines, be it horizontal or vertical or the diagonal assistance that tends to resist or support Different phases in a chart. It also assist/help traders to facilitate he's or her assets in the Uptrend and downtrend for a particular time frame.
The various default settings of ichimoku lines
works with the various lines drawn. It works effectively prior to the way the settings appears, the time frame in which the curve fittings is instructed will bootress the way it will work, let's remember that trading isn't 100%, in a trading market there are always profit and looses.
Total intensive research shows that the settings of 9,26, and 52, is the key settings for making optimum benefits with ichimoku, it was derived that number 26, as standard business month in Japanese doesn't involve Saturday though. Number 9, signifies to been a week and number 52, represents 2 months. The standard settings will then be 9, 26, and 52.
Some experts have had some debates regarding the settings of 9, 26, 52, whether it's the best since Saturdays are excluded in their working days, Decentralized market doesn't business time frame you can be in your toilet and still trade, ichimoku default settings for me is the best there is an alternative for you if you do not cherish ichimoku, you can use Bollinger band they both are familiar.
Should it be changed
For me I think , the default settings should be adjusted in some ocassion at least to fit the market Trend at that particular time of asking, since so many experts have analyzed and in general the setting of 9, 26, 52 is very important and regarded as one of the best. Another thing to note is the environment where you finds yourself is key because of the time frame and the network capability too.
How to use the Tenkan Sen line? How to use the Kijun Sen line? And How to use them simultaneously?(screenshots required)
Tekan sen line
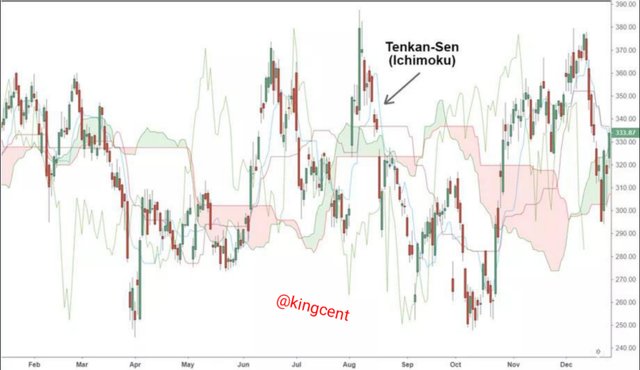
Tekan sen line has a baseline of 26, most traders sees it as a signal for buyers, from the image I uploaded the cloud path of the indicator is key you can use it to identify trends, if the price push up above the cloud that means the trend is up and vice versa. In order to make use of the Tekan sen lines you must note all the strategies there.
We have what is called shoppy Trading at this point the trend tends to reverse at this point Different investors will tend to make their purchases when the price boots above the cloud, if the Tekan sen line crosses above the Kijun sen's line holders may be longer troat to sell off their token as well.
When the price is in downtrends that is below the cloud you as a traders May also be tempted to sell too, note again when the Tekan sen line crosses below the Kijun sen, not crossing above this time around, you trader in this ocassion will stay Abey up until Tekan sen reverses and cross backward.
How to use kijun-sen Line
The line is an indicator and it is a component of ichimoku cloud, Kijun sen line basically signifies it's mid-point in price of at least the previous 26 periods this indicator assist in a general assessment of various trends, it can also be used to identifying trading gaps, by so doing other components of ichimoku cloud will be combined.
kijun-sen line is used together with Tenkan-sen lines, it's mid-point price is used to generate signals for trades each time they cross over.
The lines are isolated despite that you can still use it to together with other ichimoku indicator's.
Kijun-sen lines is used when the price is above therefore short term price is determined and the momentum will rise up, when price is below kijun-sen line then in this ocassion the momentum is regarded low. Using this indicator one has to be very careful.
How to use then simultaneously
Using the both line simultaneously you will understand that there is no much different the cross over signifies buy and sell signal's, using then simultaneously will help your trading capability as you can be able to determine different price action toward a particular direction thereby knowing when price is in bearish phase.
using the both indicator simultaneously helps to identify different trading opportunities, as there is no much different in using it simultaneously, let's also remember that in trading you can get it 100%, there will be gain and you will loose too.
What is the chikou span line? And how to use it? And Why is it often neglected? (screenshots required)
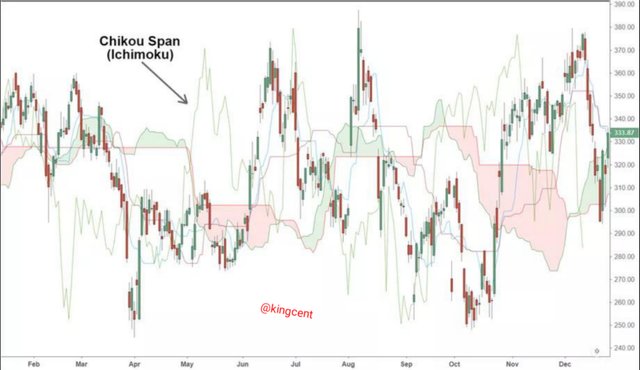
Chikou span line is a component of ichimoku kinko it is used while plotting a graph of close prices in the line of 26 period when there is a latest price trend, it allows different traders to see the relationship that exist betw the prices that are trending at that particular time, and the trends too that are reversed.
Trends are seen in upward direction imidiatly the chikou span appears above the price, downward is when you have the indicator appearing below the trending price as an experience trader what you need to do is to watch the chikou span very well to identify the different crosses prior to the signal that brings about trend changes.
How To use it
While plotting using the line let the closing price of 26 period be directed behind the previous candle-stick/bar.
Use the lines to guage the momentum of the various trends so that the lines plotted can help in identifying trends.
The lines are in paripature with so many other components in the ichimoku indicator's and in most cases it is neglected forgetting that it can be used to generate various trading signals.
Why is it often Neglected
For me I feel the reason most traders often neglect it is minimal, now if you watch you will understand that the cross over lines helps to fish out trends changes, in this case most traders neglect it because of various false signals.
Cross over can be made without showcasing vital price trend for traders to follow thereby making traders to be static.
Different traders May be tempted to be isolated intense of the reaction of the price thereby switching and using fundamental analysis and adopting other indicators prior to their trading.
What's the best time frame to use Ichimoku? And what is the best indicator to use with it? (screenshots required)
Time simply has to deal with the longevity at which a particular thing is exhausted, ichimoku works effectively for visual traders prior to other indicators we have one of then is the Bollinger band and all the rest.
The various signals that appears on chart comes with various time intervals so adding ichimoku on your 30 minutes chart, there is every possibility of you getting different signal's the indicator that you are using is basically calculated by the system that you are using regarding your timing interval.
For me I will prefer a short time frame interval, I will like to go with a 2 minutes and 7 hours chart, I uses ichimoku in my daily and my weekly chart too. You as a trader it will assist you in getting an over view insight on the market sentiment me as a trader I rely on many indicators in order to get a clearer picture while analyzing my market.
What is the best indicator to use with it?
For me I will use the RSI indicator and I think it is the best, ichimoku indicator is basically structured in order to keep track on the RSI in a set window. It helps to assisting you in any strategy that you deploy it won't totally be replaced then.
Chikou span line is very important simply because it helps traders to review an high and low when we have trends, you may hope on your trends during your trading for you to see the various features of the indicators.
The last colour must be changed frequently so that the parameters will work effectively I will advice that you use the ichimoku itself, while trading through technical analysis in a similar method. Remember your buy and sell area will be confirmed this can further help/assist you a trader to minimize your risk.
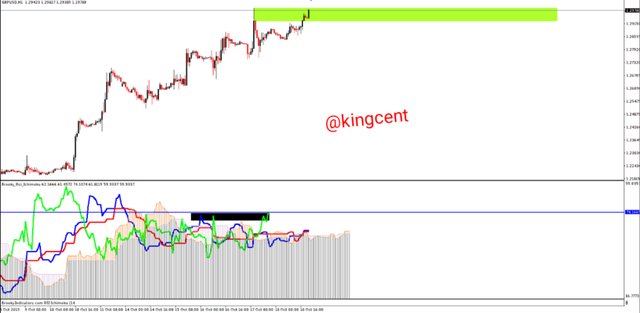
From the chart above trading using technical analysis you can be very optimistic to place a trade either sell or buy in scalping with a minimal profit and small low stop-loss too. If you as a trader is making use of the RSI ichimoku indicator for MT4, from the chart the black axis in the indicator identifies that the spot is broken.
Disclaimer
Using the RSI indicator isn't 100%, we shring ideas that might come to fruition, you are adviced to keep on testing the chart in your Demo account try to analyze it to suite you so that you will come out with flying colours.
Conclusion
From the lectures you will understand that Ichimoku was developed by Goichi Hosoda, a Japanese journalist, a mathematician and he published in the late 1960, this year my country gained independent.
Ichimoku has different lines it includes a nine-period average, of 26-period average, an average of those two averages, we have a 52-period average, and a proper closing price line.
From the lecture I posted Ichimoku show's the best results in this particular case study. Remember Ichimoku settings can be adjusted in order to suit a 5-day week at 7-22-44, then 9-30-60, or even 12-24-120 for trending markets, Note.
Trading is done through different indicators not only using the inchiomoku kinko, you as an experience trader can rely on various indicators for effective trading's although I understand that Trading has it up and downs as you can profit and loose too as well.
- When the various line crosses it provides trading signals that a trader can leverage on thereby knowing the Uptrend and downtrend in the pricing capability, you can also know when to buy and when to sell through the crossing of the lines.
Hello @kingcent,
Thank you for participating in the 1st Week Crypto Course in its third season and for your efforts to complete the suggested tasks, you deserve an 8.5/10 rating, according to the following scale:
My review :
A well-content article in which you presented the homework perfectly and in a clear manner that gives an indication of your research efforts. I have two observations that I want to make:
Thanks again for your effort, and we look forward to reading your next work.
Sincerely,@kouba01
EASY! How to invest smartly & securely in a DeFi project
Click this link for more:
https://bit.ly/freecrypto_class
Discuss, have fun, and let the potential of $PRV blast on the whole universe.
Farming, Staking, & Vaults