Swing trading homework by @khamara lecture by @yohan20n
My understanding of swing trading
Swing trading is trading based on holding trades for a longer period of time. It is trading that entails the trader to keep open traders for days, weeks or even months at times!. This trading style s set to pt a priority on the right profit to loss ratio and involves reading the charts with bigger time frames, and according to the lecture given by professor @yohan2on, the smallest chart timeframe should be the 1-hour timeframe.
This is because swing trading relies on trends. The trader places trades based on the trend he sees or notices from bigger time frames like the daily time frame and then goes a little smaller in time frame to find a suitable entry point. Another important thing that a swing trader observes is the small margin usage/lot size usage, and adequate stop loss and take profit.

My crypto-asset pair choice: ETH/USDT
I have chosen ETH/USDT pair because this pair is old, it would have provisions of charts in daily and even weekly timeframes. This will give me the time frame i need as a swing trader to analyze the market effectively.

Trading strategy
Below i will show in a table the exact parameters i wish to be using on the trade i would like to place on the ETH/USDT pair:
| Pair traded | ETH/USDT |
|---|---|
| entry | $2248 |
| preferrable take profit | $3048 |
| 2nd choice exit | $2806 |
| stop-loss | $2048 |
| the preferable percentage for exit | %50 |
| time expectation | 1 week at most |
| 1st profit target | $700 |
| 2nd profit target | $ 500 |
| loss target | $200 |

Multiple time frame analysis
for this part, i am using trading view to analyze the charts. i chose trading view because they have a wide range of tools, and their charts are very resourceful.
as I said earlier, ETH/USDT gives us the chance of seeing a profound weekly chart. so I will be using the weekly, daily, 4 hourly, and hourly time frames to analyze and find my entry point.
weekly chart
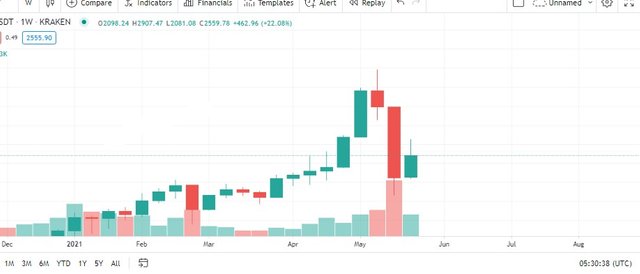
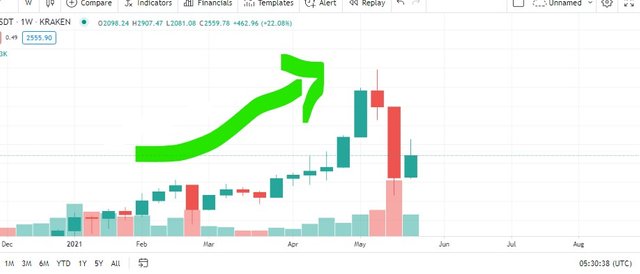
the weekly charts above show us a short uptrend that the ETH has been pushing with over the USDT, with a sudden retracement or we could call it a correction in price.

Daily
On a daily time frame, every candle represents the price behavior or summary of the price movement for a day.
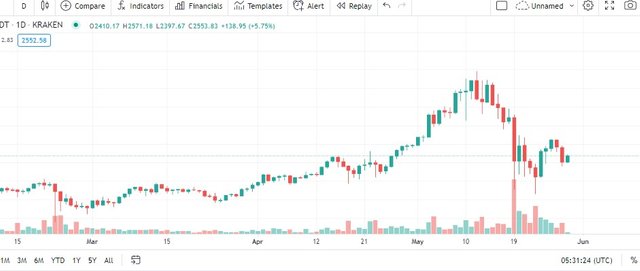
now as you have noticed, the daily chart is more spread out, and more detailed.
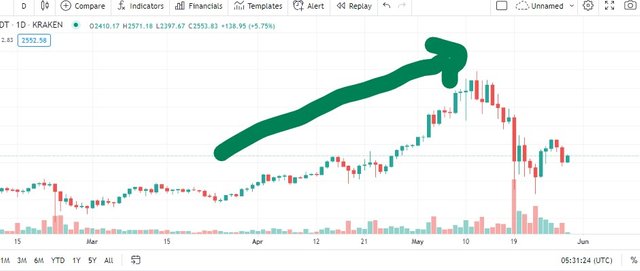
The daily time frame elaborates more on the uptrend of the ETHUSDT market. this implies to me that whatever trade i am planning on placing, it should be under the influence of the bull!
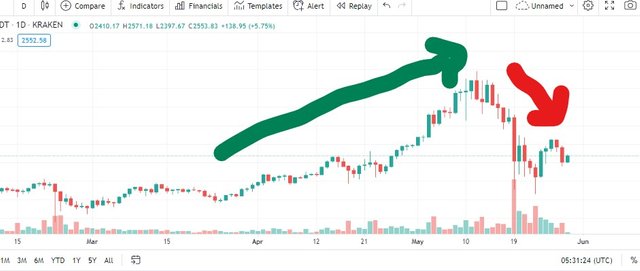
the above chart highlights the recent correction in price even more. I see this as the perfect time to place a buy trade and hold it because the trend is an uptrend, and this is a very low price from what was formerly reached.

4 hours
The 4 hours chart elaborate it even more, let's look at it below;
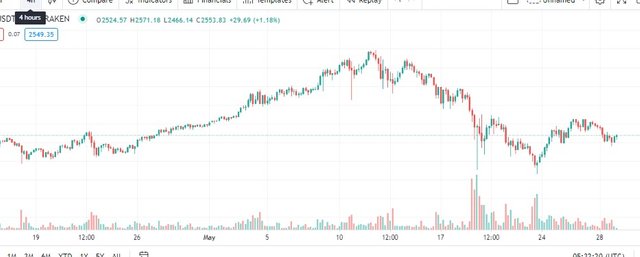
you can see how the number of candles have multiplied, and there is a wider chart in general, elaborating all the major movements of this particular market.
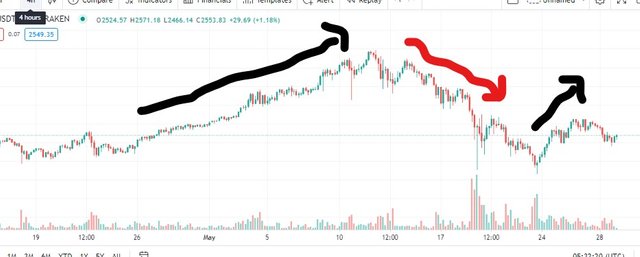
The 4 hours chart shows us the smooth uptrend, followed by a coarse downtrend and then a potential start of a new uptrend.
Now we can proceed to using tools to analyse the trade and find sniper entries for the swing trade.

Candle stick analysis and use of indicators for my trade decision
Following our former identification, we have achieved the identity of the trend of this market at the moment. we concluded from the above that ETHUSDT is generally on an uptrend, but recently got corrected recently.
I am going to use the Fibonacci retracement indicator to analyze the chart properly, together with some other candlestick indicators i recently learned over the internet.
weekly chart
first, i would like to start with the weekly chart, this is to properly build up my opinion on my take about what trade to open.
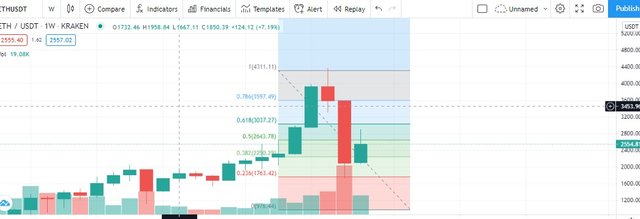
I have proceeded to draw the Fibonacci retracement indicator on the weekly chart. Most traders don't go through this stress, they rather just go to the daily chart or the 4 hours chart because it's easier to read, but i want more evidence to prove my decision on going long or short, so here is my analysis below.
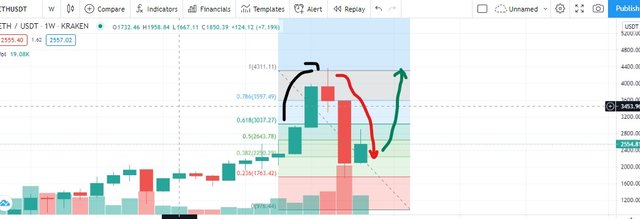
Here the arrows indicate the movements of the market of four candles of the weekly chart, keeping in mind that one candle represents one week on the weekly chart, this means we are currently analysing the price behaviour within the past month.
The black arrow shows the former up trend that the market was on, with one medium sized and one long green candle. The candles get to a $4359 all-time high point, and it seemed like the sellers took over.
The red arrow shows the just recent downtrend, in just to bearish candles, it touches the red zone line on the fibonacci indicator and bounces off that line.
The green arrow shows my prediction of price direction in the near future, given the out look of the candles on the Fibonacci indicator.
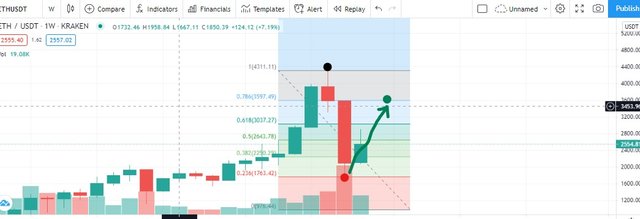
The chart above highlights vital price points with the use of dots. The Fibonacci retracement indicator has given me a good picture of how the market movement would look like in the future.
The black dot:
this is the all time high for ETH this year, at a price of $4359 but it did not seem to last long at that price.The red dot:
The red dot shows the lowest point of the price as regards my analysis. this price is at $1750The green dot:
The green dot shows my personal expectation from the market in about two or three weeks time at most. I expect the market to get to about $3700 at least, before maybe coming down again in it's usual zig zag manner.

Daily chart analysis
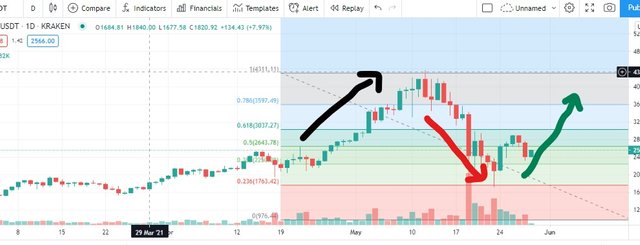
The daily chart looks more suitable, it gives a better understanding of the price action through the looks of each candlestick.
Now from the chart above, the trends are more visible. The elder uptrend that came first, then the just recent downtrend, and lastly the forming supposed uptrend.
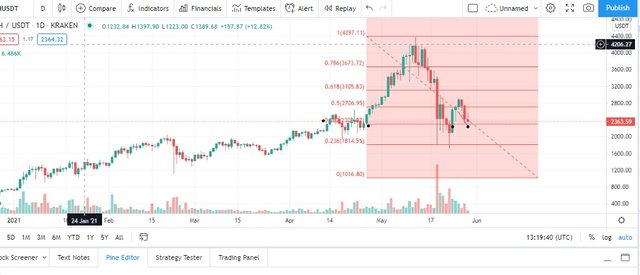
The chart above shows a support line i noticed. I noticed that whenever the market got to that price, it almost always bounced off it. In the chart above, i highlighted the times that the market got to that support line, with the help of the Fibonacci indicator. And as you can see, the price is around about that same line, indicating that there's likely to be a price jump.

I found a flag
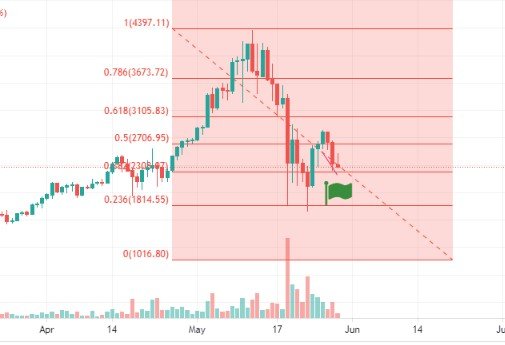
upon looking even more closely, i found a flag. A flag is an indicator that the market might make a run upwards. It usually consists of a long green candle, followed by slowly ascending small candles.
Also, the price was reversed and pushed back up too suddenly at a known support line, it all points to a bullish breakout.

4 hours chart analysis
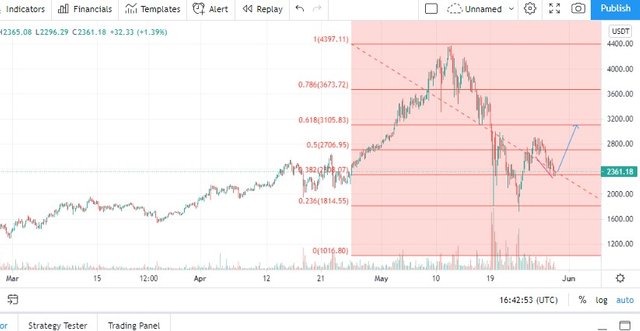
Using the fibonacci indicator on the 4 hours chart really summed up my conclusions. As seen above, the Fibonacci indicator made me spot that a new uptrend is brewing to a price of about $3000. The point at which the price was at the time, crossed with the diagonal line of the indicator, which also helps me believe that a bounce off of price is on the way.

The "W" pattern I found
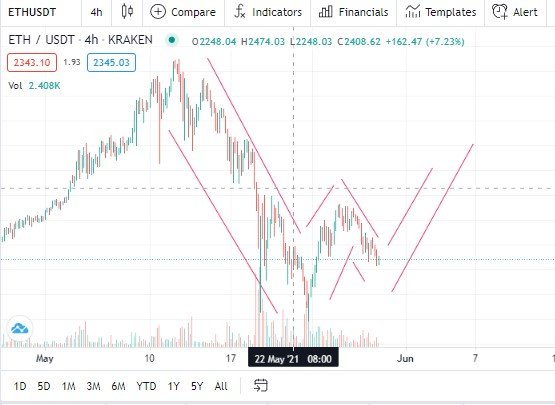
As seen above, the "W" pattern is brewing up too, drawing the W on the chart showed me that it is possible that the price could go lower, but it is also likely to go up to reach it's all-time high just as much!
As we all know, the market moves in a diagonal or horizontal Zig-zag, but it's always a Zig-zag, and from all i have analyzed from the other charts, the pair is on an uptrend in general, this means the price is probably going to bounce up sooner or later.

MyTrade management ( Setting stop loss, trailing stop and take profit)
How and where i set my stop loss:
(red line)
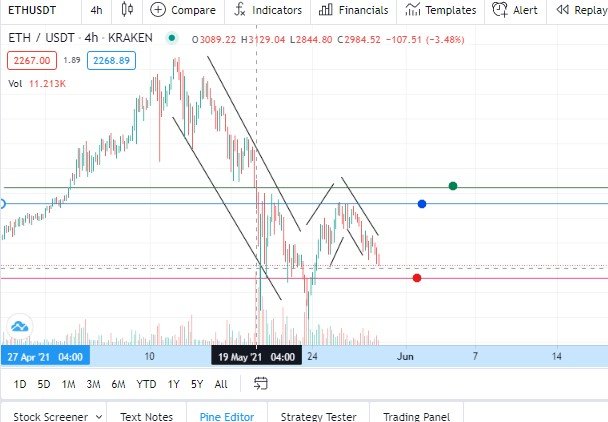
- using candlestick analysis, and a little trend prediction, the price should reverse to a buy at this point, and head up. this is a swing trade, and i am leaving it for about a week or two, so my stop loss is at $2048 just in incase the market wants to start a downtrend as no one can truly tell from the charts.
How and why I set my take profit:
The first take profit (green line) is at about $3000 this is a long shot, but as i have predicted, a strong bull is around the corner, so it could actually get there, it is feasible.
The second take profit (blue line) is at $2800 as this is close to a strong resistance point in the chart. It is also possible that price is seeking for former resistance.

Conclusion
swing trading is not really a popular type of trading, because people don't want to wait for the market to fall right with them, but I really do think that swing trading is less stressful if one gets the hang of it, and it could also be more financially advisable. Thank you @yohan2on for the lecture.
Hello @khamara,
Thank you for participating in the 7th Week Crypto Course in its second season and for your efforts to complete the suggested tasks, you deserve a 9/10 rating, according to the following scale:
My review :
Article with good content, I did well, as I tackled the topic clearly, especially trading in different periods of time and using several indicators for technical analysis. What is lacking is some depth in analyzing your decision to act in Swing trading.
Thanks again for your effort, and we look forward to reading your next work.
Sincerely,@kouba01
Thank you sir