Steemit Crypto Academy Season 4 Week 2 - Homework Task for @reminiscence01 | technical indicators
QUESTION 1a
In your own words, explain Technical Indicators and why it is a good technical analysis tool
.jpeg)
TECHNICAL INDICATORS
It's a general belief that history always tends to repeat itself and that's what technical indicators are based on.
A technical indicator is a mathematical calculation based on historic price, volume, or information that tends to predict the overall market direction.
This indicator makes use of graphical representation which moves in line with the current financial market. Analysts look back on the previous chart in other to determine the possible movement of the market using mathematical calculations. The graphical representation makes the mathematical calculations possible for technical analysts because what is mostly been taken note of is either the previous opening or closing price of a commodity or an asset.
It is best to use technical indicators alongside another technical analysis tool for a more accurate determination of price movement.
- WHY TECHNICAL INDICATOR IS A GOOD TECHNICAL ANALYSIS TOOL
In other to maximize profit and minimize loss, a trader should be able to know when to buy or sell an asset. Technical indicators aid traders to pinpoint the entry and exist a point of an asset by indicating previous market behavior of that asset which helps the trader to predict the possible price movement of the asset. Technical indicators do this by supplying information based on historic volume, price, and other data necessary for determining the potential direction of the market.
.jpeg)
In other, for an analyst to successfully determine the perfect entry or exit of a market, technical indicators are required because that's what they provide a trader with. It signals a trader when a market is about to go bearish or bullish and with the correct analysis, an analyst will be able to read these signals and take the necessary action.

QUESTION 1b
Are technical indicators good for cryptocurrency analysis? Explain your answer.
Yes, technical indicators are good for cryptocurrency analysis. The cryptocurrency market is volatile and that makes it risky in the sense that a trader without any proper indicator on when to enter or leave the market can easily lose his or her capital. The pattern of charts formed due to the graphical movement of the price tends to repeat itself over time and when this happens the price tends to go the same direction as it did previously. This is where technical indicators come in, as it supplies traders with historical data which helps in speculating the potential price movement of the market.

The fact that cryptocurrency is volatile makes technical indicator very useful is handling it and the reason being that technical indicator offers various indicators that are useful in speculating the possible movement of a volatile market. Examples of such indicators include Bollinger Bands, Average True Range (ATR), Cboe Volatility Index (VIX), etc.
Other indicators which aids in the successful reading of the cryptocurrency market chart includes momentum indicators and trend-base indicators. This two along side volatility indicator gives a more successful signal recognition, properly trade management, etc.
QUESTION 1c
Illustrate how to add indicators on the chart and also how to configure them. (Screenshot needed).
Step by step illustration on how to add indicators on the chart and how to configure them.
I will be showing this using the meta trader 5 platforms.
Below is a step by step procedure on how to add indicators on a BTC/USD pair on meta trader 5.
- 1
Open meta trader 5 application and on the first interphase, click on quotes.

- 2
After that, choose a pair you want to trade.
I will be going with BTCUSD pair as stated earlier.

- 3
When you click on the desired pair, several options will be displayed. Click on the chart.

- 4
When you click on the chart, it will open up the BTCUSD market chart as seen below.

Now let's proceed with adding a trading indicator
ADDING AN INDICATOR
- 1
To add an indicator, click on (f) just as seen below.

- 2
When the above is done, a series of indicator options will be displayed. Here I will be going with a moving average which is an indicator used for identifying trends.

- 3
After selecting moving average, different parameter options will be displayed which you can configure to your taste.
I will start by adjusting the color to blend well with the background of the chart. The chart has a black and white candles and white background, I will be changing the color of my moving average indicator to Purple in other for it to be visible.

4
After that, I will be changing the pixel from 1 to 4 in other for the line to be bolder.

- 5
I will now change the method to simple in other to avoid many complications.

6
After configuration, I will now click on done to save all settings.

- 7
After clicking on done, the moving average and other applied settings will be visible on the chart which you can now use to monitor and predict the possible trend movement of the market just as seen below.


QUESTION 2a
Explain the different categories of Technical indicators and give an example of each category. Also, show the indicators used as an example on your chart(Screenshot needed)
There are four different categories of technical indicators and they are:
- TREND INDICATORS
- MOMENTUM INDICATORS
- VOLUME INDICATORS
- VOLATILITY INDICATORS
TREND INDICATORS
Trend indicators are indicators that supply data based on price history which aids an analyst to predict the trend movement of the market. A trend can either be up, down or sideways. When a trend indicator identifies a potential uptrend, the analyst is advised to buy and when it signals a potential downtrend, he or she is expected to sell. In the matter of sideways trend, the analyst is expected not to take any actions but patiently monitor the market till either an uptrend or downtrend is indicated.
Examples of Trend based indicators
- (a) Moving Averages ( Simple/Exponential).
- (b) Average Directional Index ( ADX).
- (c) Ichimoku Kinko Hyo etc
- (d) envelopes
- (e) standard deviation
Diagram of a moving average...
MOMENTUM INDICATORS
Just as the name implies (momentum) which means force, depends on the weight of supply and demand.
This type of indicator signals an analyst on the possible movement of the market based on the weight of supply and demand. This indicator shows how strong a trend is and the possibility to continue in that direction. It also signals when an asset is overbought or oversold.
Examples of momentum based indicators
- (a) Relative Strength Index (RSI)
- (b) Stochastic
- (c) Moving Average Convergence Divergence (MACD)
- (d) Force index
- (e) Relative vigor index
Diagram of stochastic...

VOLUME INDICATORS
Volume indicators signal an analyst based on the balance between supply and demand. The percentage change in the share volume of an asset signals a force behind the trend. If the signal indicates a strong force behind an uptrend, then an analyst is expected to buy.
EXAPLES OF VOLUME INDICATORS
- (a) OBV indicator
- (b) Volume RSI
- (c) Volume price trend indicator
- (d) Money flow index
Diagram of on balance volume (OBV)...

VOLATALITY INDICATORS
Volatility indicator is a type of indication tool which helps to determine the rate or degree to which the market price changes. This type of indicator is mostly used by scalpers who trade by taking advantage of the volatility of the market. They mostly reduce the time of the chart to around 15 minutes to 1 hr in other to be more efficient in scalping.
EXAMPLES OF VOLATILITY INDICATOR
- (a) Average True Range (ATR)
- (b) CVI (Cboe Volatility Index)
- (c) Bollinger Bands
- (d) Keltner channel
- (e) Donchian channel
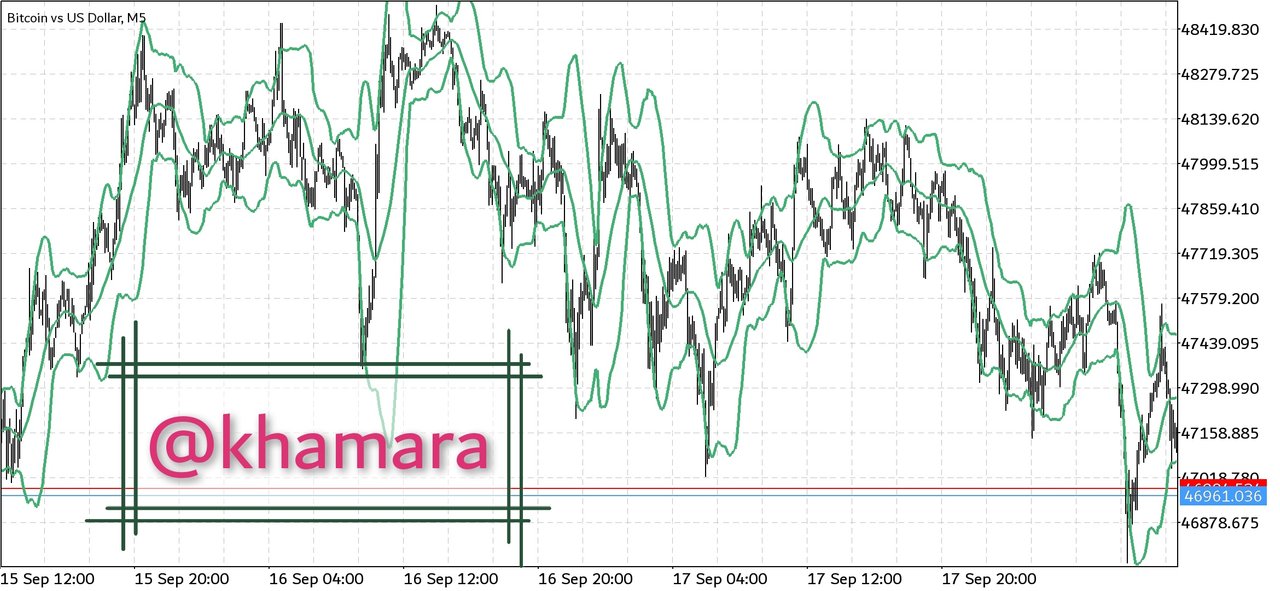
Diagram of Bollinger Bands....
QUESTION 2b
Briefly explain the reason why indicators are not advisable to be used as a standalone tool for technical analysis
There's a quote that says "Unity is strength" especially when each has its own unique ability. In technical analysis, each indication tool has its own unique purpose and ability just have we have already seen from question number 2a. For instance, a momentum indicator such as Stochastic can supply historical data based on the weight of supply and demand but won't signal a trader on the level of market volatility which in turn leaves the trader handicapped with a higher risk of making losses due to the volatility of the market and other factors which could have been tackled by other indicators.
QUESTION 2c
Explain how an investor can increase the success rate of a technical indicator signal
An investor can increase the success rate of a technical indicator by making use of different technical analysis tool and not just depending on one.
The diagram below shows the combination of stoch, obv, moving average....

The price movement of the market is dependent on different factors happening at the same time and these factors includes; volatility, rate of demand and supply, etc.
In other for an investor to be more successful, he or she is expected to apply different indicators that are capable of signaling the above changes.
CONCLUSION
Technical indicators are very important tools that make use of historic data in predicting the possible direction of the market. It uses different analytical tools such as momentum, volatility, trend, and volume in analyzing the general market movement.
As the general market movement doesn't just depend on one factor, these analytical tools are best used concurrently in other to increase the success rate of the analyst.
Special regards to @reminiscence01 for this wonderful course.