Steemit Crypto Academy Season 4 | Intermediate course by @allbert –week 5: Trading with Accumulation / Distribution (A/D) Indicator.
Good day steemians! How're you all doing? I want to thank Prof. @allbert for the last lecture he gave to us. Below is the solution to the assignment he gave to us.

1. Explain in your own words what the A/D Indicator is and how and why it relates to volume. (Screenshots needed)

A/D indicators is gotten from two words and these words are:
• A which means Accumulation
• D which means Distribution
Now before I explain what A/D indicators are, I'll like to explain what each of these words mean.
Accumulation
This simply means the process whereby investors hold their coins or assets for a period of time so as to allow it appreciate in market price (increase in price) before they decide to eventually sell it at the right time to make profit.
Distribution
This simply means the process whereby an individual decides to sell of or release his assets and this in turn causes a decrease in market value of that particular coin.
• What are A/D indicators?
Now, after fully explaining these two words, I can now proceed towards explaining what A/D indicators are. A/D indicators are technical tools or indicators which helps an investor to determine the current phase at which a market is with relations to accumulation and distribution. This in turn give investors the right signals because with these indicators they can be able to tell if the market is in accumulation or distribution phase so as to know what step the Investor takes next.
• How and Why it relates to volume?
The A/D indicator relates to volume because it is a form of indicator which is used to ascertain the value of an asset by relating its price with the volume flow of the asset in the market. Since A stands for "Accumulation" and D stands for "Distribution" these terms relate with the demand and supply law and this in turn can determine the volume of an asset in a market.
In this way, it relates to the volume of an asset.
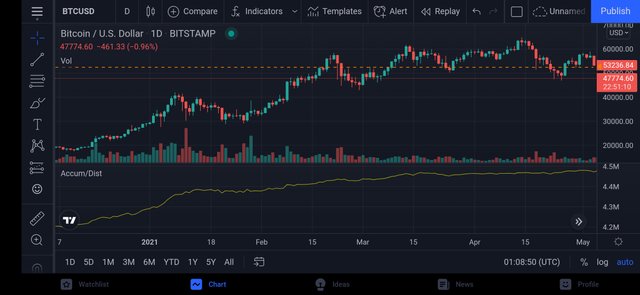
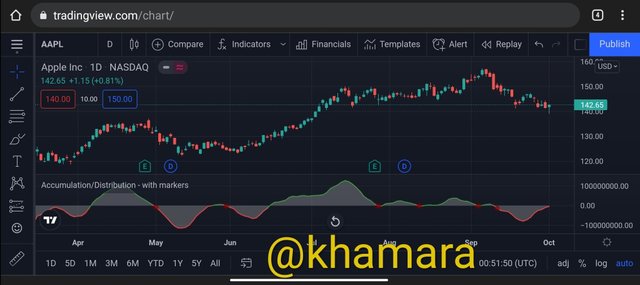
Here's a screenshot of an A/D indicator below. They are those lines found beneath the price of the asset or coin and its direction changes up or down depending on the scale located at a panel.

2. Through some platforms, show the process of how to place the A/D Indicator (Screenshots needed)

Since the A/D indicator is very important as it shows the phase at which a market is currently, it is important an investor knows how to use it. Below, I'll be showing you the process of how to place an A/D indicator in order to make your analysis.
Market trends are very important because if they are rightly predicted an investor tends to make massive profits that is why the A/D indicators are important because they help in determining the market trends. The steps towards using an A/D indicator. Use any trading app, here I'll be using Tradingview
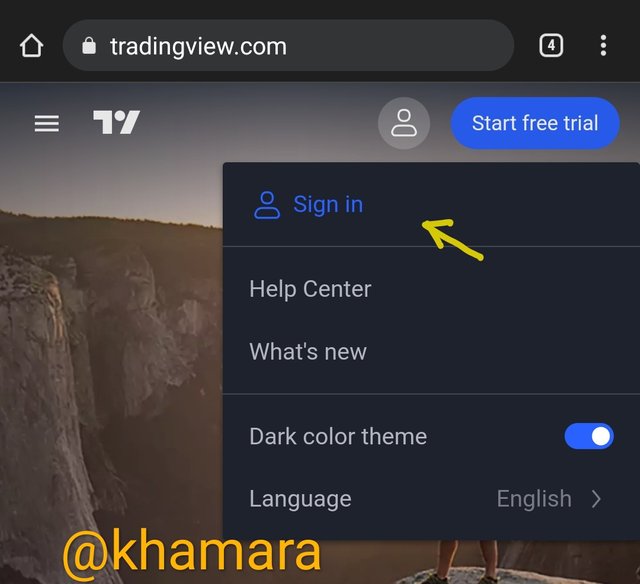
• Login to your trading view account
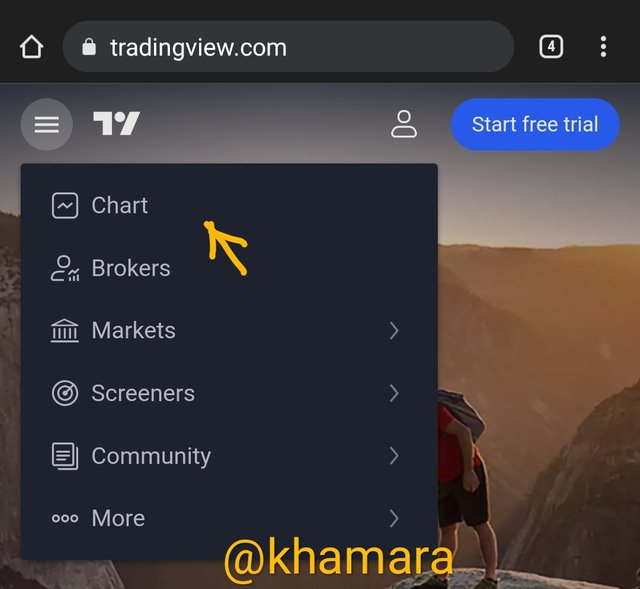
• Click on the chart of the coin or asset you wish to view
• After that, click on Indicator(FX)
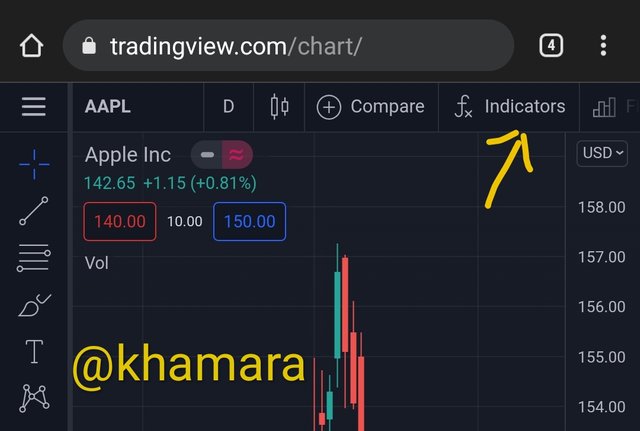
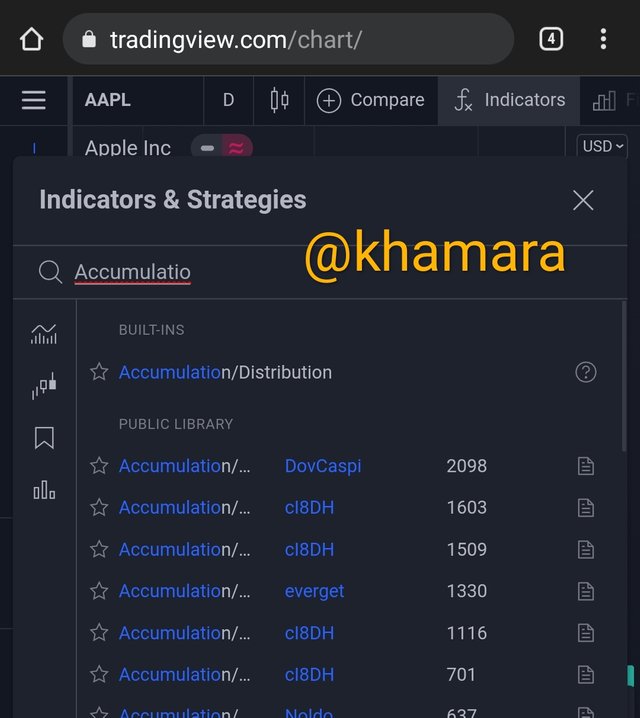
• Search for accumulation/distribution indicator and click on the first one that shows.
• This is what it looks like

3. Explain through an example the formula of the A/D Indicator. (Originality will be taken into account)

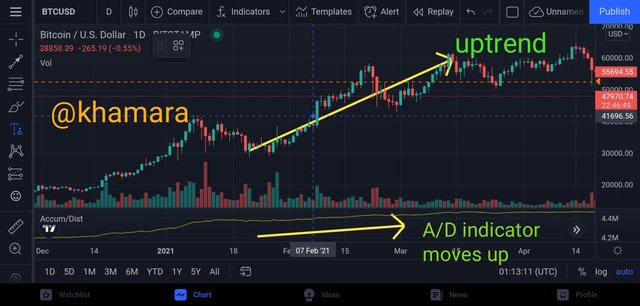
The formula of the A/D indicator can be gotten by determining the current market trend. The A/D indicator is directly related to the value of an asset or a coin. This means that whatever trend a market experiences, an A/D indicator will also experience the same. If the market is an uptrend, the A/D indicator moves up also and vice versa.
I'll be explaining this using an example, I'll use this screenshot of a chart below.


4. How is it possible to detect and confirm a trend through the A/D indicator? (Screenshots needed)

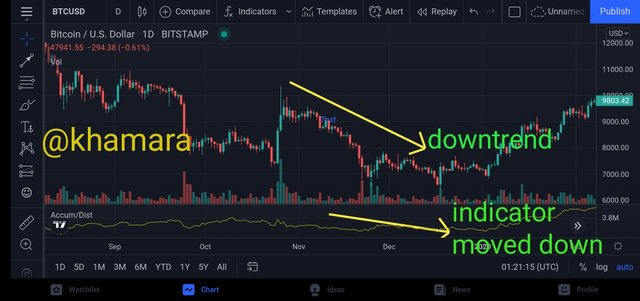
A trend is detected in a market through an A/D indicator by observing the movement of the indicator. If the indicator is moving upwards then it means the market trend is in a bullish cycle and at that moment, accumulation is usually practiced by investors. If the A/D indicator moves donwnwards, then it means the market is at a bearish cycle and most times it's caused by distribution of assets by investors.
This is how a market trend can be predicted with the use of A/D indicator. Also, another means of confirming a market trend is by relating the formula of the A/D indicator with the market. Since the A/D indicator is directly related to the price of the asset and the volume, then movement that happens to the indicator definitely will have effect on the price of the asset too.
Below is a screenshot to prove this.

5. Through a DEMO account, perform one trading operation (BUY or SELL) using the A/D Indicator only. (Screenshots needed)

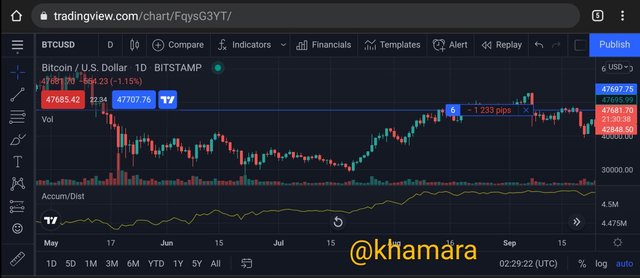
The transaction below was carried out based on the current market trend at that moment.

6. What other indicator can be used in conjunction with the A/D Indicator. Justify, explain and test. (Screenshots needed)

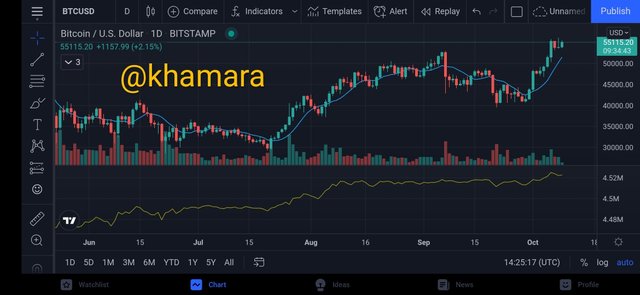
Asides the A/D indicator, another indicator can be used in the same way as A/D indicator and this also has the same analysis and same process as the A/D indicator. You can use the Moving Average Indicator.
In conclusion, the use of A/S indicator is very important although it might require some other Technical tool but it is a very good tool and every investor must learn how to use it. Thank you Prof. @allbert.