Crypto Academy / Season 3 / Week 8 - Intermediate: Crypto Assets and the Random Index (KDJ)| Homework Post for @asaj
.png)

INTRODUCTION
This week's lecture by Professor @asaj was very interesting to read and one I'm particularly grateful for. I've always seen the KDJ indicator on the Binance exchange, but never quite knew what it was used for or how it worked. Fortunately for me, with this lecture by Professor @asaj, i now know what it is and how it works, and i will be trying to explain that in my own words and to the best of my understanding in this homework assignment. Here are the questions:
Questions
1. In your own words define the random index and explain how it is calculated
2. Is the random index reliable? Explain
3. How is the random index added to a chart and what are the recommended parameters? (Screenshot required)
4. Differences between KDJ, ADX, and ATR
5. Use the signals of the random index to buy and sell any two cryptocurrencies. (Screenshot required)
And now let me answer them...
1. In your own words define the random index and explain how it is calculated
The Random Index indicator is an oscillating indicator. It finds its roots in the stochastic oscillator and is very similar to it, except for the addition of an additional but very important curve.
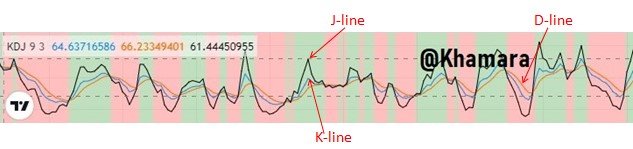
The Random Index Indicator is also known as the KDJ indicator. This is because it is made up of three lines. The K, D, and J lines. The K and D lines are similar to the lines of the Stochastic oscillator, so what really makes the KDJ indicator unique is the addition of the third line: the J-line, which outlines the divergence of the K-line from the D-line.
The KDJ indicator is a fairly new indicator that originated from the futures market. It is one of the most commonly used technical analysis indicators in the stock market and the futures market, but can also apply to any financial market, including the crypto market. It is used majorly in trending markets, as it is known to give false signals in ranging markets.
How it Works
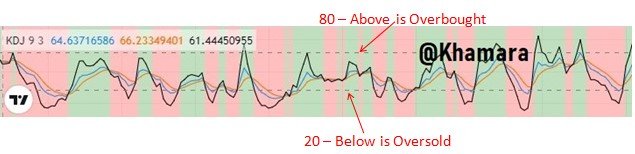
As an oscillator indicator, the random index tells us when a market is overbought or oversold. This is indicated when the lines go outside of the normal range of between figures of 20 to 80 (below 20 for oversold and above 80 for overbought.) However, the random index has one more trick up its sleeve that really makes it stand out.
Like the MACD, the KDJ indicator can also highlight the current trend in the market. In an uptrending market, the J-line is usually seen above the K & D-lines, and in a downtrending market, it is usually found below. Many traders take the crossing over of the J-line to the top as a buy signal, and the crossing to the bottom as a sell signal.
How it is calculated
The KDJ indicator studies and highlights the relationship between the high, the low, and the close, as well as integrate some parts of momentum concept, strength index, and moving average.
The calculation of the random index indicator is somewhat complicated, but I will try to simplify it in this assignment.
- Firstly, we have to determine the period (n) with which we are calculating.
- Then we have to calculate the immature random index value for that period (n), which is denoted as RSV(n)
RSV(n) = (Cn x Ln) / (Hn x Ln) x 100
Where:
Cn = Closing price of the current period
Ln = Lowest price in n days
Hn = Highest price in n days - Then we calculate for the K value
K = [(2/3) x K of previous n] + [(1/3) x RSV of the current period]
(If there is no K value for the previous n, it can be replaced with 50) - Then we calculate for the D value
D = [(2/3) x D of previous n] + [(1/3) x K of the current period]
(If there is no D value for the previous n, it can be replaced with 50) - After calculating for K and D, we can then use it to find J
J = (3 x K) - (2 X D)
Let's do an example problem.
Find the K, D & J values for a period of 14 days, where the Closing price on the 14th day is 26, the lowest price in the past 14 days is 22, and the highest price in the past 14 days is 28.
Parameters given:
- Cn = 26
- Ln = 22
- Hn = 28
Calculation
- RSV(n) = (Cn x Ln) / (Hn x Ln) x 100
RSV(14) = (26 x 22) / (28 x 22) x 100
RSV (14) = 92.86
Since we weren't given the K and D values of the previous day, we will substitute each of them with 50.
K = [(2/3) x K of previous n] + [(1/3) x RSV of the current period]
K = [(2/3) x 50] + [(1/3) x 92.86]
K = 64.29D = [(2/3) x D of previous n] + [(1/3) x K of the current period]
D = [(2/3) x 50] + [(1/3) x 64.29]
D =54.76J = (3 x K) - (2 X D)
J = (3 x 64.29) - (2 X 54.76)
J = 83.35
Assuming we were given the values of the K and D of the previous day to be 62 and 45 respectively:
K = [(2/3) x K of previous n] + [(1/3) x RSV of the current period]
K = [(2/3) x 62] + [(1/3) x 92.86]
K = 72.29D = [(2/3) x D of previous n] + [(1/3) x K of the current period]
D = [(2/3) x 45] + [(1/3) x 72.29]
D =54.10J = (3 x K) - (2 X D)
J = (3 x 72.29) - (2 X 54.10)
J = 108.67
That is how the K,D & J values are calculated. These are then plotted on a line graph as the indicator.
2. Is the random index reliable? Explain
As we all know (and we should always remind ourselves), no indicator is a 100% accurate. Every indicator's signals will always need confirmation from another indicator or pattern, to reduce risk of failure and increase one's chances of making a successful trade.
I would, however, say that the Random Index is relatively reliable. It is, after all, one of the most widely used indicators in the stock, forex and cryptocurrency market. But firstly, we must understand that this indicator is much less effective and efficient in ranging and flat markets, and generates a lot more false signals in such market conditions. In trending markets however, the Random index is much more reliable and generates more valid signals.
Of course, no matter how reliable the random index may seem, we always have to combine it with other indicators, and/or pattern formations, in order to generate signals with higher probability of producing profitable trades. Some indicators which work well with the KDJ indicator are the ATR (Average True Range) Indicator, Moving Averages (MA, EMA, MACD), and even the ADX Indicator as well.
One can also combine technical analysis using the KDJ indicator with fundamental analysis, in order not to get taken out of the market by spikes or random movements that happen because of news and hype.
3. How is the random index added to a chart and what are the recommended parameters? (Screenshot required)
In order to add the Random index to a chart, one would have to go to their charting software and follow through with the way it is done there. I will show two ways to do it through Binance and through TradingView
On Binance
- Visit Binance and Log in, after which you will be taken to the homepage.
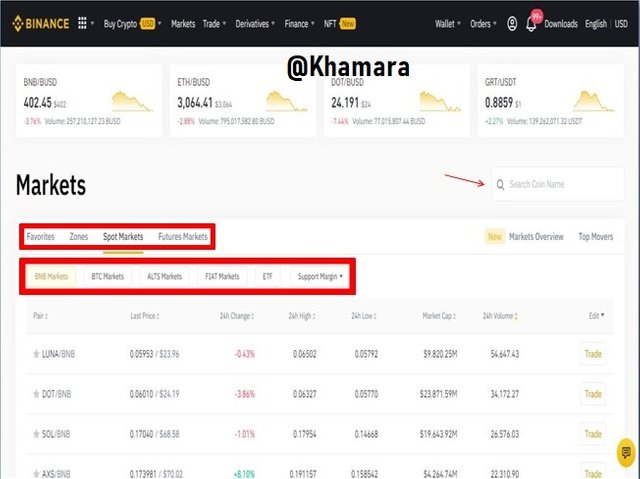
- On the homepage, click on "Markets" at the top left of the page.
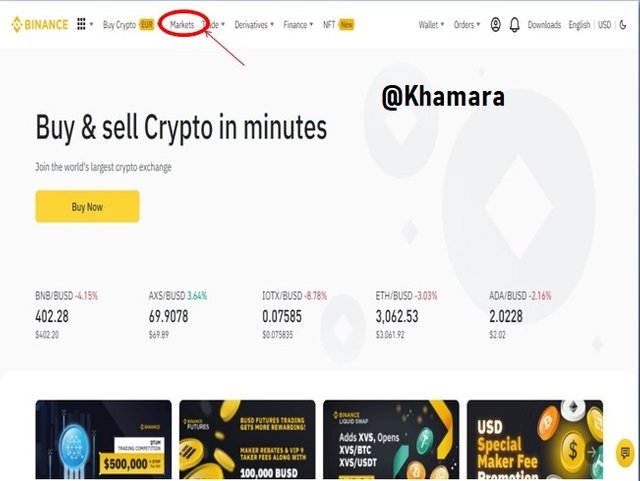
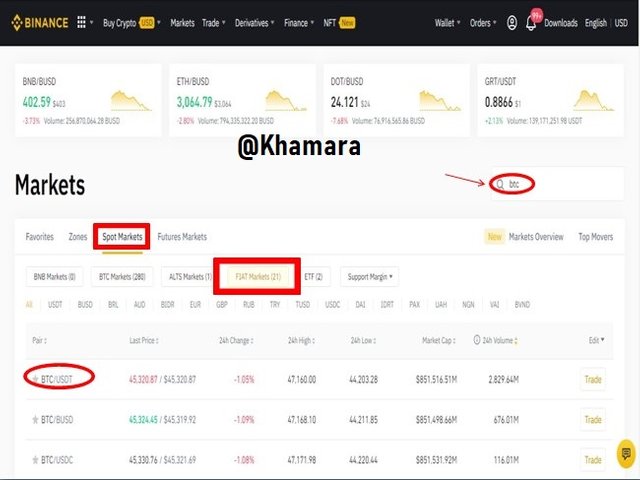
- In the "Markets" page, you can then select which market you want, between the Spot and Futures markets, as well as the type of market ( maybe a BNB pair, or a Fiat pair, or a BTC pair) and then you can search.
- When you have made your selection, and searched for the pair you want, you can then click on it to be taken to the chart.
- On the Chart page, you click on the indicator tab above the chart.
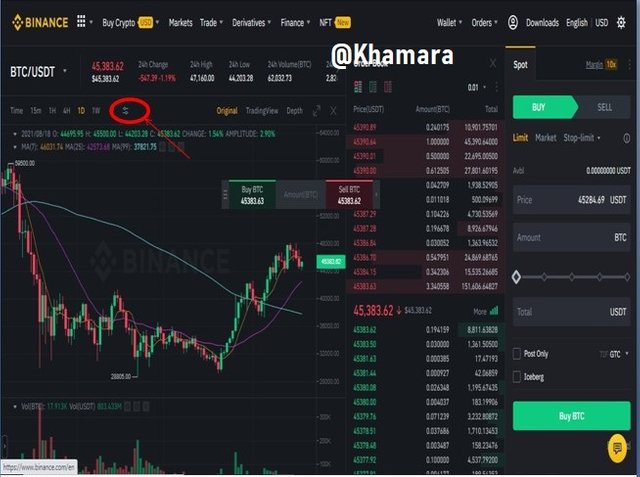
- This pulls up the Indicator tab
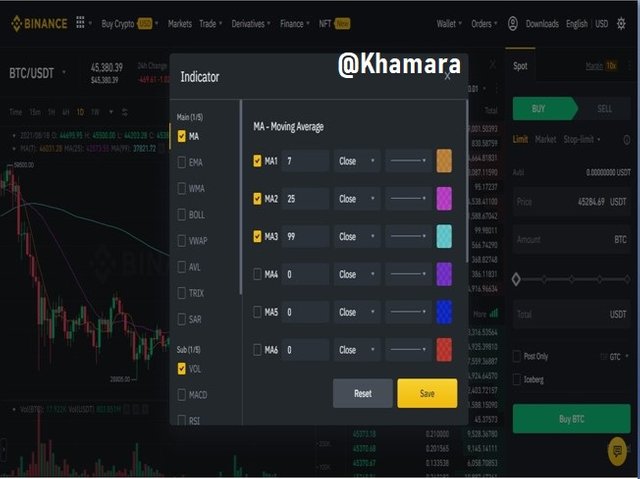
- In the Indicator tab, you scroll down to find the KDJ indicator and click on it.
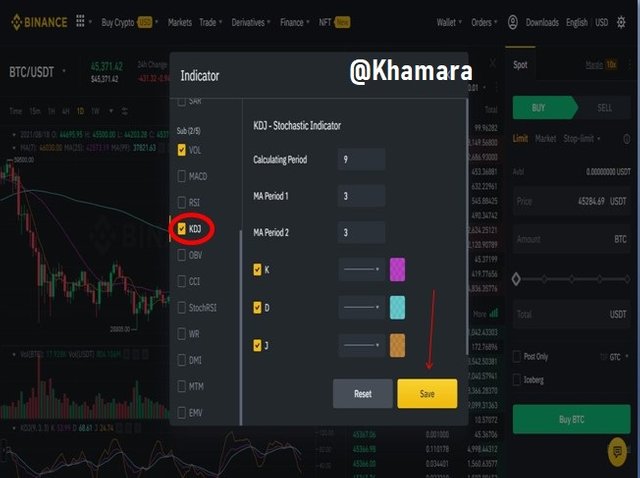
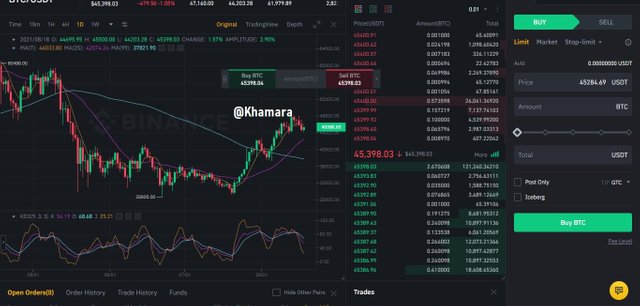
- After, clicking on "Save" this adds the indicator to the bottom of the chart.
On TradingView
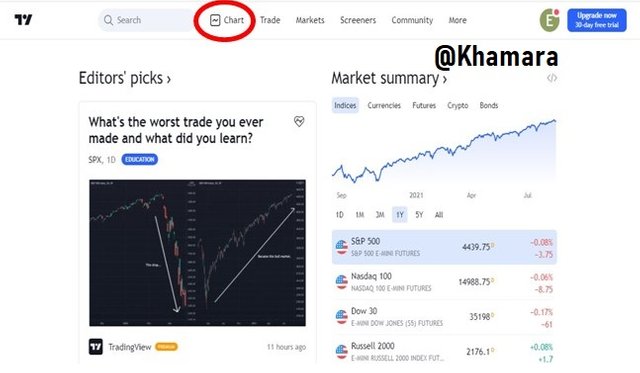
- Visit TradingView
- From the landing page, towards the top left corner, you click the Chart link and it would take you to the charting interface.
- Towards the top left corner again, you will see a symbol like this:

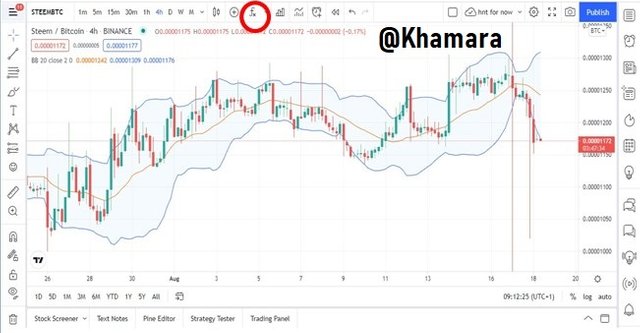
- That symbol represents the technical indicators and clicking on it displays a pop-up window titled “Indicators & Strategies”.
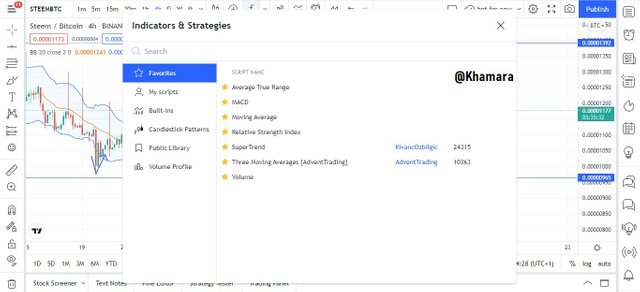
- In the Indicators & Strategies tab, we can then search for the KDJ Indicator and click on the KDJ by ll21LAMBOS21
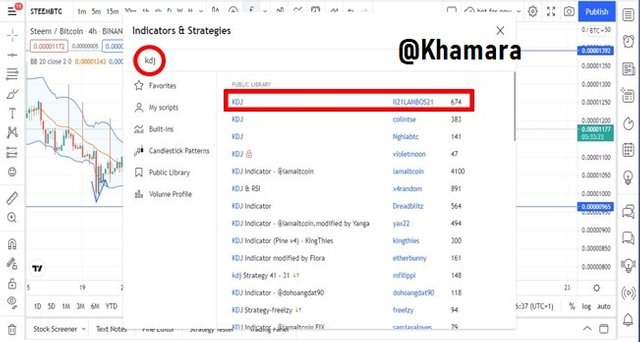
- By clicking on it, we add the KDJ indicator to the bottom of the chart.
The Recommended Parameters for the KDJ indicator
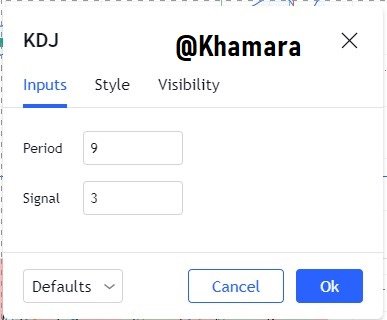
- The default parameters for the KDJ indicator are Period = 9 and Signal = 3, which means that the K-line is set at a period of 9 and the D and J-lines at 3.
Also the "normal" range is between 20 - 80, with below 20 being Oversold and above 20 being Overbought.
These are excellent parameters for short to medium-term trading because the shorter, or smaller, the parameters of the indicator, the more the line graph fluctuates. Some traders also use 6, 3, 3 for short-term trading, because it makes the indicator a bit more sensitive to price movements.
However, lets not forget that one man's food is another man's poison. What may seem to be the best parameter for one trader, may not fit into another's trading style. As such, every trader should always check to see what works for them.
4. Differences between KDJ, ADX, and ATR
I have already spoken a lot about the KDJ indicator in the paragraphs above, so i will first talk about the ADX and ATR, before i talk about the differences between the three of them
The ADX Indicator
The ADX indicator is a wonderful technical analysis tool used in the determination of trend strength, and optionally trend direction. It is made up of three lines, namely: The ADX line, which tells the strength of the trend and the DI- and D+ lines which indicate the direction of the trend. It has 4 ranges; 0 - 25, 25-50, 50-75, 75-100. The higher the value of the ADX line, the stronger the trend in the market, with 0 - 25 indicating a ranging/non-trending market and 75 - 100, indicating an extremely strongly-trending market.


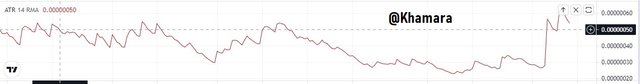
The ATR Indicator
The ATR Indicator is a technical analysis tool used to measure the level of volatility in the market over a given period of time. It is mostly used by traders to plan trades, for where to set stop losses, and take profits. It is calculated by considering the gaps between price within a given period of time, and is represented by a single line on a graph. High ATR values indicate high volatility, and low values, low volatility.
Here are the key differences between the three indicators:
| KDJ Indicator | ADX Indicator | ATR Indicator |
|---|---|---|
| Consists of 3 lines; K, D and J | Consists of 1 major line (ADX line), and two optional lines (DI+ and DI-) | Consists of 1 line |
| For identification of overbought and oversold zones | For determination of trend strength | For determination of asset volatility over a given period of time |
5. Use the signals of the random index to buy and sell any two cryptocurrencies. (Screenshot required)
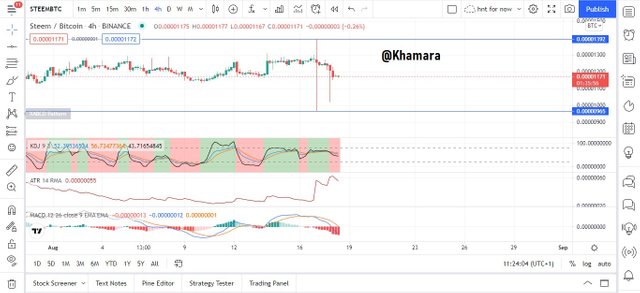
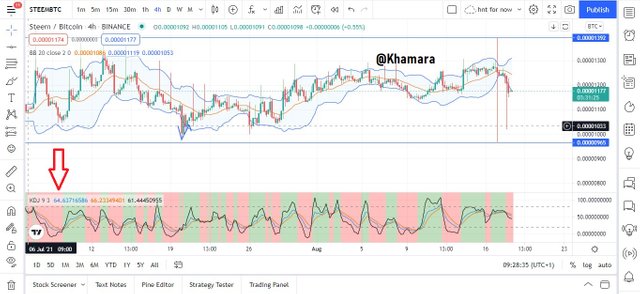
The KDJ indicator generates signals using its overbought and oversold ranges, as well as crossing of the J line over the K and D lines. I'll be applying this in entering into trades in 2 cryptocurrency markets.
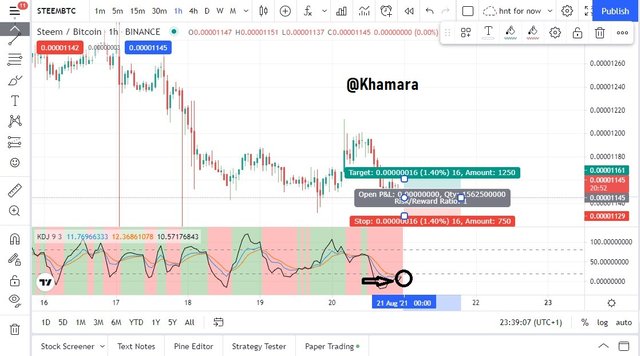
We can see in the STEEM/BTC chart above, that the K, D and J lines have entered into the oversold region. That on its own is an indication that we should be expecting buy pressure soon enough. As we can also see, the J line is gearing to cross over the K and D lines. So i place a trade here with a stop loss below the nearest support, and the take profit a little below the nearest resistance, with an R:R of 1.
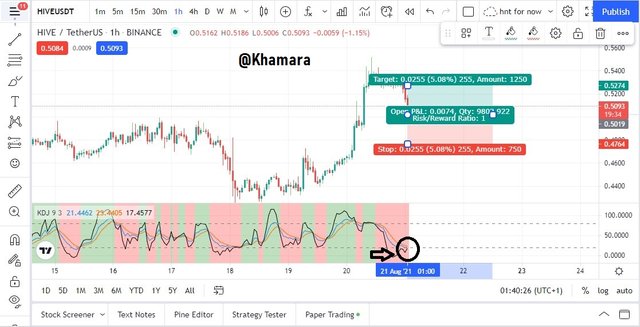
In the above HIVE/USDT 1h chart, we can see almost the same scenario about to play out. As we observe we see that the price is currently at a support level, and the J line is in the oversold region and moving up to cross the K and D lines. So i decide to place a trade here, hoping the support holds and the cross occurs, and the K line moves out of the oversold region.
CONCLUSION
The KDJ indicator/ Random index indicator is one of the most useful, and therefore most used indicators in trading, and it is one indicator that really helps one to understand price movements in the market. We can generate viable signals using this indicator. Thanks to Professor @asaj once again.
Note: All pictures not referenced, were taken by me from the respective websites or designed by me using Canva.
Superb performance @khamara!
Thanks for performing the above task in the eighth week of Steemit Crypto Academy Season 3. The time and effort put into this work is appreciated. Hence, you have scored 8 out of 10. Here are the details:
Remarks
Overall, you have displayed a good understanding of the topic. You have performed the assigned task excellently. However, you did not provide screenshots of your demo account summary in task 5.
That said, this is good work. Thanks again for your contributing your time and effort to the academy.