Crypto Academy / Season 3 / Week 8 - Homework Post for [@cryptokraze]. Trading Sharkfin Pattern
.png)

INTRODUCTION
This final lecture for the season by Professor @cryptokraze has been educative, informative and profitable. We have been taught about the Sharkfin Pattern and its combo strategy with the RSI. Here are the questions for the homework task
Homework Task
1 – What is your understanding of Sharkfin Patterns. Give Examples (Clear Charts Needed)
2 – Implement RSI indicator to spot sharkfin patterns. (Clear Charts Needed)
3 – Write the trade entry and exit criteria to trade sharkfin pattern. (Clear Charts Needed)
4 – Place at least 2 trades based on sharkfin pattern strategy. (Need to actually place trades along with Clear Charts)
And here are my answers.
1 – What is your understanding of Sharkfin Patterns. Give Examples (Clear Charts Needed)
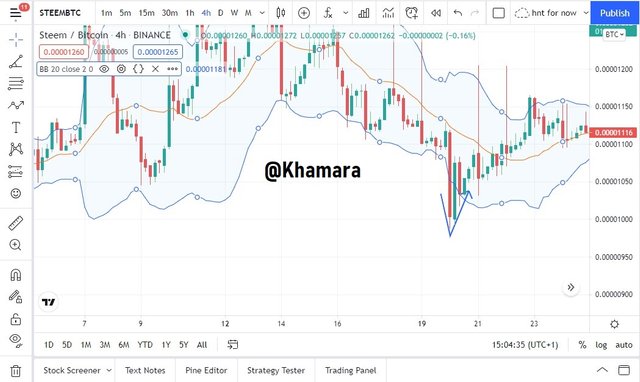
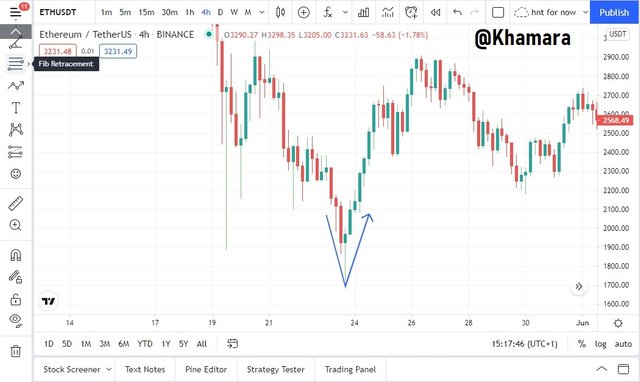
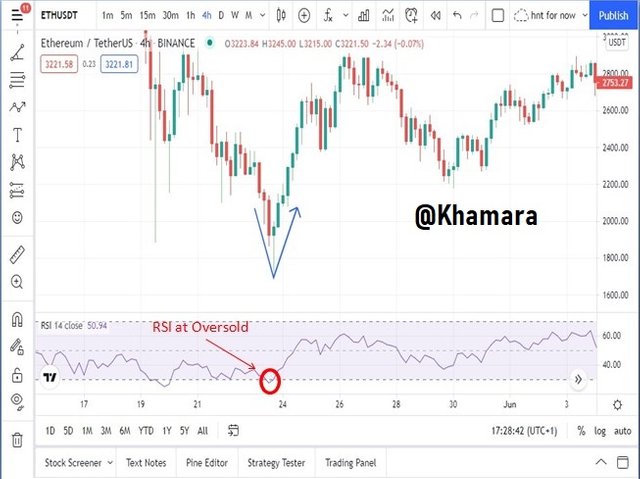
In highly volatile markets like majority of the cryptocurrency markets, one can see a good number of trends play out and reverse within even the shorter time frames. These trends sometimes can reverse very quickly, and if one is not vigilant enough, or doesn’t have the right knowledge, information or skill, they would miss these reversals, which are potential avenues to make a good profit.
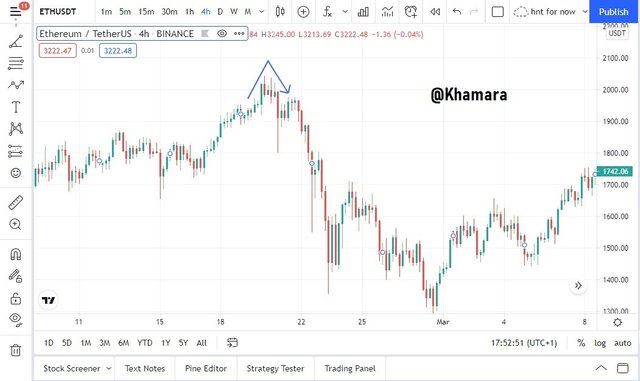
The Sharkfin Pattern and Trading Strategy is one of the ways one can take advantage of volatile market reversals. It is usually seen as a V shape on the chart at the bottom of a downtrend or an inverted V at the top of an uptrend. The Sharkfin Pattern is mostly seen in periods of high volatility and if entered into correctly, can be used to take advantage of an otherwise-untradeable market.
2 – Implement RSI indicator to spot sharkfin patterns. (Clear Charts Needed)
In taking advantage of market reversals using the sharkfin pattern price action trading strategy, one cannot only rely on the pattern because, no trading strategy or pattern is 100% accurate. This means that one should always confirm signals from patterns, or indicators, with other patterns or indicators, in order to reduce risk of entering into a losing trade.
One of the more reliable indicators to confirm the sharkfin pattern with is the Relative Strength Index or RSI. This is an oscillator which is widely used by many traders over different financial markets to ascertain whether an asset is oversold or overbought.
An asset being oversold indicates that it is trading at lower than its intrinsic value and will soon experience a reversal to the upside. Being overbought is the inverse, whereby an asset is trading at higher than its intrinsic value and will most likely experience a reversal to the downside.
The RSI indicator at default settings, indicates that an asset is oversold when the line moves below the 30 mark. It also indicates an overbought situation at the 70 mark.
We can combine this with the sharkfin pattern in order to confirm the validity of the pattern and the viability of the signal.
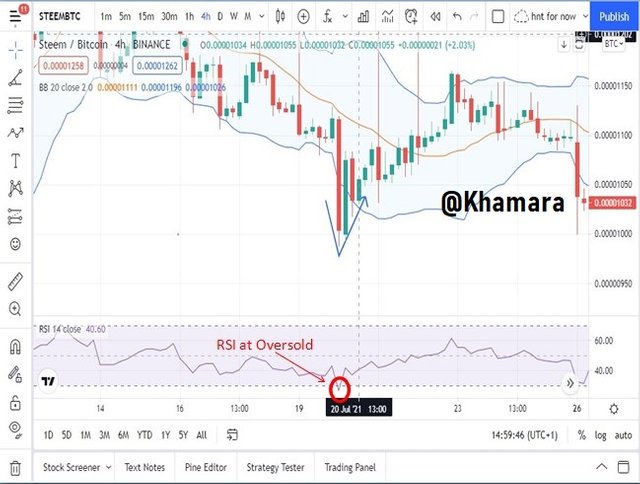
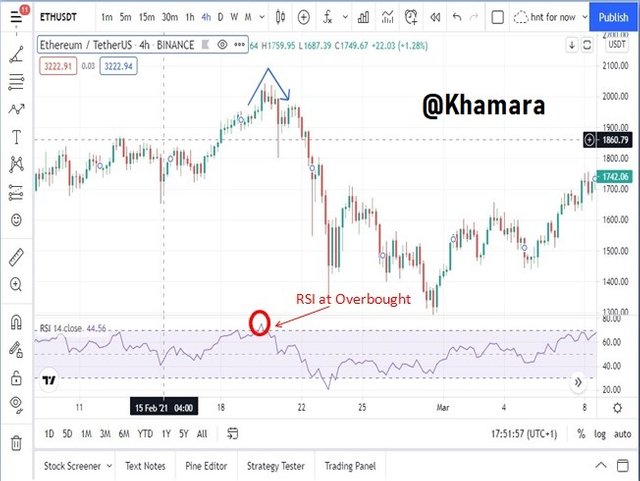
How this works is: When a sharkfin pattern is spotted, one should check the RSI to confirm if the asset is also trading outside the normal range for the RSI. If it is then one should employ the rules in the next section to enter the trade as well as to set Take Profit levels. If the asset is not outside the normal range for the RSI, then it is advised for the trader to discard the trade idea and look for more probable trades.
3 – Write the trade entry and exit criteria to trade sharkfin pattern. (Clear Charts Needed)
In trading, one must employ strategies and well planned out methods, otherwise it is is mere gambling. In the implementation of these strategies, one must also employ rules and good risk management in order to maximize profits and minimize losses. This is one of the things that really differentiates profitable traders from non-profitable ones.
Likewise, in the implementation of the sharkfin pattern trading strategy, one must also employ some rules in both entering a trade and exiting it according to the strategy. Some particular criteria must be met in order to validate the trade idea.
Rules for Trading with the Sharkfin Pattern Trading Strategy
Guidelines for Entering Buy Position
- On the chart being viewed, add an RSI indicator
- Ensure that your RSI indicator is configured with the default settings (Indicator Timeframe: Same as chart, Length: 14, Source: close; With the upper and lower bands at 70 and 30 respectively)
- When you identify a quick movement of the price downwards that reverses, giving the characteristic V shape, check for if the RSI indicator has gone below the 30 mark.
- Watch the RSI indicator for a clear move back into the 30 - 70 range (I recommend letting it get to 34 - 35.)
- When the RSI indicator line is clearly back in normal range, place your market buy order.
Guidelines for Entering Sell Position
- On the chart being viewed, add an RSI indicator
- Ensure that your RSI indicator is configured with the default settings (Indicator Timeframe: Same as chart, Length: 14, Source: close; With the upper and lower bands at 70 and 30 respectively)
- When you identify a quick movement of the price upwards that reverses, giving the characteristic inverted V shape, check for if the RSI indicator has gone above the 70 mark.
- Watch the RSI indicator for a clear move back into the 30 - 70 range (I recommend letting it get to 66 - 65.)
- When the RSI indicator line is clearly back in normal range, place your market sell order.
Guidelines for Exiting Buy Position
We can exit this position at either of two points. Either at a loss or in profit. In order to minimize loss and secure profit, we have to set stop loss and take profit limit orders.
Exiting with Stop loss
- Identify the swing low point of the sharkfin pattern.
- Place the stop loss order at a little below the swing low point. It should not be placed directly at the swing low, because there is a chance of price revisiting the level it bounced from to retest support.
- Stop loss orders should not be changed, as price hitting them indicates that the trade idea has been invalidated.
Exiting with Take Profit or Booking Profit
- Using the Stop loss order and the Risk Reward tool, determine a take profit level with a 1:1 Risk:Reward ratio.
- Place Take profit at that level or Book profits.
Guidelines for Exiting Sell Position
Exiting with Stop loss
- Identify the swing high point of the sharkfin pattern.
- Place the stop loss order at a little above the swing high point. It should not be placed directly at the swing high, because there is a chance of price revisiting the level it bounced from to retest resistance.
- Stop loss orders should not be changed, as price hitting them indicates that the trade idea has been invalidated.
Exiting with Take Profit or Booking Profit
- Using the Stop loss order and the Risk Reward tool, determine a take profit level with a 1:1 Risk:Reward ratio.
- Place Take profit at that level or Book profits.
4 – Place at least 2 trades based on sharkfin pattern strategy. (Need to actually place trades along with Clear Charts)
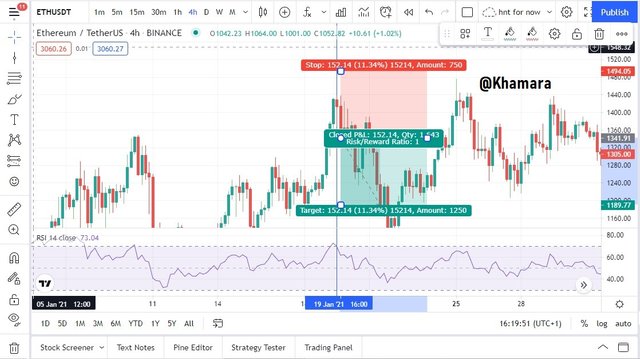
I will now be showing trades taken using the sharkfin trading pattern.
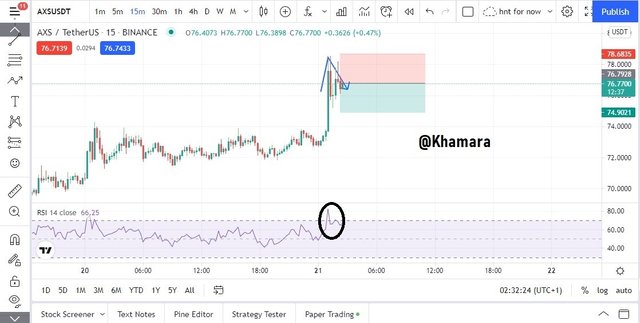
We can see the characteristic sharkfin spike in the above chart of AXS/USDT, as well as the RSI spike above the overbought region and return to the normal range. I place a trade there with my stop loss above the swing high and my take profit at a risk/reward ratio of 1.
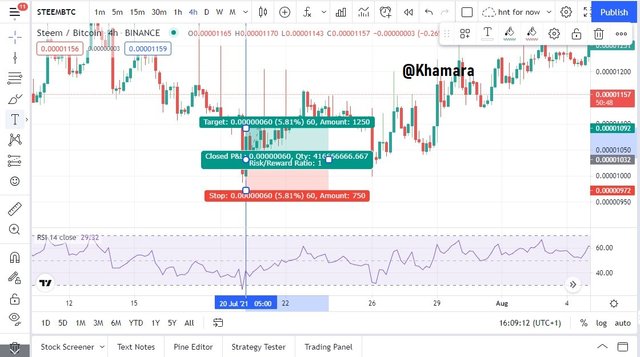
Here's another trade example of a trade taken in HIVE/USDT.
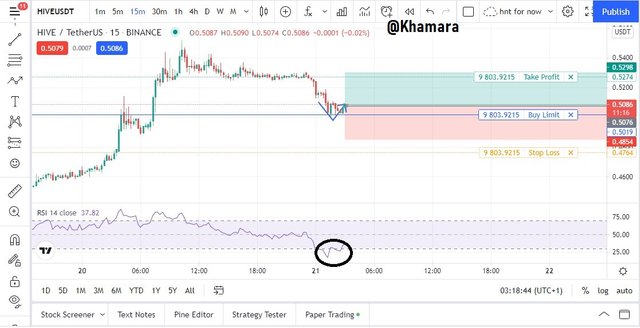
As we can see again, the Sharkfin pattern has occurred and the RSI has entered into the normal range again.
CONCLUSION
The Sharkfin Pattern is a quick and highly profitable pattern and when combined with the RSI forms a formidable strategy for making profits in the market. Of course, it is not 100% accurate, no pattern, strategy or indicator is, however, if used wisely can be more profitable than not. Thanks again to Professor @cryptokraze for this lecture.