Steemit Crypto Academy Season 3-Week 5 | Homework Post For @kouba01 - Ichimoku-kinko-hyo
This is a great lecture which has been rendered and I will fully love to participate and share my understanding and knowledge of this lecture
I am @kelechisamuel you can find my homework post below
Discuss your understanding of Kumo, as well as its two lines. (Screenshot required)
The kumo cloud, which is an essential part of the ichimoku kinko hyo was originated from japan. The Ichimoku Kinko Hyo is technical indicator that most traders uses to analyse the market for proper trading. it is a leading indicator, which means it happens before the price action occurs. the Ichimoku Kinko Hyo is the used to determine the price momentum in the market and as the same serves a support and resistance in the market. it is also used to determine the direction the price, that is uptrend, downtrend and a consolidating market. it is made up of the Teken-sen, kijun-sen, chikou-span, senkou span A and Senkou span B. But today, we will be looking at Kumo Cloud. The Kumo Cloud is a region in the ichimoku Kinko Hyo border by 2 lines Senkou Span A and Senkou Span B. kumo which is what determine the trend in the market and if that is a support or resistance zone is also a leading indicator with 26 period ahead of the current price action.
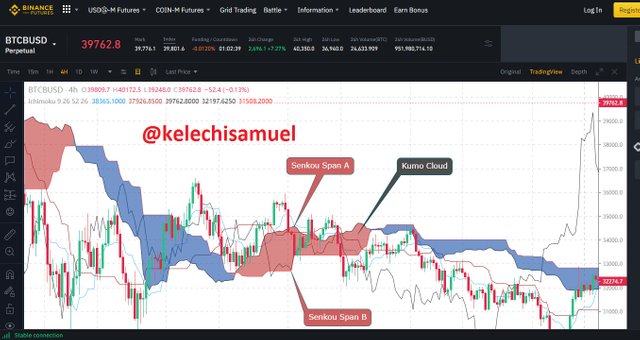
this is the kumo cloud below
Also the kumo cloud is used to determine the market is uptrend, downtrend or ranging. these are the chart showing the direction of the market below
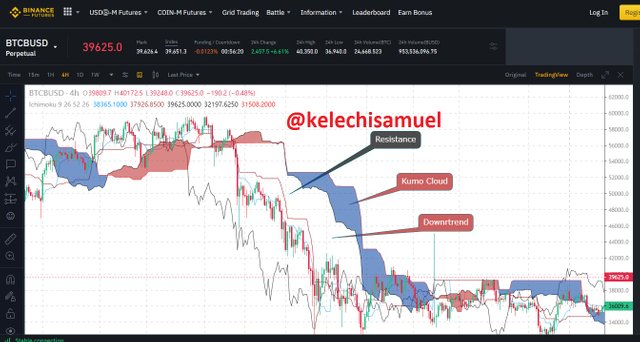
in this chart above, the kumo cloud is indicating a downtrend
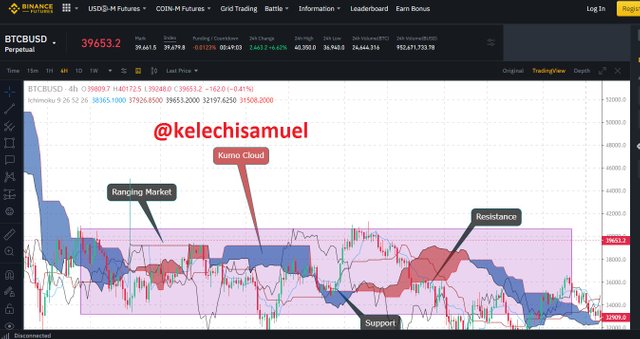
in the chart above the kumo cloud is showing a ranging/consolidating market
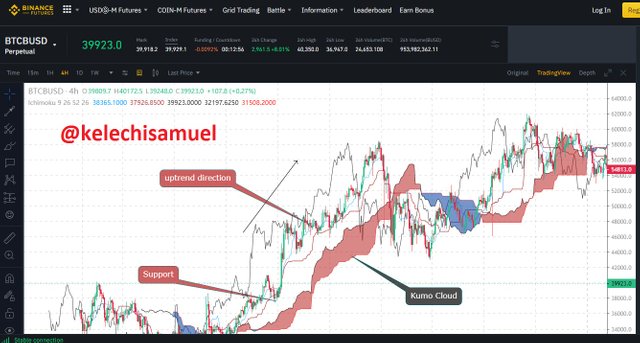
in this chart above the kumo cloud is showing an upward trend.
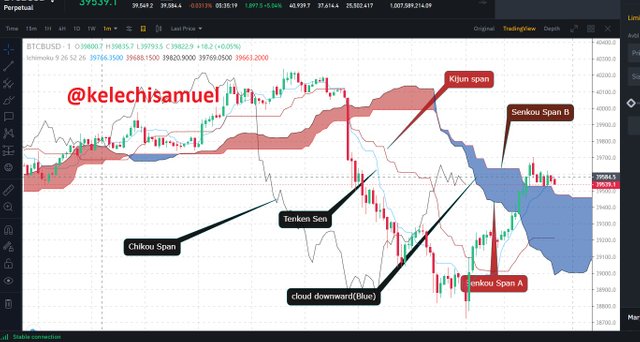
so lets discuss a little about the 2 lines that helps to form a kumo cloud. As i said earlier that kumo cloud is inbewteen the Senkou Span A and Senkou Span B.
Senkou Span A: which is also known as the leading span A, normally takes the top position which in turns signifies a buying trend. Sometimes, it serves as support in buying market and resistance in a selling market.it normally works with the senkou span B to produce the Kumo cloud and it is leading indicators with 26 period ahead the the price.. it can be calculated with the use of this formular. Senkou span A can be seen in the first chart above.
Senkou Span A = (Tenken-Sen + Kijun-sen)/2
Senkou Span B: Senkou Span B in Conjunction with Senkou Span A helps in the formation of the Kumo cloud in the Ichimoku Kinko Hyo Formation. Wheneevr the market is buying it is always found below but the trend changes to a sell, it position changes to the top. In moves in parrelel with the senkou span A with 26 period ahead also, which makes it a leading indicator. Senkouu Span be is also called Leading Span B , and it can be calculated by the using the equation below:
Senkou Span B = (52 high period high + 52 period high low)/2
What is the relationship between this cloud and the price movement? And how do you determine resistance and support levels using Kumo? (Screenshot required)
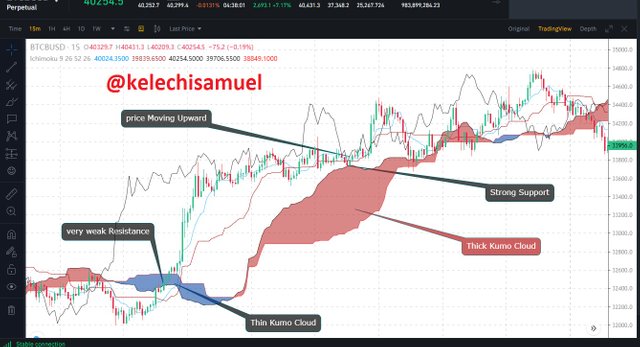
In the Ichimoku Kinko Hyo, Kumo Cloud has a great relationship with the price movement, even if it is 26 period ahead. So how do they relate, sit tight and relax your mind and read for a proper understanding. The most Important relationship between the cloud and the price movement, is in the size of the cloud. the size of the cloud determine how far the price will move and also the level of support and resistance the kumo can offer. for instance, if the kumo is thicker, and the price is upward , there is a high probability that the price will move further up and the support/resistance against the price will be stronger. But if the Kumo cloud is thin, the probability of the price to the continue in that trend will be low. that means a reversal can occur anytime if the kumo cloud is thin.
More so, the Kumo cloud also helps to determine the direction of the price. If the Price is above the kumo cloud that is an indiction for a buy and don't forget to check the size of the of the cloud while doing your analysis.
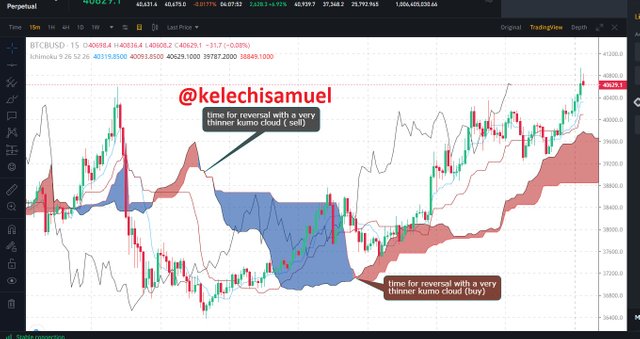
Another relationship is the determining of the reversal of a trend. if you watch closely, you will see the kumo cloud with different colours. those colours signifies different trends of price and it can be used to know the reversal. from the chart when the kumo cloud is red, it is a sign for a buy but when it is blue it is a time to sell. you can get such pionts when the kumo cloud becomes very thinner, if you want to follow a trend.
And how do you determine resistance and support levels using Kumo? (Screenshot required)
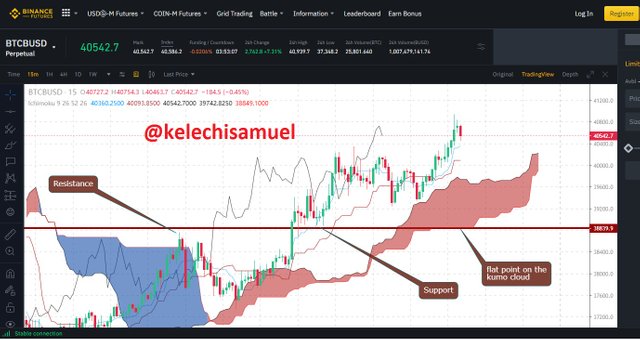
To Determine the resistance/support using kumo cloud is very easy. just look for any point in the kumo cloud that is straight, the straight can either be a support or a resistance depending on your usage and the trade position. after locating the point, then you can draw your line .
How and why is the twist formed? And once we've "seen" the twist, how do we use it in our trading? (Screenshot required)
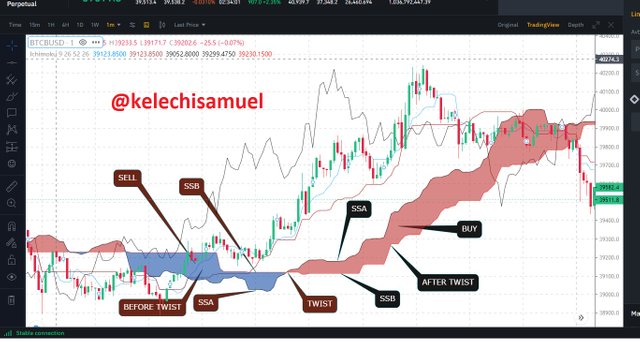
Kumo cloud normally have twist, the question is how is this twist formed, the twist is simply formed when the Senkou span A (SSA) crosses against the Senkou Span B. And these normally indicates a change of trend. the twist normally occurs at the point of the thinnest cloud or there is likely to be a twist in the point of a thin kumo cloud .
Twist normally happen when either the buyers or the sellers are weak. if the buyers are weak, the SSB crosses against the SSA and this will result to a sell price movement.
if the sellers are weak, the SSA will cross against SSB, and this will result to a buy price movement.
When the ttwist is seen, you have to wait for a while before entering the trade. in this scenerio you will also consider the teken-sen and the kijou-sen, if there direction is in line with your assumed direction.
What is the Ichimoku trend confirmation strategy with the cloud (Kumo)? And what are the signals that detect a trend reversal? (Screenshot required)
ichimoku as i have said earlier, is a very strong indicator, but use it to trade, you need to know the other components that makes up the ichimoku indicator. for a properly analysis to take place, the following needs to be in place.
- The Conversion line (Tenkan-Sen)
- The Base line (Kijun-sen)
- The Lagging Span (Chickou Span)
- The Leading span A (Senkou Span A )
- The Leading Span B (Senkou Span B)
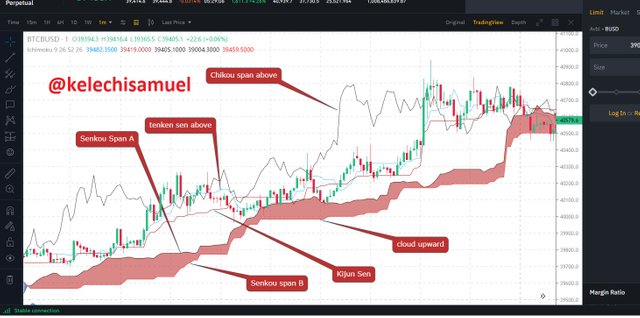
the ichimoku trend confirmation strategy can be gotten like this, lets say for a buy trend or upward trend, the chickou span should be above the price, the Senkou Span A should be above the Senkou span B and the the tenken sen should also be above the Kijun sen and lastly the cloud should be facing up indicating the upward trend while
for a downtrend, the chikou span should be below the price and the senkou span B should be above the senkou span A , also the Kijun sen should be above the Tenkan sen and finally the cloud should be facing downward.
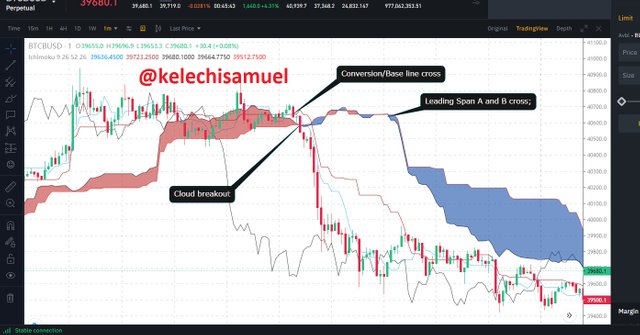
the following below are the signals that detect a trend reversal in the ichimoku
- Cloud breakout
- Conversion/Base line cross
- Leading Span A and B cross;
Explain the trading strategy using the cloud and the chikou span together. (Screenshot required)
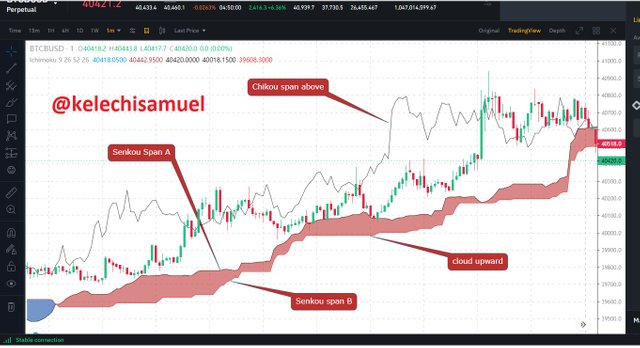
for the trading strategy using cloud and chikou span for buy, the following should be done;
the chikou span should be above the all the candles/price then the for the cloud, the Leading Span A should be above the Leading Span B and also the cloud should be facing up couple with the change in the colour which is depending on the setting you did.
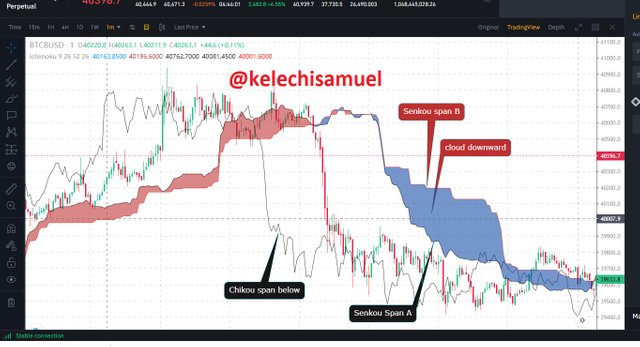
For the trading strategy using cloud and chikou span for a sell, the following should be done.
the chikou span should be below all the candles stick/price and for the cloud, the leading span A should be below the leading span B and the colour of the cloud which is dependent on your setting and the direction of the cloud which suppose to be dwonward.
Explain the use of the Ichimoku indicator for the scalping trading strategy. (Screenshot required)
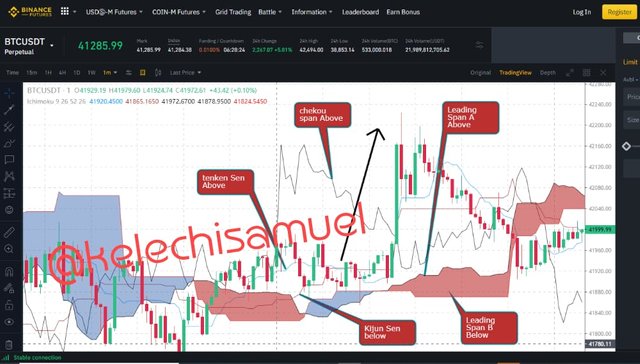
Ichimoku scalping strategy can be achieved by the following methods. If it is for a buy order, the leading span A must be above the leading span B, and the chekou span must be above the price/candlestick and the kumo. The tenken sen must also be above the kijun sen. The cloud should be heading towards up and the colour should have changed depending on your setting. The price should be closer to a major support in the market.
With all these condition met, you can execute a buy order and with a risk to reward ratio, you can place your take profit and stop loss.
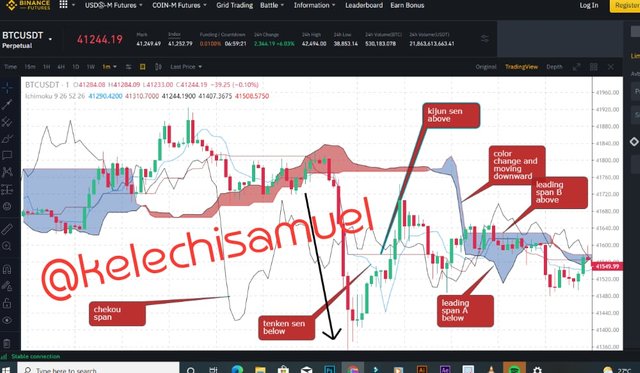
For a sell order to be placed, the reverse of the buy conditions should be considered, which are, the chekou span must be below the price/candlestick and the kumo. The leading span B must be above the leading span A, the kijun span must also be above the tenken sen. The colour of the kumo should also be changing due to your settings and the direction is tending toward the down trend. With all these conditions met, you can set your risk to reward ratio of 1:2. Which will help you place your stop loss and take profit..
CONCLUSION
Ichimoku kinko hyo is one of the best technical indicator used by most traders. It has been tested to be 75% accurate if used properly.. Kumo is a major tool in the indicator, which serves as an evolving support/resistance and can also be used to determine the trend of the market. We have also learnt about how the kumo is formed. I will advise you to give it a try and reap the benefits..
Best regards
@kouba01
Hello @kelechisamuel,
Thank you for participating in the 5th Week Crypto Course in its third season and for your efforts to complete the suggested tasks, you deserve a 3/10 rating, according to the following scale:
My review :
Poor content in which you tried to answer the questions in your own way and I have some points I would like to raise:
You provided a set of information to explain the Ichimoku cloud and its lines, but it lacks a methodology and an arrangement of ideas.
As for determining the levels of support and resistance based on the Ichimoku cloud, it differs on the traditional method, and this is what you are asked to interpret.
The rest of the questions could have been more in-depth in analyzing some aspects. It seems that you did not diligently search for what is required.
Thanks again for your effort, and we look forward to reading your next work.
Sincerely,@kouba01