Crypto Academy / Season 3 / Week 5 - Homework Post for @allbert
Explain in your own words what FOMO is, wherein the cycle it occurs, and why. (crypto chart screenshot explanations needed)
The concept of FOMO (Fear Of Missing Out) entails traders having wrong and unfeasible thoughts of making profits out of a market, be it Bullish or bearish which be.
Most times we see such mind situations, maybe due to previous market trend occurrences forgetting that the trend, changes. This fear, makes traders feel that they would not benefit from a particular asset if they handle it the way, they are actually supposed to handle it for example an asset that is meant to be sold, FOMO makes.a trader feel that he should keep holding and this alternatively could bring heavy losses to the trader's side
Let us use a quick graph to explain this as we see a graph of Ripple on the Trading view platform.
Now we're considering a fast example of Alex with the consequences of his Fear of Missing out via the graph below
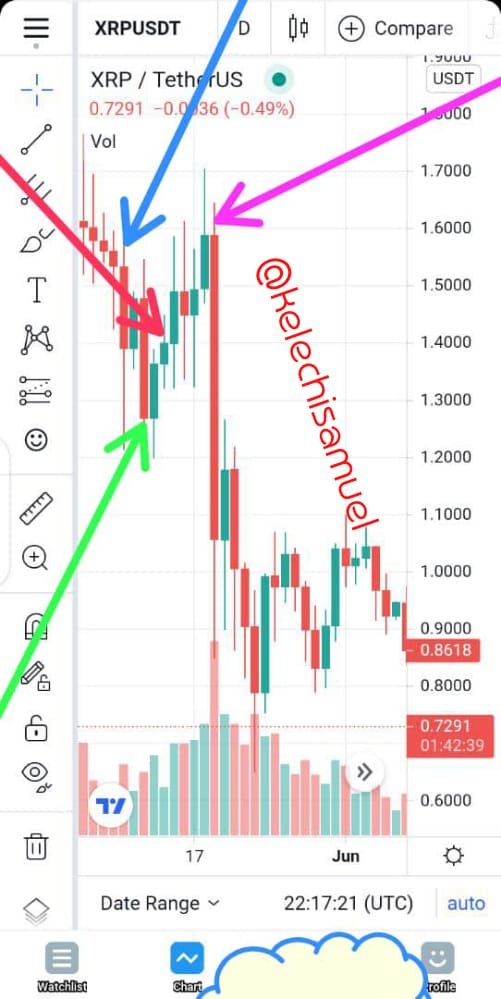
Firstly we note that I used different arrows, to show different trends of the market and his actions towards them.
At first, Alex picked interest in ripple after seeing its close falter in value and sense a soon rise after, it had stepped down in about 4 bearish trends, so Alex bought with his fees meant to be paid soon and expect a yield to get other stuffs with the made profit.
The Blue arrow shows the point, Alex bought at as it leveled down the drain even more and great fear gripped Him. A Bullish movement came up again and hopes of getting profits came alive once more not until the Lemon arrow shows where the market hit too low and out of fear of losing all entirely, he decided to sell
Sometime after, the trends saw Ripple at a bit Bullish and heading to the price he got it previously at and regrets hit him so hard at mind so he decided not to miss this one and had to buy back.
He finally met this profit chance and saw his assets a bit above the previous price he had gotten before now he had borrowed and put in money as to gain enough funds and not miss out on this big trend, instead, the market fell to heavy losses.
He let the fear, get him, he lost asset value and couldn't pay because he fearfully followed the trend, not to gain but just to make sure he wasn't missing out.
Finally, we understand that at times, it's hard to avoid the fear of missing out but we could do better, if we develop a mindset of minimizing losses and making profits. Since the market trends would always bring profits and losses sometime in our lives alternatively
Explain in your own words what FUD is, wherein the cycle it occurs, and why. (crypto chart screenshot explanations needed)
The concept of FUD (Fear, Uncertainty and Doubt) relatively explains the attitude of traders towards falling markets.
We also see that this major fault could be due to the skeptical, fearful and desperate nature of traders on the market, depriving them of their patience to wait and benefit from a market.
The three levels of this concept could be batter explained individually as it would help in proper understanding of the passage.
I would be explaining this properly with a 6 months backdated XRP graph on Luno
I'll be showing the assumed three levels of this FUD using the Candlestick trends
on this graph
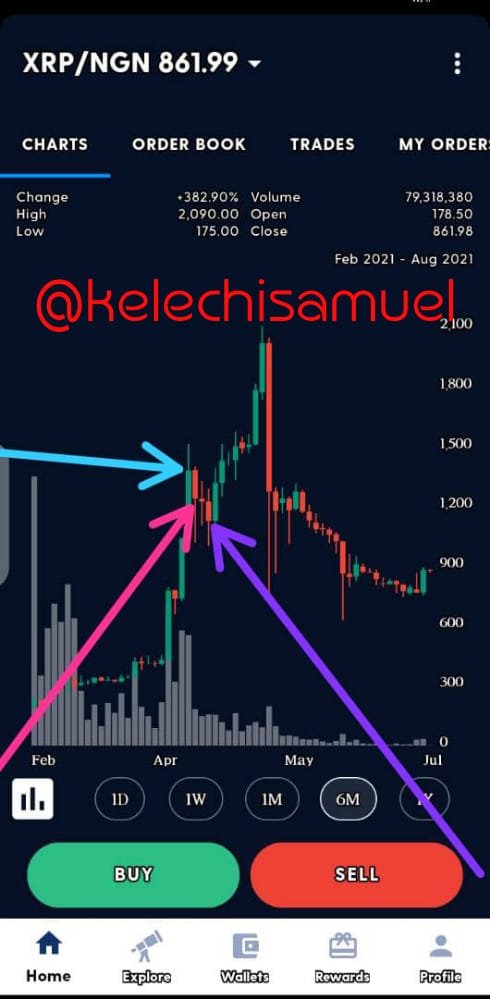
Fear : Sometimes the cause of this fear initially, could be buying of assets at the wrong time for example a trader buying assets of a Bullish move and the assets now tend to get bearish in value afterwards, we see this to be a great factor that makes traders think that the market is not meant to favour them and even making them consider, selling off their assets, here Fear comes in.
Like we see in the first Light blue arrow in the graph, pointing at the point where an assumed John, bought Ripple assets for 1300 naira and we see the assets form a bearish candle afterwards the purchase, hereby showing an instant loss in value relatively which has brought fear to the mind of John.Uncertainty :
This is another level of this skeptical mistake of traders which is due to over thoughts of the loss in value of the assets as time go by.
Here we consider that the Trader doesn't know exactly, whether to sell or hold and could act rashly based on such thoughts if the situation isn't handled properly
This point could be depicted in that chart now,with the pink arrow, by the bearish Doji Candlestick which alternatively, should not be acted on till a next candle formsDoubt : We see that doubt, is the last level of the FUD where the trader has the final conviction that the assets cannot rise again.
Deductively, we could say that the actual last level of this is regret since once the traders sells off in doubt, the Bullish candle's afterwards sends a big message of regret and pain to the trader
We can refer one more time to the passage by looking at the pointing of the purple arrow where the market falls to and Mr Alex finally sells off. We see the absolute, regrets of this FUD now as there is a Bullish trend after this sell off and the trader regrets his actions and has the fear to buy back since he feels the market could take the previous shape againFinally on this FUD, we see analysis (be it fundamental or technical) as another major factor which could make traders experience this FUD so we should disregard irrelevant news about assets and traders could avoid/control this by setting stop losses adequately and buying at right time and not just selling off in a market out of emotions
Choose two crypto-asset and through screenshots explain in which emotional phase of the cycle it is and why. Must be different phases
We are going to be considering two crypto assets undergoing emotional chart phases and what particular emotional phase, the cycle is and why it is.
Firstly the lesson, brings up a chart, showing an example of what this emotional chart looks like and we understand the different levels of emotions based on the market trends and I'll be explaining mine, using two cryptoassets namely:
RIPPLE (XRP)
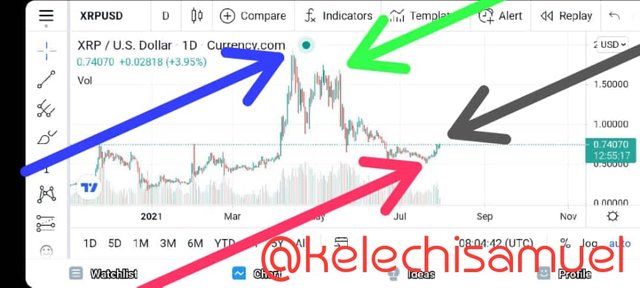
Going through this Ripple chart, there are several market levels, I denoted with different colors of arrow pointers which I would like to explain before I get to the present phase and we begin from the first one, denoted by:
The Blue arrow :The blue arrow, explains a point where traders feel that they have maximized their profits from their trading prowess and have accumulated such wealth that it's impossible to exhaust and even if the market falls, it can't get lower than their profit.
The Lemon Arrow, shows a market phase, that keeps the trader a bit tensed and clueless of what do do, whether to sell or hold but he knows that the market isn't totally bearish so, he won't sell, instead, he waits for further market actions to know his next step
N/B :There are further levels /phases but to keep it short I reduced to four
The Red Arrow : The red arrow, connotes a strategic point, it finally dawns on a holding trader, that he lost utmostly /totally in the market and that the trends were his friend but he didn't make good use of them
Here there is regrets for those who didn't sell off to buy later
The Black Arrow :
The black arrow, is the Most important part of this assignment which is the present phase of the crypto asset after the utmost fall which shows a rising margin and unbelievable action as traders feel that it couldn't have been possible.
This phase shows a silver linen in a dark cloud and brings hope to traders of assets rising further
BITCOIN
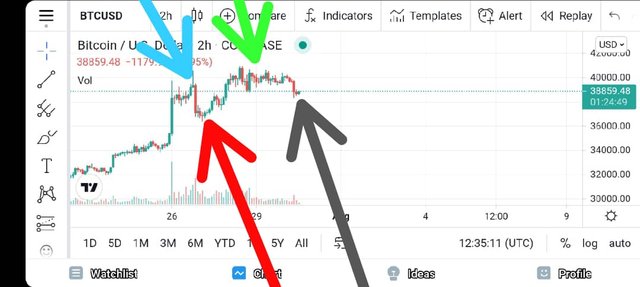
The Second Crypto asset we could be considering its phase, is the Bitcoin asset and I represented the different phases too with different arrows, like I did in the former asset
Here we'll be considering first, the
Blue Arrow : Before the blue arrow. We see that there was a previous Bullish movement and can see some fluctuations after it before the Bullish candle that has the blue pointer on it, therefore we see the blue candle, to be a place where traders, seem satisfied with the market movements and feel good in their trading
The Red Arrow :The red arrow, shows a noticeable fall in the asset value and this point the traders begin to feel anxiety and fear of losing their assets and at this point they begin to consider selling off the assets
The green Arrow : The Green Arrow shows relief for traders even though there are slight bearish trends along the movements.
This is quite a relief since the market price is above the former price when it experienced a bearish trend
The Black Arrow and the final phase:
The black arrow shows a relative bearish trend after the movements just around the line there.
It shows traders about to experience a little bearish movement since there has been an uptrend maintenance over the past times on the chart
Based on the analysis done in question 3, and the principles learned in class, make the purchase of 1 cryptocurrency in the correct market cycle. The minimum amount of 5USD (mandatory), add screenshots of the operation and the validated account
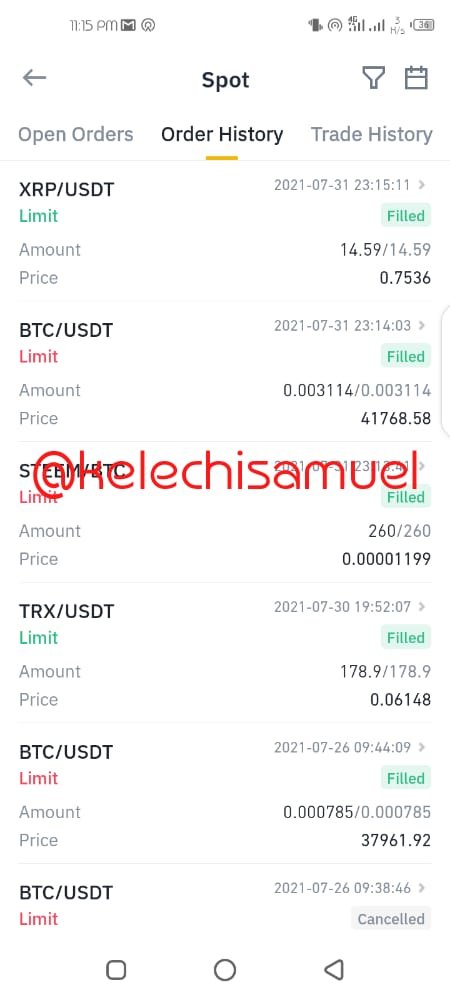
I will be dropping the steps to which I purchased the ripple(xrp) asset
- Open your binance account, the first image is an image of my verified account
- Click on market
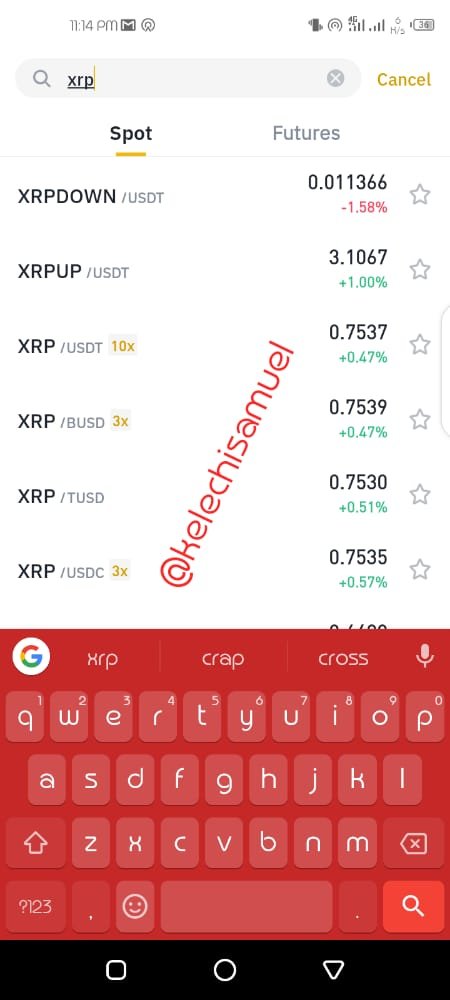
- Search xrp/usdt
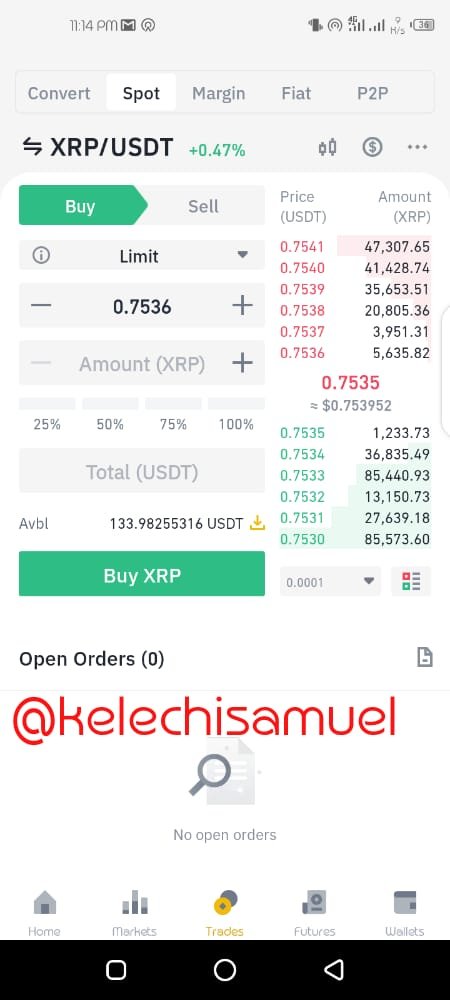
- Click on buy
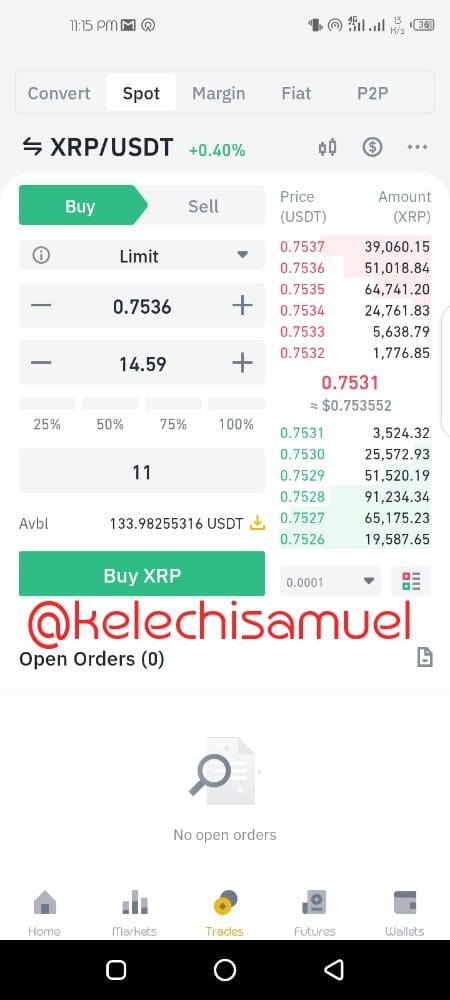
- Input the amount of usdt you are willing to exchange for ripple for me I exchange 11xrp
- Click on buy and you are good to go
See screenshot below

Best regards
@allbert