Technical Indicators 2 - Crypto Academy S4W4- Homework Post for @reminiscence01

a) Explain Leading and Lagging indicators in detail. Also, give examples of each of them.
b) With relevant screenshots from your chart, give a technical explanation of the market reaction on any of the examples given in question 1a. Do this for both leading and lagging indicators.
Like the name implies, leading indicators are indicators that are use to predict what the market will look like ahead. Consequently, leading indicators enable traders to spot and predict price behavior and movement before it happens in the market. With these indicators, traders are able to enter the market early based on the signal the indicator presents.
Let me use the Stochastic indicator which is an example of a leading indicator to explain this proper. We all know an asset has entered the oversold region when it is below the point 20 and it is in the overbought region when it crosses the point 80 on the Stochastic indicator. Furthermore, an asset in the overbought region corresponds with a bullish trend and an asset in the oversold region corresponds with a bearish trend in the chart. On the indicator, when the stochastic line hits the overbought region and fall back below the 80 point and below 50 it usually indicates a trend reversal and the start of a bearish trend same way when the price hits the oversold region and crosses the point 20 and above 50 it usually indicates a trend reversal and the start of a bullish trend.
Let see this in a chart.
.png)
It is worth noting that, these leading indicators aren't always accurate. It's possible that the signals they send aren't accurate. These fake indications may lead traders to make hasty trade decisions that turn out to be incorrect. Traders should be careful when using these indicators and should confirm the signals using other indicators.
Examples are; Average Directional Index (ADI), Stochastic Oscillator, Relative Strength Index
These indicators work like the opposite of the leading indicators where it only shows already existing trends. Just like the name implies, it lags behind price movement so it usually sends signals of a trend that has already began. We can say it sends late signals.
With lagging indicators, there are no issues of fakeouts as the indicator relies on past price movement and behavior but the setback is it sends trade signals when the trend has already began and you might enter the market late or at a pont where the trend is weak and there you miss out the opportunity. The lagging indicators are best used in a longer trending market and also the confirmation of a strong current trend.
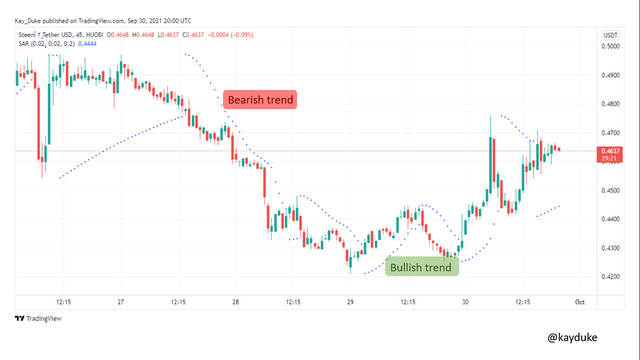
An example is the Parabolic SAR indicator as seen below
a) What are the factors to consider when using an indicator?
b) Explain confluence in cryptocurrency trading. Pick a cryptocurrency pair of your choice and analyze the crypto pair using a confluence of any technical indicator and other technical analysis tools.
Despite the numerous benefit indicators offer traders, there are certain factors that need to be considered when using indicators to prompt your trade choices because one wrong move can lead to the loss of your total investments. I will discuss some factors every trader should consider when using indicators.
- Know what your trading strategy is
This is a key factor to consider when using indicators . When you know what your trading strategy is be it a day trader, swing trader or a position trader, there is a need to know what kind of indicators you should employ to make your analysis. This is very key.
- Understand the Indicator
Certain indicators need to be tweaked from their default settings for better results and you can only do this once you understand the indicator you want to wor with and how it behaves. If you don't understand the indicator you choose to use, you make wrong meanings to the signals the indicato sends and the probability for loss is high.
- Understand the market trend
It is essential to know the trend in the chart before using an indicator. Every market trend type has appropriate indicators it works with best. In a trending market, it is best to use a trend based indicator like ADX for better results same way in a ranging market, moment-based and volatility indicators are appropriate.
- Confirm signals with other indicators
It is a wrong practice to always work with signals from a single indicator. When you do this, you are likely to incur losses. Once you pick a trade signal from an indicator, it is prudent to employ different indicators to see if they all confirm the signal before you enter the market to trade.
Confluence in Trading
Confluence simply means consensus or unity. In trading, confluence simply means the adoption and use of several technical indicators to confirm a signal. Thus, after using a number of technical indicators and they all give the same signal information, the probability for loss is very low and guarantees traders positive results from tradig with the signal.
Below is a chart with about 3 indicators ( Moving Average, RSI and Stochastic) used to see if they all send the same signals (Confluence).
.png)
From the chart above, we see all three indicators give a trend reversal signal (the end of a bearish trend and the start of a bullish trend) at the point marked in the chart. Indeed, this signal corresponded with the price behaviour as seen in the chart.
a) Explain how you can filter false signals from an indicator.
b) Explain your understanding of divergences and how they can help in making a good trading decision.
c) Using relevant screenshots and an indicator of your choice, explain bullish and bearish divergences on any cryptocurrency pair.
How to filter false signals
I believe at this point we all agree indicators are not 100% accurate and they can give false signals and false hopes to traders. To be able to escape this very likely problem, we can see if the signal corresponds or there is some confluence with the signal from the indicator and subsequent price movement inthe market. If the market information corresponds with the signal, it means the signal is correct but in cases where there is some divergence, then there is a problem which means the signal from the indicator is not accurate.
Adoption or the use of different indicators to test the signal can also help identify if the signal is accurate or false. When all the indicators used are giving the same signal, the signal is accurate then and when it is the opposite, where there is no confluence then the signal may be false.
Divergences
Divergence is what the opposite of confluence is. Whereas Confluence is when the signal corresponds with price movement, Divergence is when price moves in the opposite direction with that of the signal. Thus, the indicator presents a false signal.
Divergence can be used to predict trend reversals in the sense that, when a divergence happens, say a bullish divergence but price keeps dropping. This sends an early signal to traders that the current bearish trend is almost ending and the trend will reverse in no time. Traders with this knowledge take a buy position and make profits from this occurrence.
Bullish Divergence
This is where the indicator signals an uptrend but in the market, the price is seen to go low. This simply means the current bearish trend is almost ending and a bullish trend is about to start which will later push the price up as the indicator signalled earlier.
See screenshot below
.png)
Bearish Divergence
This is where the indicator signals a downtrend but in the market, the price keeps rising. This simply means the current bullish trend is almost ending and a bearish trend is about to start which will later push the price low as the indicator signalled earlier.
See screenshot below
.png)
Conclusion
Technical indicators are essential tools for traders and analysts to better understand the market and predict price behavior and movement. Traders who understand and use the market effectively tend to understand the market, make close to accurate if not exact predictions, and trade with this information with a lower margin of loss.
For best results, they should be used in conjunction with other technological tools.
Thanks for reading and big credits to @reminiscence01 for this wonderful lecture. Are we going to have a third part of this lesson?
Regards
@reminiscence01 please you have not marked my work please. This is the link.
Your work seems not to appear on my tag. I'm sorry about that.
I will attend to you shortly.
Sure thanks