Steemit Crypto Academy Season 3 Week 2 - Homework post for @reminiscence01 | Introduction to Charts

Hello steemians, I’m glad to be part of this week’s crypto academy lessons. It’s been an amazing journey for me in the steemit world especially learning new stuffs everyday and making the best out of it. I’m @kaydee009 and this is my answers to the homework sir @reminiscence01 gave us.
- Explain the Japanese candlestick( chart screenshot required)
The Japanese candlestick was developed by a rice trader Munehisa Homma in the 1700’s. The Japanese candlestick is use by most people due to the simplified way it represents price movements. It has more when you go into details into it showing market volatility behind price fluctuations. Most people prefer it because it gives much information about the market than most charts.
There are two types of candles in the candlestick chart, one is red and one is green mostly these are the different colours for these candles every trader and every user can change the colour depending on their specifications and trading systems. The red candle represents the downfall of the price and the green represents the up words movement of the price.
Taking a good look at the shape of the candlestick, it can be seen that it has various parts which gives information on how the market is behaving.
 source
The parts are the tail, the body(being the space between the opening and closing price), shadow( this could be low or high), opening and closing price; each part standing for a specific point in price movements.
The shadow represents unsettled price movements meaning price at the shadow region varies at anytime.
The body represents the distance covered within a specific time; this can be in days, months or hours.
Candlestick charts help us to identify if the market is bullish or if the market is bearish, when we see many green candles in a chart and It's continuously Green it means that the market is going upward and at the same time if we see so many red candles going downwards it means that the market is bearish.It should be noted that the colour can be changed based on the traders specifications or choice.
Describe any other two types of charts? (Screenshot required)
Line chart
LINE CHART
The is use to represent data with by linking data points with a continuous line. The line chart is the most basic type of chart since it’s also easy to read and analyze. The line chart gives information only on the closing price of an asset over time hence doesn’t give more information compared to the Japanese candlesticks. Line charts can be used for any timeframe, but they most often make use of day-to-day price changes.
Because of its simplicity, however, traders looking to identify patterns or trends may go for chart types with more information, such as a candlestick.
BAR CHART
Bar charts consist of multiple price bars, with each bar illustrating how the price of an asset or security moved over a specified time period. Each bar typically shows open, low, high and closing prices, although this may be adjusted to show only the high, low, and close.
Traders use bar chart to analyze price action, which aids in trading decisions. Bar charts allow traders to analyze fluctuations , spot potential trend reversals and monitor volatility and price movements. It is quite similar to the candlestick chart the only difference between a candlestick chart and a bar chart is the shape and that's it, both of these charts give you the same information in different ways so a bar chart is also one of the best charts for the market analysis.
In your own words, explain why the Japanese Candlestick chart is mostly used by traders.
The Japanese candlestick makes analyzing of marketing trend much easier by watching the chart. If for instance the two colours used in the market are green and red, when there are more greens it indicate the market is bullish but when they are more reds then it’s bearish. Most crypto traders prefer the simplified way the Japanese candlestick provides information because its fast and understandable.
Line charts does not gives all information needed to predict the future price of an asset since it base on closed price only making it an non preferred choice by traders. Candlestick gives a details about where the market started and where it ended and how much it was low and how much it was up to you get a clear idea about what will happen next. These informations makes traders prefer the candlestick because it gives much information on when to invest
Candlestick charts are very easy and it tells you if there are more buyers in the market or more sellers in the market and it also tells you if demand or supply is high or low. Looking at that you can predict the price and also where the market will be heading towards at that time, making traders prefer the candlestick chart
*Unlike how complex the bar chart is the candlestick provides a simplified and easy way of understanding the chart. The bar chart requires careful analysis before it could be understood but the candlesticks requires less analysis compared to it.
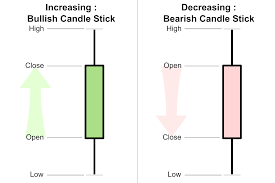
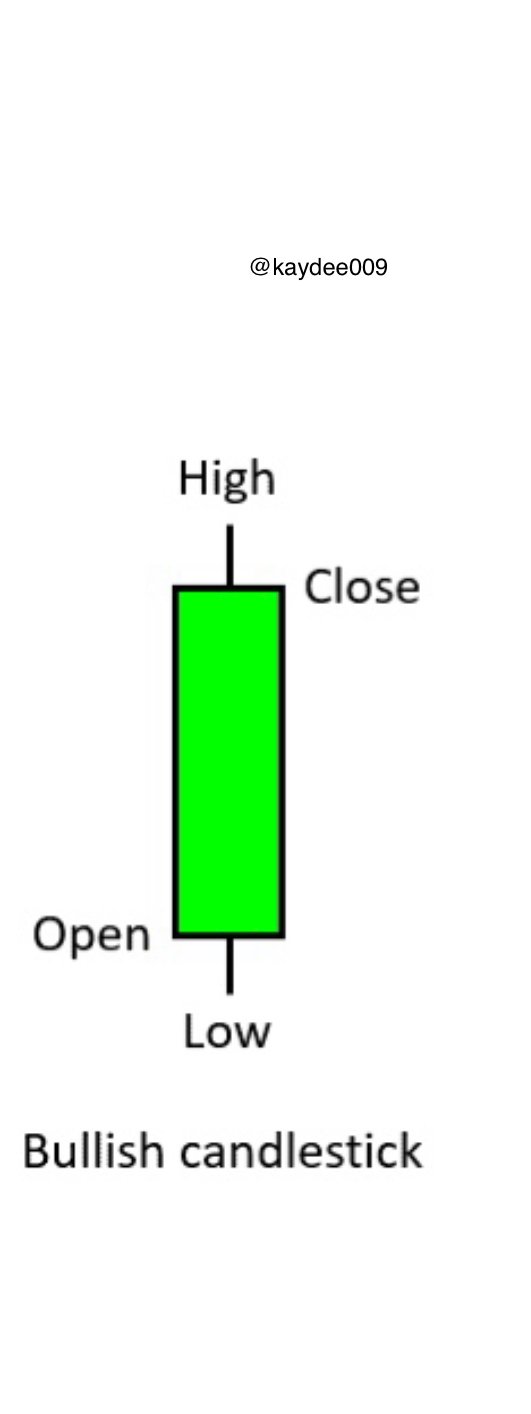
Describe a bullish candle and a bearish candle identifying its anatomy? (Screenshot is required)
The bullish candle
Bullish market occurs when there’s a uptrend in market prices. When the prices of an asset is rising the bullish candle is use to represent it. A candlestick that has the close above the open is a bullish candlestick. The bullish candlestick has the high price, closing price, opening price and the low price of a particular time frame.
 )
)
For any time used whether it’s hour, day, week or monthly the close is always above the open. The colour is not necessary green since it can be changed based on the traders choice.
Bearish candle
A bearish market occurs when there’s a downtrend in market price of an asset. It’s represented using a bearish candlestick which has open above the close.
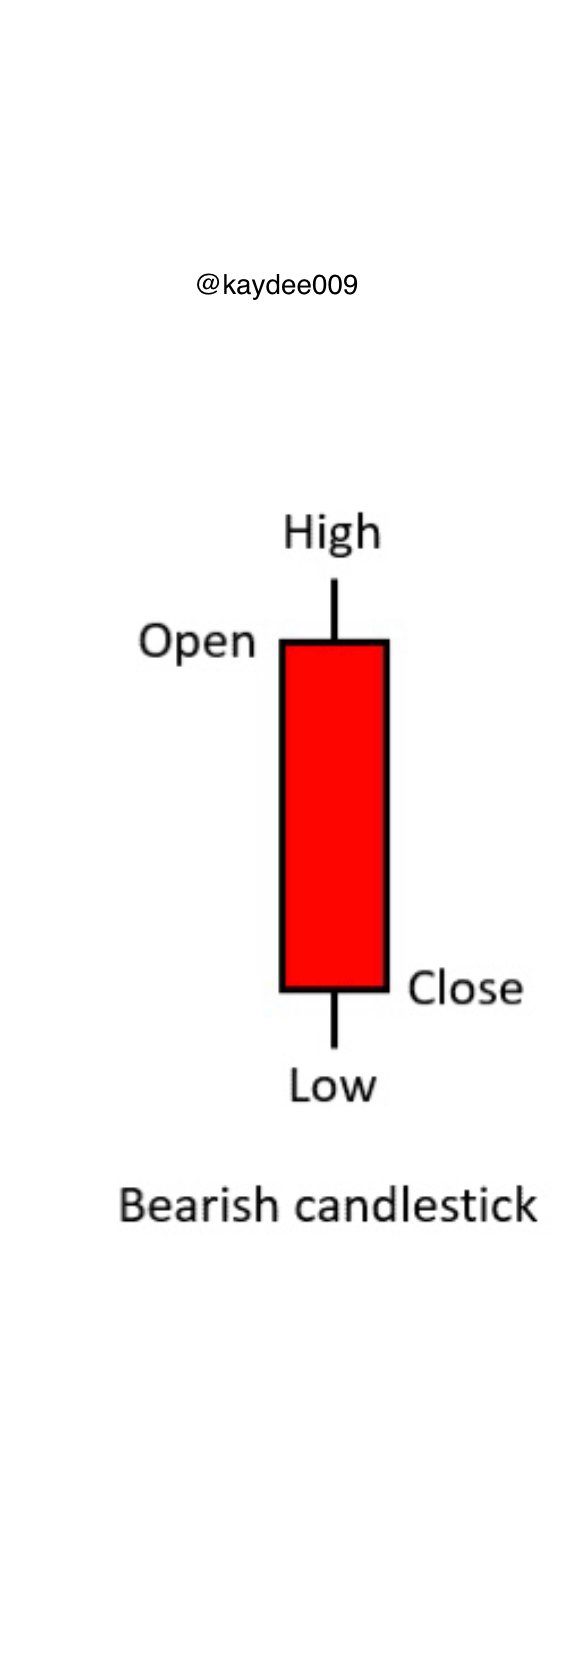
The bearish candle has the opening price, closing price, high price and low price. In a bearish candle, the initial price is usually higher than the ending price, indicating that prices have fallen at the same time.
The colour for the bearish candle is not necessary red and does change based on traders choice and specification.
CONCLUSION
From the lectures sir @reminiscence01 I learnt that candlestick is use to represent fluctuations in prices over a given period of time. There also various ways which price movements can be represented some of which are line chart, bar chart, volume chart and more. I really enjoyed learning from you @reminiscence01.
You have been selected for 500SP Minnow Support Program and will be supported by Booming Curation Support. For more details about this program please check this post 500SP Minnow Support Program for Newcomers(Revised Edition) updated on 24/5/2021
Don't forget to attach your Achievement 1 post link to every of your post published in this Steemit Nursery community.
Thank you I really appreciate @edlili24
Hello @kaydee009, I’m glad you participated in the 2nd week of the Beginner’s class at the Steemit Crypto Academy. Your grades in this task are as follows:
Recommendation / Feedback:
Thank you for participating in this homework task.
I really appreciate sir @reminiscence01 I’ll work on my markdown styles
Hello @kaydee009,
I notice a transaction history in your account with a bot account @tipu. May i know why ?
I wanted an upvote so I asked @tipu