[Crypto Trading with Moving Average] - Crypto Academy / S6W2- Homework Post for @shemul21 by @kawsar
Today in this post I will share with you my Homework Task (Season 6/Week-2) for Professor @shemul21. The course that the professor @shemul21 has discussed with us "Crypto Trading with Moving Average". I have learned a lot about The Crypto Trading with Moving Average from this lecture of the professor.
Crypto Trading with Moving Average is a favorite tool of traders. I personally use it too and I think it gives a lot of good results. I am very grateful to the professor for discussing with us Crypto Trading with Moving Average.


Moving Average is a very popular tool among traders. With Moving Average, a trader can easily find out the average price value of the market in a given period of time. With the help of Moving Average, a trader studies the market movement as it was before and gives an idea of where the market might go in the future. It is very easy to use and set up for both new and old traders. So this Moving Average Indicator is one of the most preferred and popular tools for all types of traders.
We must know that tactical analysis is a very important part of trading and it is vital to be successful in trading. And moving averages are also called the lifeblood of technical analysis, because of course, moving averages are required very strongly for technical analysis. Moving Average is a very necessary and popular tool for both new traders and many experienced traders. Everyone uses this tool to do technical analysis in their trading.
It is also widely used by traders as a tool to measure area and speed of moving average support and resistance. This Moving Average provides traders with the opportunity to determine potential support and resistance levels. We also get signals of market trends through Moving Average. Moving Average Indicator helps a trader a lot to understand the market trends. The market is now in uptrend, downtrend position, we can understand with the help of this indicator.
In cryptocurrency trading, the Moving Average Indicator is a tool that is very useful to traders. It helps the traders to identify the movement of the market and it helps them to identify the uptrend, downtrend and sideways. Traders make their trading decisions based on these. There are several types of moving averages that we will discuss in the next lesson.
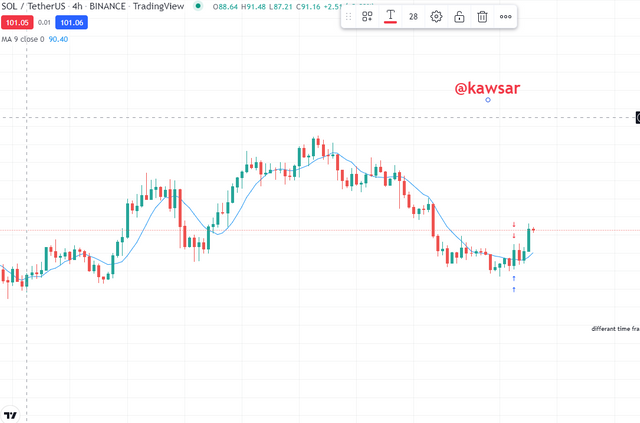
I have added the moving average here in my chart. From the chart above we can see that the market is moving with the moving average and the moving average is giving us a signal that the market is on a downtrend now. This way we can know the market trend by installing moving average in the chart.

We must know that and as I said before, the moving average is a very important factor for technical analysis and traders use the moving average very strongly for technical analysis. Moving averages are generally of three types.
- Simple Moving Average (SMA)
- Exponential Moving Average (EMA)
- Weighted Moving Average (WMA)
Simple Moving Average (SMA)
Simple Moving Averages which is called SMA for short, traders call it SMA. With a simple arithmetic calculation based on period and price, we can understand the trend direction through this Simple Moving Averages (SMA) system. We can use this Simple Moving Averages (SMA) to get buy and sell signals.
We can determine the time of the moving average based on whether we are interested in trading in the short term or the long term. Traders normally use 3 time moving averages in most cases. Normally 10-day moving average, 50-day moving average and 200-day moving average are used for short-term, intermediate and long-term.
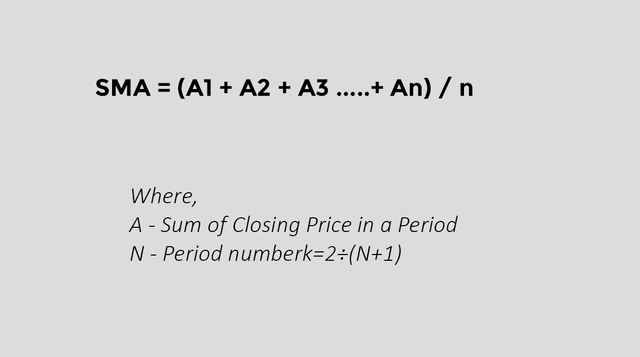
Formula of Simple Moving Average (SMA)
Example,
| Day | Price |
|---|---|
| Day 1 | $2 (Closing Price) |
| Day 2 | $3 (Closing Price) |
| Day 3 | $1 (Closing Price) |
| Day 4 | $4 (Closing Price) |
| Day 5 | $5 (Closing Price) |
SMA = ($2 + $3 + $1+ $4 + $5) /5
SMA = $15 / 5
SMA = $3
Exponential Moving Average (EMA)
Exponential Moving Average (EMA) is a bit like Simple Moving Average (SMA), these two have a lot in common. However, there is a slight difference between Exponential Moving Average (EMA) and Simple Moving Average (SMA).. We can get market direction from Exponential Moving Average (EMA) just like Simple Moving Average (SMA). However, the difference is that Exponential Moving Average (EMA) gives more importance to the current period price than the pre-period price, whereas Simple Moving Average (SMA) gives equal importance to all previous averages.
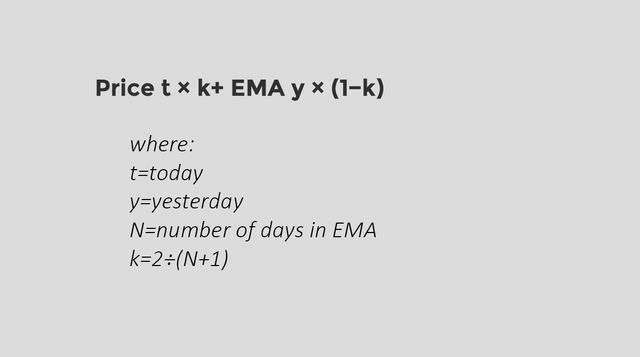
Formula of Exponential Moving Average (EMA)
Weighted Moving Average (WMA)
Weighted Moving Average (WMA) can reveal the future movement of the market much faster than Simple Moving Average (SMA). Because I know that Simple Moving Average (SMA) gives more importance to the data of the past market and Weighted Moving Average (WMA) gives more importance to the current market condition than the past market. So we get a better idea of the future market through Weighted Moving Average (WMA).
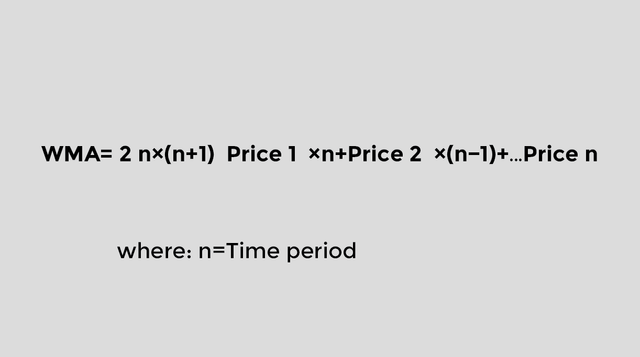
Formula of Exponential Moving Average (EMA)
In the screenshot below I have installed 3 types of moving averages in my chart. And I've given 3 different colors
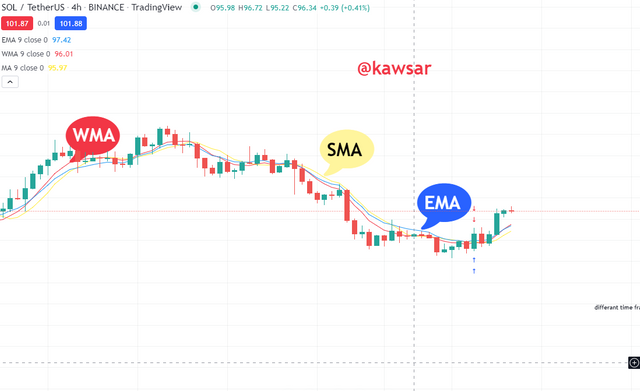
Differentiate Between Them
So far we have discussed about these 3 simple Simple Moving Average (SMA), Exponential Moving Average (EMA) and Weighted Moving Average (WMA). This time we will discuss the differences between these 3.
| Simple Moving Average (SMA) | Exponential Moving Average (EMA) | Weighted Moving Average (WMA) |
|---|---|---|
| The Simple Moving Average (SMA) indicator gives us the average price of a particular period. | Exponential Moving Average (EMA) gives more importance to the data of the current period than the price of the previous period. | The Weighted Moving Average (WMA) indicator places more emphasis on current period prices than on previous data. |
| Simple Moving Average (SMA) is more suitable for long term trading. Because it emphasizes both past and present prices. | Exponential Moving Average (EMA) is more suitable for short term trading. Because it gives more importance to the current price than the previous one. | Weighted Moving Average (WMA) is more suitable for short term or scalping trading. |
| Simple Moving Average (SMA) is slower than the other two. | Exponential Moving Average (EMA)works faster than Simple Moving Average (SMA). | Weighted Moving Average (WMA) also works faster than Simple Moving Average (SMA). |
| Simple Moving Average (SMA) has the potential to be beneficial with long periods. | Exponential Moving Average (EMA) is likely to be beneficial with short duration periods. | Weighted Moving Average (WMA) has the potential to be beneficial in both short and long term lengths. |

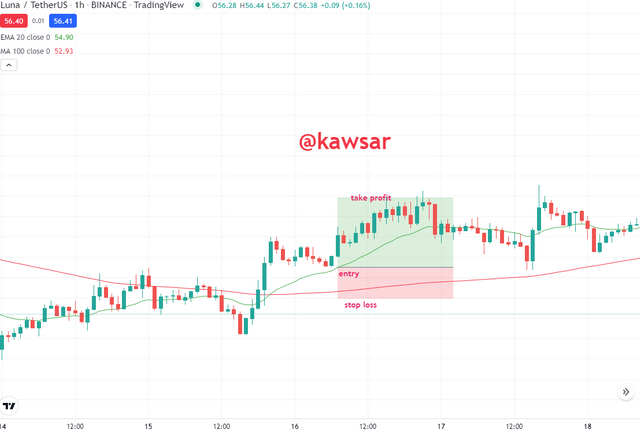
Moving Average is a very important tool for traders and this Moving Average plays a very important role in determining the entry and exit points in the market. Using this moving average we can find support and resistance, which I discussed earlier. I have taken Exponential Moving Average (EMA) 20 period and Simple Moving Average (SMA) 100 period in my chart to find these two entries. Exponential Moving Average (EMA) is green and Simple Moving Average (SMA) is red.
We have got Exponential Moving Average (EMA) as support which we can see in the screenshot below. I took a buy entry here and I found that entry point here. Here the green moving average has crossed the red moving average and I got a position a little later. I gave a stop loss below the red moving average. Earlier, the market was in bearish mood. But after the crossover here, the market has gone into a bullish mood. So I took a buy entry here.
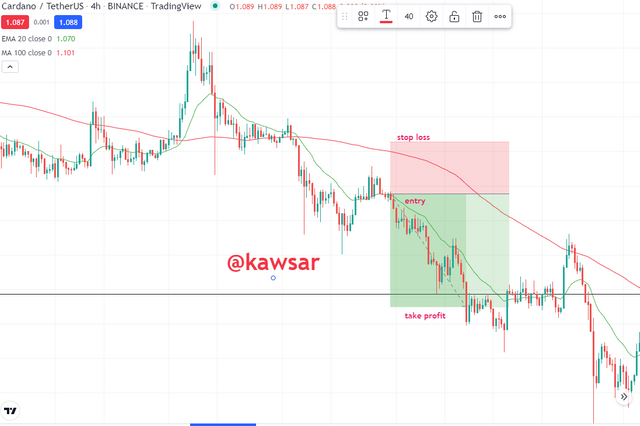
The market here was in the uptrend, then reversed and the market went downtrend. We have found Exponential Moving Average (EMA) here as resistance which we can see in the screenshot below. I can take a cell entry here and I found that entry point here. Here the green moving average has crossed the red moving average downwards and I got a position a little later. I have given a red color moving average subtop stop loss. I found this position in the Cardano / Tetherus pair.
Moving Average is a very popular and widely used tool among traders. With the help of Moving Average we found that entry and exit points are very easy to find. This moving average also acts as dynamic support and resistance in the trending market, which we also discussed above.
In this episode we combine the two types of moving averages and then we trade. Here the trader can set the moving average of any period according to his choice and use it in any timeframe.

Moving Average Crossing is when we add two moving averages to our chart, one moving average crosses the other moving average. And as a result of the crossing of this moving average, we can get the signal of trend reversal. And as a result of this crossing we get a very strong signal, through which we can take entry into our trade.
We add two moving averages to our charts for technical analysis or research in our trading. One is the fast moving average and the other is the slow moving average. When this fast moving average or slow moving average crosses one another, we can say that the moving average crossover.
Here we can take 50 day moving average as short-term moving average and 200 day moving average as long term moving average and when one crossover another we can say moving average crossover. Which we will show with a screenshot in our chart below. In the screenshot below we can see that one moving average has crossed another moving average, this is the moving average crossover.
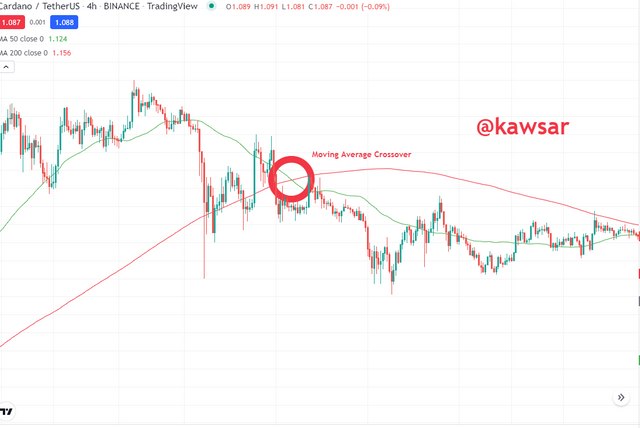
Moving Average There are two types of Moving Average crossovers. One is the Golden Crossover and the other is the Death Crossover. This time I will briefly discuss these two with screenshots.
Golden Cross
When we install two moving averages in our chart. One is the 50 day moving average and the other is the 200 day moving average. When this 50 day moving average crosses the 200 day moving average, we call it the Golden Cross and when the Golden Cross occurs the trend naturally reverses. The market goes from downtrend to uptrend and we can get a buy signal here.
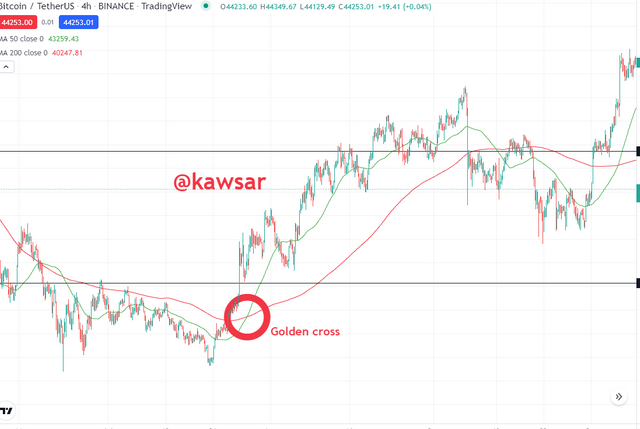
In the screenshot above we can see that the 50 day moving average has crossed the 200 day moving average and the market has been on a downtrend before but since the cross the market has gone uptrend.
Death Cross
When this 50 day moving average crosses the 200 day moving average downwards, we call it Death Cross and when Death Cross occurs the trend naturally reverses. The market goes from uptrend to downtrend and we can get a sell signal here.
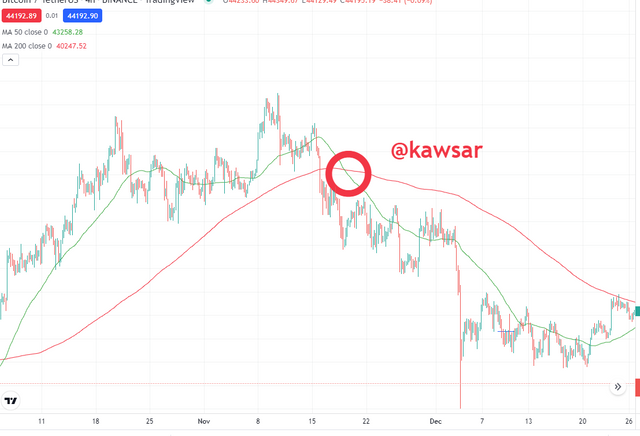
In the screenshot above we can see that the 50 day moving average has crossed the 200 day moving average downwards and the market has been on an uptrend before but since the cross the market has gone into a downtrend.

We've talked a lot about moving averages so far and we've learned a lot about the benefits of moving averages. Moving Average We can understand the market trends with the help of this movie, it often acts as dynamic support and resistance. However, although there are some benefits to everything, there are some limitations. We will now discuss the limitations of the moving average.
- In case of moving average, it may be too late to get the signal in case of trend reversal.
- When price fluctuations occur, it can sometimes give us false signals.
- We know that the moving average works very well in the trending market. But sideways in the market it does not work properly.
- This moving average indicates us only considering the average time.
- The moving average does not precede anything that happens outside of the average time.
- The moving average signals us to consider the past.
- Since it lags behind the index, it does not fully capture the current trend.
Above I have said about the limitation of moving average, it happens to everything that if there is a good thing then there will be a limitation. But if we are to use the moving average correctly in our trading, we must be aware of the above. Only then will we be able to achieve trading success.

Finally, I would like to say that Moving Average is one of the most important tools for doing technical analysis. We can do technical analysis of our trading with the help of this Moving Average and there are some limitations of this Moving Average which we have discussed. We must be aware of the limitations. Only then will we be able to make a profit in our trading by making good use of all the positive aspects of the moving average.
Moving Average is one of the most popular tools for traders. Using Moving Average and installing it is very easy for both new and old. The signals of the moving average are very easy to understand, so it is a favorite indicator for everyone. As we discussed above, there are several types of moving averages. But for those who understand best and for which we are perfect, we must use the moving average of that period.
And I would like to express my deepest gratitude and thanks to my dear professor @shemul21 for sharing such an important subject with us and for giving us the gift of Well Explained Lecture in such a beautiful way. By doing this task I have learned many new things which I did not know before.