Steemit Crypto Academy | The Swing Trading Style | Homework task for @yohan2on
Hello All Steemians !!!
On this occasion, I will try to take a class at Steemit Crypto Academy. I am interested in joining this class because there are many new lessons that I will get here. I will do homework task from professor @yohan2on. Lesson discussion about The Swing Trading Style. Lets try...
Trading & Swing Trading

Trading is a very important term for traders in the cryptocurrency world. Trading is considered to be a process that can bring profits in the short and long term. Crypto trading is usually carried out on exchange platforms where there are buying and selling transactions between crypto or fiat currency pairs. All trading processes require a lot of things to do about crypto. Everything must start with sufficient analysis and understanding so the main goals and targets can be achieved.
Swing Trading is a trader's strategy in carrying out a process that will bring short to medium term profits. Technical analysis is the key to successful swing trading. Technical analysis includes reading the crypto price chart over time which can be done in hours, days, weeks and months. Traders must be able to determine when to enter and exit the transaction process. All of this is very influential to bring profit. Good risk management is also needed to minimize losses. Trader's timing and decisions play an important role in carrying out swing trading.
Trading Plan
Trading plan is an organized summary that shows things and steps that must be prepared in carrying out the trading process. In this case I use https://www.tradingview.com in doing technical analysis of TRX/USD. The information and data presented here are very useful and helpful. I can view chart prices in time of the hour, day, week, month and year. I can see a chart pattern showing an uptrend and a downtrend. I can see the matching support and resistance lines. I can see the bullish and bearish phases of the market at different times. With all this, I can plan when to enter price, take profit and stop-loss.
Everything related to TRX/USD can be analyzed and studied so everything works properly. Important things to consider are the trading system, risk management, time management and trading rules. Plans indicating the what, when, why and how of crypto trading should be answered and well managed. Everything related to trading and crypto must be carefully prepared and executed accordingly. So the goals and targets will be achieved and successful.
Multiple Time Frame Analysis
Technical analysis using https://www.tradingview.com has given me more flexibility and options in observing the price of the TRX/USD chart. Here I use weekly, daily, and the 4 hours. With this time difference, various chart patterns will be seen. In this case, the use of multiple time frame has their respective functions and goals.
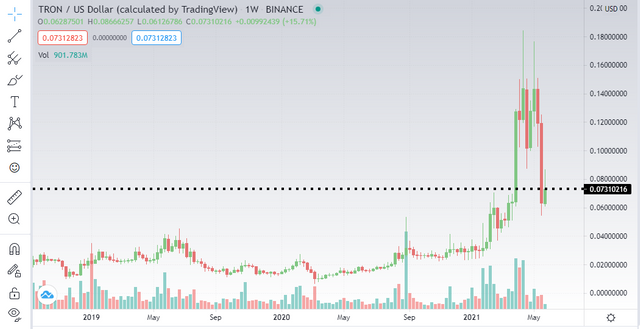
For long time analysis purposes and knowing price history I will use a weekly time frame chart to see how the TRX/USD price is changing each week. In the last candle TRX/USD price has increased slightly after the previous 2 candles had decreased very significantly.
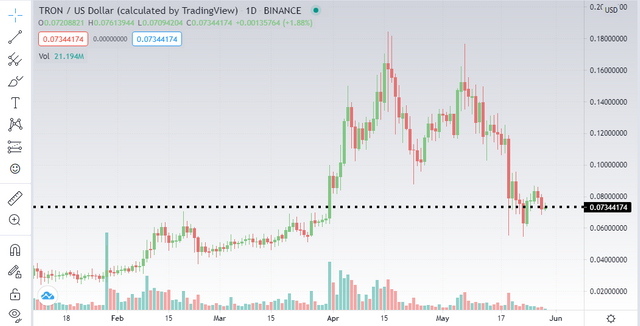
For the purpose of analyzing uptrends and downtrends that occur at unpredictable times I will use the daily time frame chart to see how TRX/USD price changes on a daily basis. In the last candle TRX/USD price has increased slightly after the previous 2 candles had decreased.
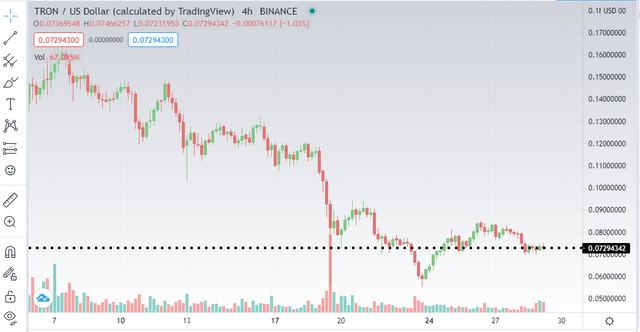
For the purpose of analyzing price movements that show rise and fall (in more detail) or high volatility I will use a 4 hour time frame chart to see how TRX/USD price changes every 4 hours. On the last candle TRX/USD price has decreased after 1 previous candle has increased.
Candlestick analysis and use of other relevant supporting indicators for your trade decision
To make the right trading decisions it is necessary to have a good technical analysis. Technical analysis can be assisted by supporting indicators that make it easier for traders to read chart patterns. Chart patterns with different timeframes are the key to timing the enter price, take profit and stop-loss. These strategies and methods are used by traders to get profit and eliminate losses.
Weekly Time Frame Chart
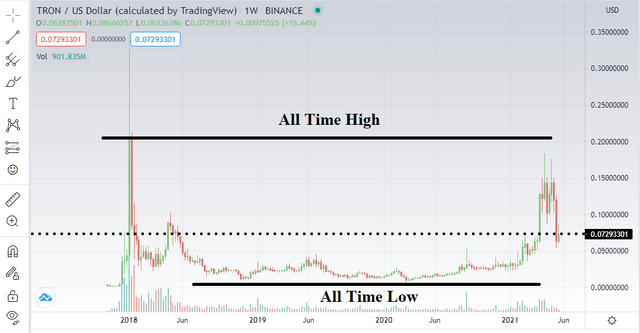
On the weekly chart, I can use the lines to determine the All Time High and All Time Low TRX/USD prices. This helps me to provide a broad perspective. According to the chart, All Time High TRX/USD was $0.2025 on January /1/2018. And All Time Low TRX/USD was $0.0059 on March/9/2020. The difference between this two is not too far away and is still considered normal.
Daily Time Frame Chart
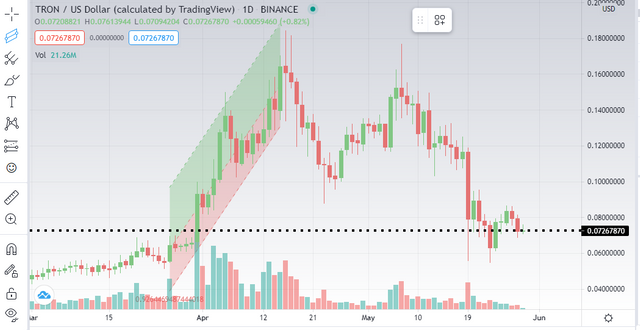
On the daily chart, I can use two ascending lines which merge candles to determine TRX/USD uptrend and downtrend in the market. This helps me to provide an intermediate or intermittent viewpoint. According to the chart, I marked only an uptrend. Uptrend started in price was $0.0553 on March/26/2021. This uptrend continued until the price was $0.1648 on April/15/2021. This uptrend lasted for 20 days. For 20 days uptrend was not fully increased every day, but there were also days that experienced a decrease.
4 Hour Time Frame Chart
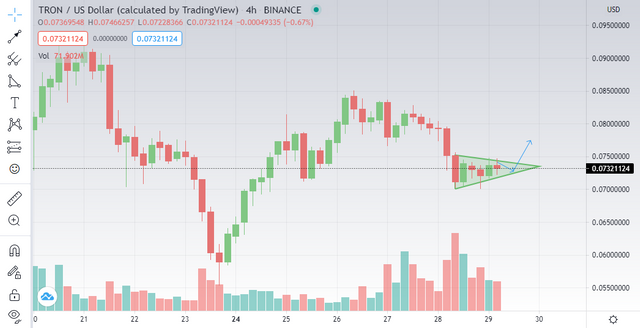
On the 4-hour chart, I can use the ascending triangle line to determine TRX/USD price in the next few hours. This helps me provide a more detailed price change. According to the chart, the previous 5 candles or in the last 20 hours TRX/USD price has increased slightly. Where TRX/USD price is now $0.0732. I made an ascending triangle which indicates that TRX/USD price will increase.
Trade management ( Setting stop loss, trailing stop and take profit)
In this trade I will wait and see the TRX/USD price movement in the next few hours. The uptrend has been seen a little and it's time to make the right decision. TRX/USD price now is $0.0729. I will enter the trade at $ 0.0833, will take profit at $0.0913 and $0.1170. I'll stop my loss at $0.0607. All the points I have taken are points of resistance which may occur in the next few hours. Stop loss is at a support point which is not too detrimental.
| Entry Price | 0.0833 |
|---|---|
| Take Profit 1 | 0.0913 |
| Take Profit 2 | 0.1170 |
| Stop-Loss | 0.0607 |
Note : I took a screenshot on https://www.tradingview.com for this post.
Thank you for the time and opportunity to develop the knowledge I have. Hopefully it will be useful for all readers.
CC :
@yohan2on
@steemcurator02
Hello @kavinsky7,
Thank you for participating in the 7th Week Crypto Course in its second season and for your efforts to complete the suggested tasks, you deserve a 7/10 rating, according to the following scale:
My review :
An article with good content in which you tried to analyze the price movement of the TRX / USD pair according to market situation and time periods. You had to rely more on technical analysis indicators to get many signals, which will allow you to analyze the charts in depth and effectively determine your trade management.
Thanks again for your effort, and we look forward to reading your next work.
Sincerely,@kouba01
Thank you prof!!