Steemit Crypto Academy | How to Create an Account on TradingView, How to Use Indicators, Tools, Features of TradingView | Homework task for @yousafharoonkhan
Hello All Steemians !!!
On this occasion, I will try to take a class at Steemit Crypto Academy. I am interested in joining this class because there are many new lessons that I will get here. I will do homework task from professor @yousafharoonkhan. Lesson discussion about How to Create an Account on TradingView, How to Use Indicators, Tools, Features of TradingView. Lets try...
1. Defining the TradingView site and how to register an account in tradingview? what are the different registration plan?
Tradingview is a very useful platform for traders and users in terms of providing charts, indicators, tools, data, information and all things related to all kinds of trading. The graphic display provided is very good and has high quality so it is very suitable to be used as a reference. This platform is very helpful and makes it easier for users to technically analyze all cryptocurrency pairs and other markets. This platform has many user accounts and has influence in carrying out trades.
Tradingview provides data and information in the form of excellent chart visualizations. Prices and candlesticks on the chart are constantly updated in real-time of all cryptocurrencies. This platform also offers indicators and tools with various functions to support traders in carrying out analytical strategies. It is hoped that with all the things that can be applied to the charts of a crypto asset it will provide profitable analytical results for traders and users.
How to register an account?
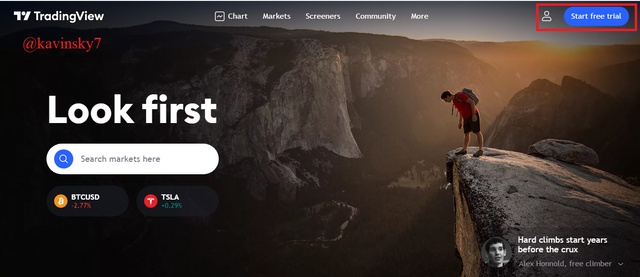
To register an account on Tradingview is that I select the free trial button on the main page.
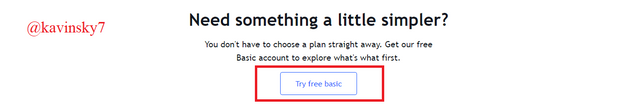
Tradingview will offer users several options, here I will choose a free account.
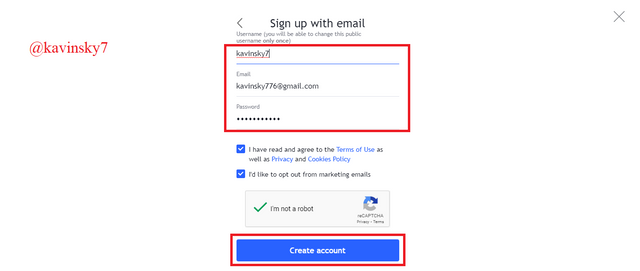
I choose the type of account creation, here I sign up via Email.

I have to fill in the requested data and information. Here I fill in the email address, password and verify the available steps. Then I chose to create an account.
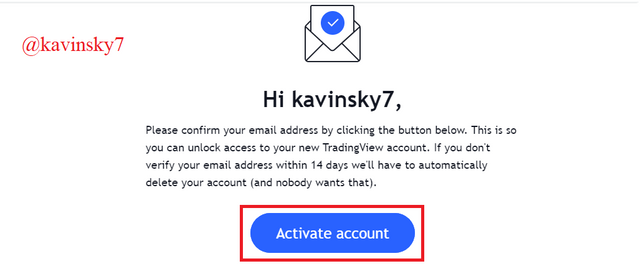
I have to open the email to verify it. The notification from Tradingview has arrived and I choose activate account.
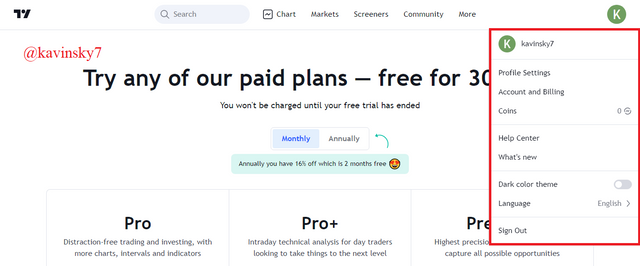
I adjusted the account details by filling in some information and my Tradingview account was created.
Registration Plans
Tradingview offers several other membership options which can enhance functionality and other benefits. The plan is as follows:
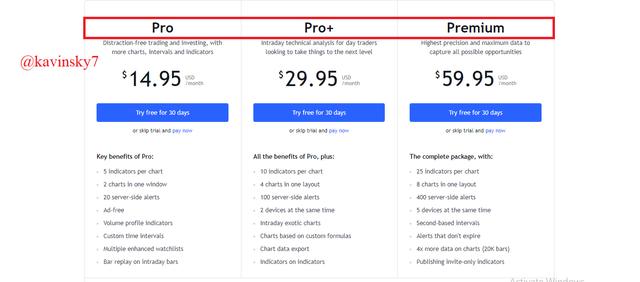
- Pro
The benefit is that it removes ads and allows custom timing. This option also offers 5 indicators per chart, 2 charts in one window and users can get 20 server-side alerts. The fee is 14.95 USD. - Pro+
The benefit is that it allows more indicators on the chart and data export. This option also offers 10 indicators per chart, 4 charts in one window and users can get 100 server-side alerts. The fee is 29.95 USD. - Premium
This is the most comprehensive plan and the benefit is that it allows setting the time frame in seconds. This option also offers 25 indicators per chart, 8 charts in one window and users can get 400 server side alerts. The fee is 59.95 USD.
2. Explain the different features of tradingView and what is your favorite feature and why?
The Tradingview feature is very useful for traders and users in terms of providing up-to-date information needed. These features can be found on the main page are as follows:
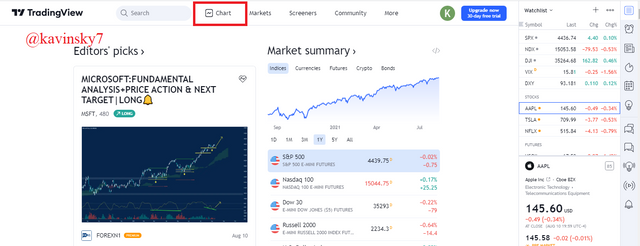
Chart
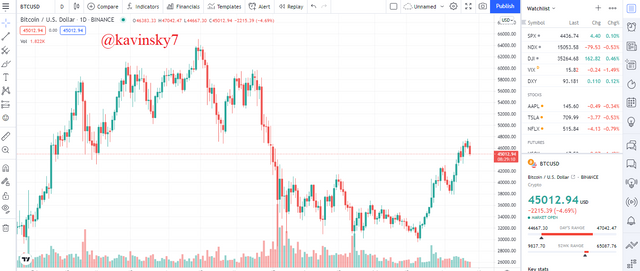
This feature is the one I use the most and is needed by all traders and users. All market charts are available here to help and simplify in terms of analyzing and monitoring crypto or other assets. The displayed chart allows support and additional various indicator functions according to the needs and strategies. This feature also provides charts other than crypto assets such as forex, commodities, and stock markets.Market
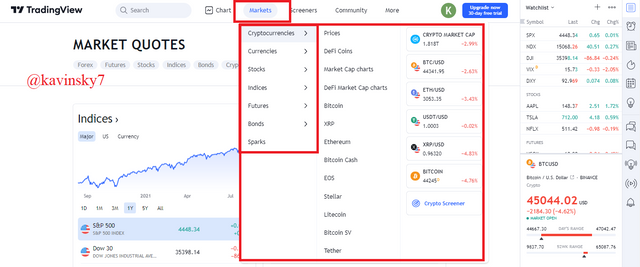
This feature is what provides all the latest data and information about the state and all matters relating to the market of all types of assets. The market will show all the latest movements and changes to help traders and users to monitor and take good actions. This feature provides information and data about Cryptocurrencies, Money, Index, Futures, Bonds and Sparks.Screener
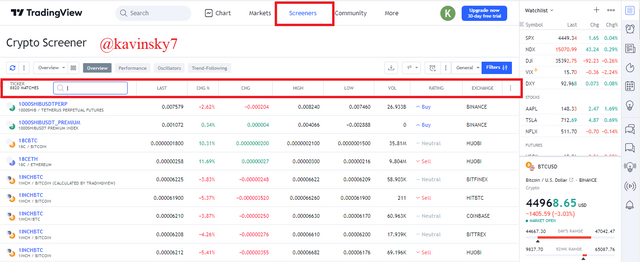
This feature is detailed data and information on all types of assets that are displayed simultaneously, making it easier for traders and users to observe their development. This feature allows saving time in conducting analysis and providing innovation about trading. This feature also provides filters for other than crypto assets such as forex, commodities, and stock markets.Community
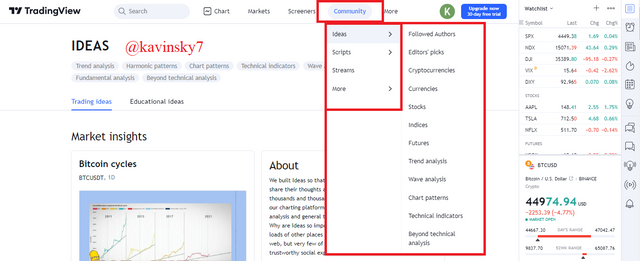
This feature is what gives traders and users the freedom and flexibility to express their opinions or share with all involved communities. Forums, opinions, articles, news, ideas, networks and relationships can be found and all things related to all types of assets can be discussed. This feature provides many options to explore and understand from various sectors which will increase knowledge and experience.
My Favorite Feature
Charts are my favorite feature. This is because charts are the features I use most often and really help me in carrying out cryptocurrency trading activities. The chart analysis that I can do through the Tradingview platform has given me a lot of advantages. I can do technical analysis of a crypto asset based on price, market trends, support and resistance, buy and sell order times, and all things related to trading activities. The existence of indicators and tools available based on their respective functions also really helped me in setting strategies that could bring profits and minimize losses in trading.
3. How to set up a chart in TradingView and use two tools to edit it?
Tradingview allows traders and users to set up charts according to their needs and convenience. Here I also have the display configuration. Actually Tradingview has many possible options to set, but I will explain some of them as follows :
At the top and left of the Tradingview display there are many options to choose from. All options can be adjusted according to your needs and convenience.
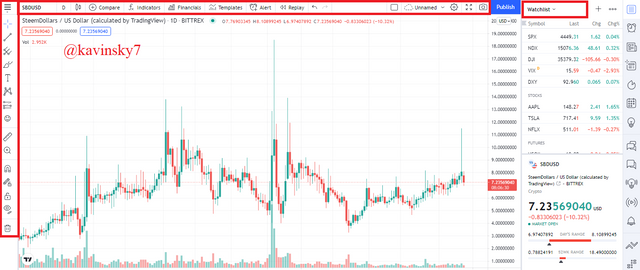
Chart setting can be done with many types such as symbol, status line, scale, appearance, trading, and event.
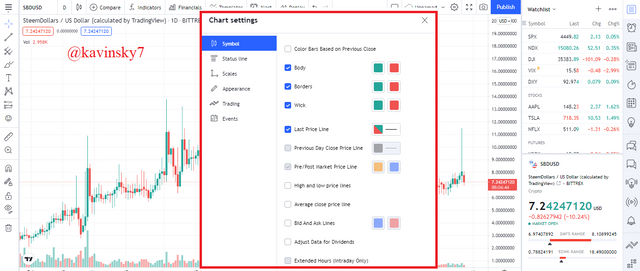
Setting of apperance is the most frequently modified. This can be done by selecting the settings icon at the top of the display.
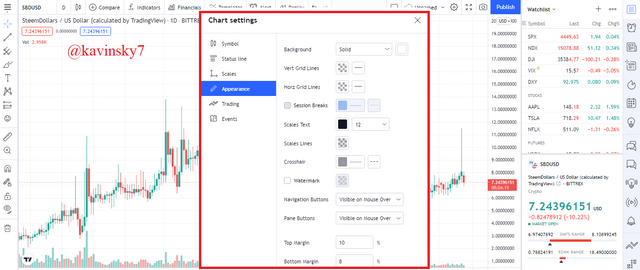
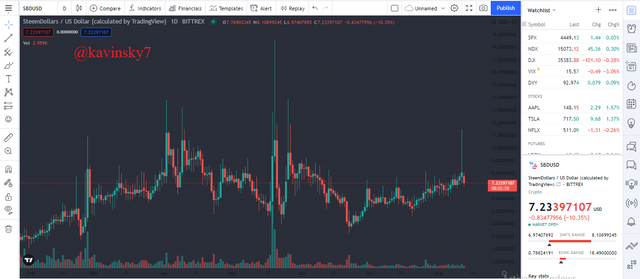
I can make a lot of modifications in terms of graphic display which I usually do. Candlestick color modification and chart background are examples.
Use Two Tools
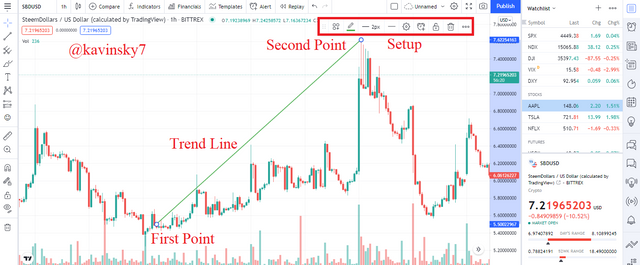
Trend Line
Trend line is a tool that many traders and users use to plot trend lines in the market based on price movements indicating an uptrend or downtrend. How to use it is as follows:
Click on the icon and select trend line.
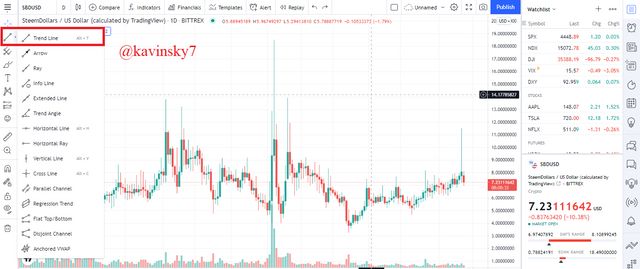
I have to determine the first and second points of the price of crypto assets on the market. The highs and lows of price indicating an uptrend or downtrend are good settings for analysis.
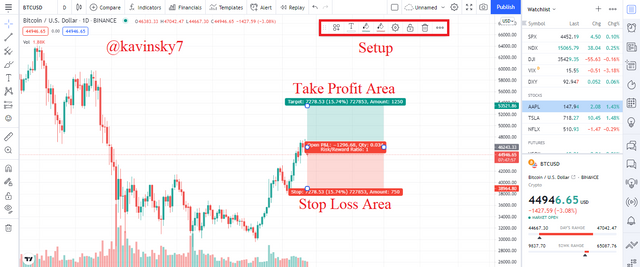
Long Position
Long position is a tool that many traders and users use to determine stop loss and take profit areas based on prices during an uptrend or downtrend. How to use it is as follows:
Click on the icon and select long position.
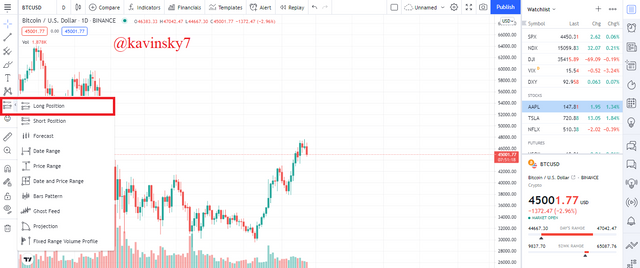
I have to determine stop loss and take profit areas of the price of crypto assets in the market. The point of support or resistance that is used as a reference to show a safe area is a good setting for analysis.
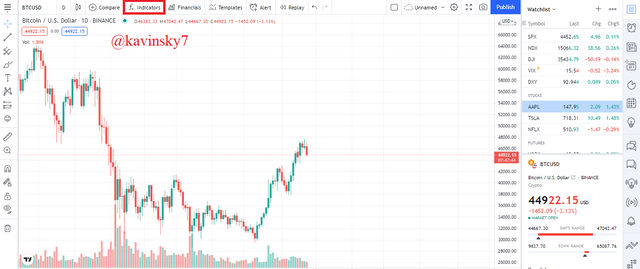
4. Explain how to add indicator in chart, what is your favorite indicator and why?
Bollinger Bands indicator is my favorite indicator because it is very useful and helps in conducting technical analysis before trading. Technical analysis of a crypto asset is greatly helped by this indicator which is an indicator of volatility. This indicator can determine the price points of resistance and support in analyzing market trends that show an uptrend or downtrend.
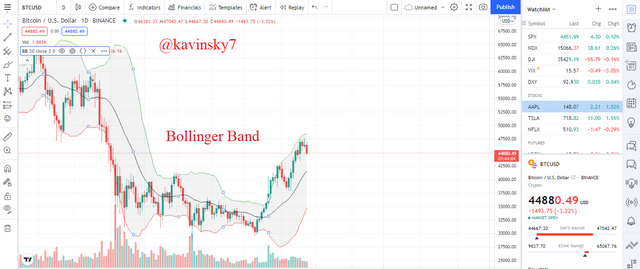
Bollinger Bands indicator shows 3 lines on the chart of a crypto asset. Where the top line is called the top band, the middle line is called the middle band and the bottom line is called the bottom band. Volatility is common in the crypto market. With this indicator, I can know the state of a volatile market. This is indicated when the band widens indicating increased volatility and when the band shrinks indicates lower volatility.
The middle line in a volatile market serves to provide an indication of the safe price in the middle, the price of resistance above, and the price of support below. Bollinger Bands indicator is best used with a 20-day moving average. This is very helpful for me in analyzing all possible good or bad things that happen in the market. It is hoped that the use of this indicator can bring profits and minimize losses.
How to add indicator?
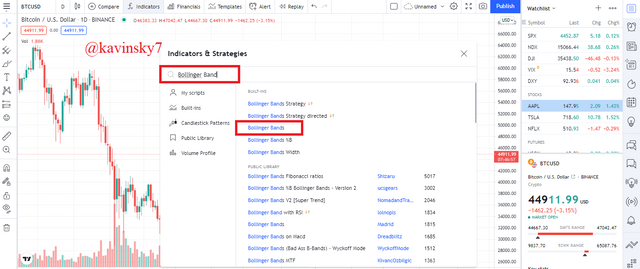
Click the "Indicator" icon right at the top of the graph view.
Type "Bollinger Bands" in the indicator search field. Several options will appear. I chose Bollinger Bands.
Bollinger Band indicator will appear in the form of 3 upper, middle and lower lines that follow the price movement.
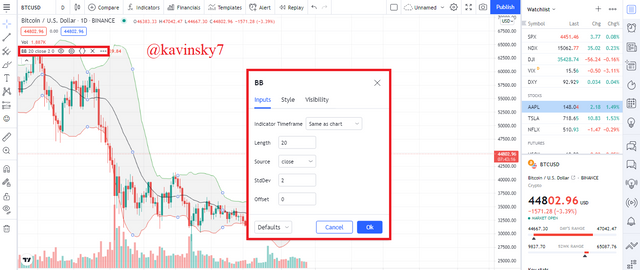
Click the Bollinger Band "settings" icon to set its parameters. Timeframe, Length, Source, StdDev, Offset can be set according to the best setting.
5. Do you think TradingView is useful in predicting the market for cryptocurrency (trend / price)?
I totally agree that Tradingview is very useful and helps traders in predicting market trends and cryptocurrency prices. Technical analysis has a very big influence in predicting everything that happens in the market. Technical analysis is often carried out for traders because it has more accurate results and provides good decisions. Predicting the trend and price of a crypto asset properly will bring profit and make trading successful now and in the future.
Several factors in the cryptocurrency market must be understood and analyzed such as market structure, market trends, price movements, support and resistance points, candlestick patterns, and others. These are all graphic elements that can influence everything that happens in the market and traders are expected to be able to analyze them well with the help of indicators and tools available on Tradingview.
TradingView allows traders to discuss and interact with fellow traders, both beginners and professionals. This can help traders expand their knowledge and experience so that they can improve their skills in analyzing and predicting a crypto asset. Traders can access forums, news, information, opinions, articles and everything related to trading that is useful and can help run good trades. Determination of buy and sell orders can be known based on the strategies obtained or based on the advice of many other traders.
6. Conclusion
Tradingview is an amazing platform and innovation that really helps many people to fulfill their needs in the world of trading. Trader's work is greatly helped and facilitated by this so that difficult things in trading can be handled properly. Tradingview has increased knowledge, experience and skills in carrying out technical analysis with all the features it provides. Until now traders rely heavily on this platform to carry out trading activities that can bring profits. It is hoped that the development of the trading world will continue to increase accompanied by other innovations.
Respected first thank you very much for taking interest in SteemitCryptoAcademy
Season 3 | intermediate course class week 7
thank you very much for taking interest in this class