Steemit Crypto Academy | Season 2 Week 4 Homework Post for @kouba01 - RSI
Hello everyone. Our world has been fighting a big epidemic for more than a year. I hope all of you are in good health. Stay healthy! Thanks for reading.
Today I will share with you the my homework given by the professor @kouba01

What is the RSI and How is it Calculated?
RSI, an oscillator, was created by J. Welles Wilder. The RSI provides information about overbought or oversold signals of an asset in the financial market.
RSI is one of the indicators most used by many investors in technical analysis. When RSI is added to the chart, it appears at the bottom. RSI can also be checked to increase the reliability of the formations formed on the normal price chart. For example, negative divergence is seen in SHS formation and positive divergence is seen in RSHS formation.
RSI is interpreted according to values between 0-100 and investors generally take 30-70 values as a reference. In terms of length parameter, 14 is generally taken as a reference, but 9-25 are also frequently used. So what do these referenced 30-70 values mean?
70+: If the RSI goes above 70, it is seen as an overbought zone. The RSI signals here that the price is overbound and a correction will take place soon.
30-: If the RSI goes below 30, it is seen as an oversold zone. Here, RSI signals that the trend will change, that is, the price will rise.
The formula for calculating the RSI value: 100 – (100 / ( 1 + H / L )
Suppose we set the length parameter as 14.
H = Highest day closures / 14
L = Lowest day closures / 14
The result of the H / L operation gives us the value of RS.
RSI= 100 - 100 / (1+RS)
In the RSI indicator, you can set the length parameter as you wish, but the shorter the length parameter you set, the more volatile the indicator will be.

Can we trust RSI on cryptocurrency trading and why?
RSI is a very important indicator, but we must know how to use it correctly. Using RSI alone can be risky, but if we use it with other indicators, it becomes an indicator we can trust. Using the RSI in a short length parameter can often give us false signals and mislead us. Because too many divergences occur in short parameters of length. Therefore, it is useful to use it with a longer length parameters.
In short, if we want to get the right signals and make a profit, we must use RSI correctly and support it with other indicators. However, we should not forget that there is no rule that RSI will always work correctly.
How do you configure the RSI indicator on the chart?
I use TradingView to read charts. I will show you how to add and use RSI to the chart through this site.
First go to the TradingView and click on the Chart above left on the home page.

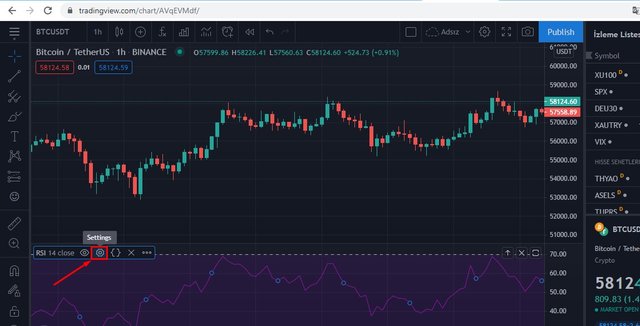
On the page that opens, click on the fx above. In the window that opens, type RSI in the search field. Click on Relative Strength Index from the results.

RSI has been successfully added to the chart. Now let's move on to the settings of the indicator.
Click Settings from the options of the indicator.
In the window that opens, we can adjust the RSI indicator according to ourselves.
We can change the length parameter here.
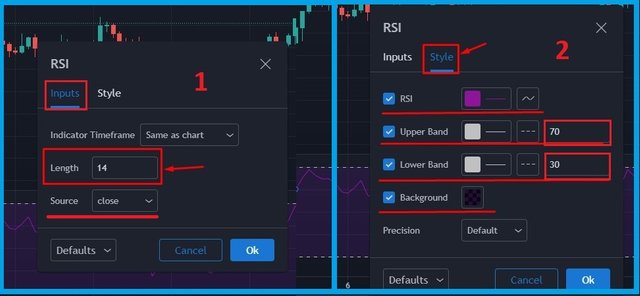
What does the length parameter mean?
When we determine the length parameter, we decide how much the RSI will be variable. How quickly it will react to the changing market candles is determined. The shorter you set the length parameter, the more variable the RSI will be. The default length parameter is 14. Used as 14 by many investors. But this can be changed.
Overbought and Oversold Signals
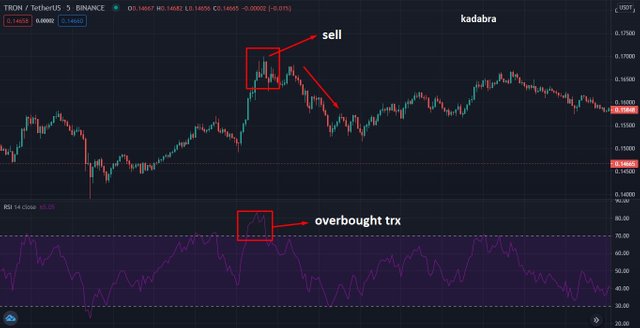
Overbought: When the value of the RSI indicator is between 70 and 100, it is called overbought. When the RSI indicator rises above 70 and above, it signals us that the value of the asset will decrease. The point I show in the chart has reached 80+ RSI and then it has gone into a downward trend.
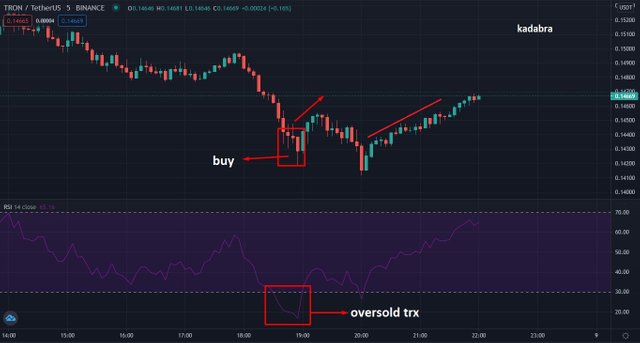
Oversold: When the value of the RSI indicator is between 0 and 30, it is called oversold. When the RSI indicator drops below 30, it signals us that the asset's value will up. At the point I show on the chart, the RSI has dropped to 15 and then entered an uptrend.
How do we filter RSI signals to distinguish and recognize true signals from false signals?
Bullish Divergence: If the price is going down on the chart but the RSI is going up, this is called the Bullish Divergence. It usually occurs at dips. It is a sign that the down trend will break and the uptrend will begin.

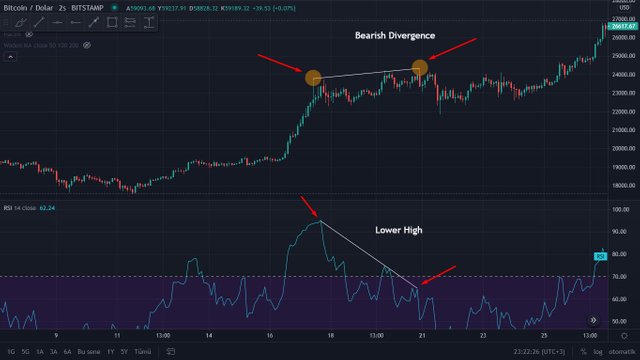
Bearish Divergence:If the price is moving up on the chart and the RSI is moving down, it is called Bearish divergence. It is the signal of breaking the uptrend and transitioning to a downtrend. Assets in this situation should not be taken. Short position can be entered in margin trading.
BTC/USD
When the RSI rises above 50, it starts to give a buy signal. When it goes above +70, it means an overbought zone. After this point, it is necessary to be careful. In the point I show on the chart, the RSI has reached the level of +85 and then it has entered a downward trend.
When the RSI downs below 50, it starts to give a sell signal. When it goes below 30 and below, it means the oversold zone. On the other hand, the RSI 30 shown in the chart gives us the signal that bitcoin will rise. After reaching the Oversold point, an uptrend started. Buying btc at this point bring us profit.

Conclusion
It is wrong to do only according to RSI in buying and selling. It just gives us certain signals. It is necessary to use it with other indicators. It is not guaranteed that it will always provide accurate information. For example, DOGE has a monthly RSI of 105. But it is still increasing rapidly. Still, I think RSI is an important issue and must be learned.
CC:
@kouba01
Hello @kadabra,
Thank you for participating in the 4th Week Crypto Course in its second season and for your efforts to complete the suggested tasks, you deserve a 7/10 rating, according to the following scale:
My review :
A good content article accurately demonstrating your understanding of the questions. For the last question, you had to analyze further price change by adding other signals and not just being oversold and overbought.
Thanks again for your effort, and we look forward to reading your next work.
Sincerely,@kouba01
Thanks professor