Understanding Trends 11 - Crypto Academy/S5W3 - Homework Post for @reminiscence01

Hello Steemians, I am happy for this 3rd week of the season 5 in the steemit Crypto Academy that just started.
I want to thank Professor @reminiscence01 for this wonderful lectures on understanding trends reversal through several methods.
I will be discussing the solution to the assignment below:

Trend reversal can not be over emphasized, this is to say that the price of an asset can trade in either directions, either long or short.
When we talk of long, it means a bullish trend while short means a bearish trend. As a trader, what you should try to understand is the reversal signal. This is an early signal that will tell you what the market will be in the future.
This will help you to know when the price of an asset is over bought or over sold because there will be trend reversal in the market. Note a trend reversal occur when the prices of asset/currencies changes directions.
[Source [(Trend Reversal)
The identification of Trend reversal can be seen in several phases and this is the key factors of sporting reversals before it occurs.
Below are the key factors:
Peak:
When an asset price is at the top/maximum, the volume of the asset will be larged, then as an experience trader, you should know that there will be a reversal in the trading pairs. This will help you to know when to leave the market and wait patiently for the reversal and a trade setup before you can enter the market by opening a position.
Expansion:
A general rising of Asset prices; when an asset is rising, you should know when the price will reverse through your technical indicators, price Patten, and candlestick formation.
Contraction:
When ever there is a contraction, in the price, or the asset begins to loose volume and the asset price begins to be bearish on the price chart, you should know that there is a reversal in trend.
Break of Trendline:
Trendline helps traders to quickly identify the price movement in a price chart. The Trendline serve as a dynamic support and resistance of price continuation in its directions. What you need to understand as a trader is, by using Trendline to do your analysis, once the Trendline is broken by the price, you need to understand that there will be a reversal of price either from bullish trend to bearish trend.
Double Top:
Bellow is an example of having a double Top in a price chart.
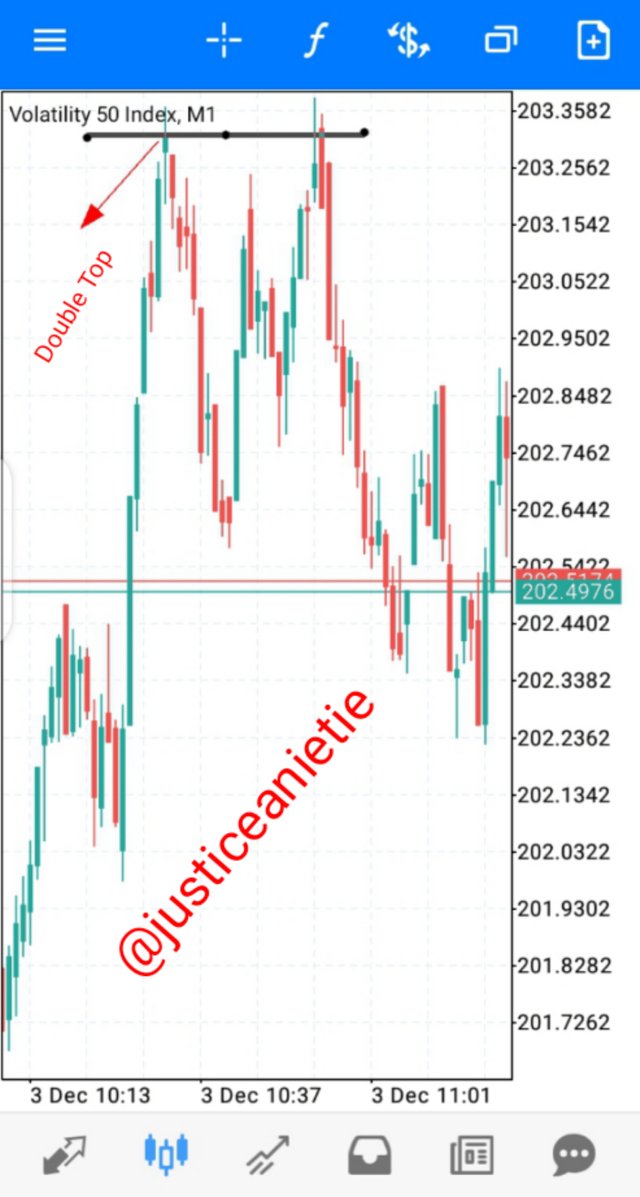
MT5 Chart
For a trader to make a good trading decision in terms of reversal pattern, the double Top is one of the most powerful trend reversal to identify and and make proper use of it.
Using double Top to making decisions for trading will help you alot because each time it occurs, it's always at it's peak.
The double Top is always formed during a bullish trend/market. You should always look out for price retracement to the previous high.
• The current price must not break above the previous price in the price chart.
• The Candlestick closing price of the second top must not be higher than the high of the first top.
Each time the price failed the create a new lower low than the previous low, a double bottom is formed. This means the the price is retesting the previous low without breaking below it. At this point, it indicate weakness of sellers to keep pushing prices down.
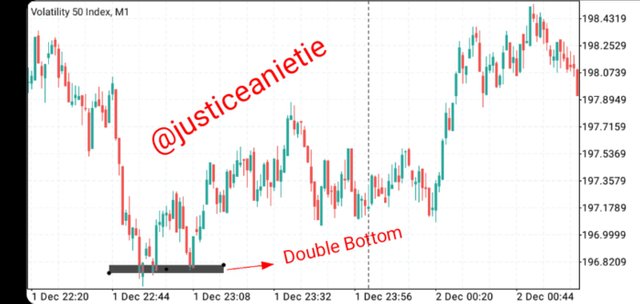
From MT5 chart
• Price most not break below the previous low
• The closing price of the second bottom must not be lower than the low of the previous bottom.
Fake reversal signal can be avoided through the following ways:
√ By creating a clear image of the overall trend.
√ identification of true elements of a Trend through candlestick formation.
√ for you to avoid fake signals, always wait for the market to come to you.
√ You should have an entry point, candlestick formation and other indicators must have showed you when to enter the trade.
√ Always make your graphical analysis patterns for the opening positions of your trade.
[Source](avoid fake reversal)
2.Give a detailed explanation on the following Trend reversal identification and back up your explanation using the original chart. Do this for both bullish and bearish trends (Screenshots required).
a) Break of market structure.
b) Break of Trendline.
c) Divergence
d) Double top and Double bottom
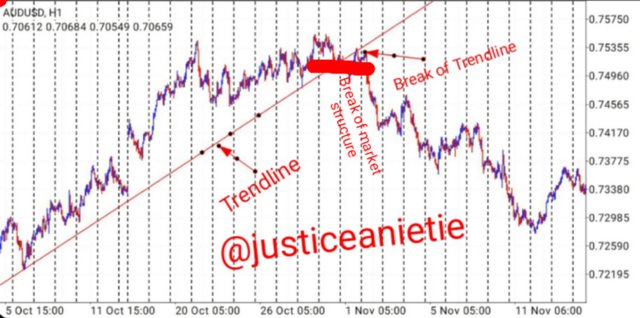
a) Break of market structure.
When the market structure is broken, it means that the price no longer moves in its direction. According to the lesson, I am made to understand that when the price no longer makes a higher highs and a lower low, it shows the inability of the price to keep pushing in that direction of the trend.
When such occur in the market, it signal a Trend reversal which is a confirmation of breaking of price below the previous low for a bullish trend and a break of the previous high for a down trend.
Note: the break of price shows transfer of control from the sellers and this is the beginning of a new down trend. So as a trader once this occur, please close all your buying position and wait patiently for the reversal/setup of the trend, before you can go short.
b) Break of Trendline:
Trendline help traders to determine the direction of price movement on the chart. This technical tool is very essential for trading. Trendline serves as a dynamic support and resistance for trading.
Most investors uses the Trendline to analyze the market, then wait for the price to come to the Trendline which serve as a support before you can take the trade.
When Trendline is broken by price, it shows a strong reversal signal and this is when you should make your decision as a trader by either going long or going short in the market.
The below chart shows a break of the Trendline, which signify a down trend.
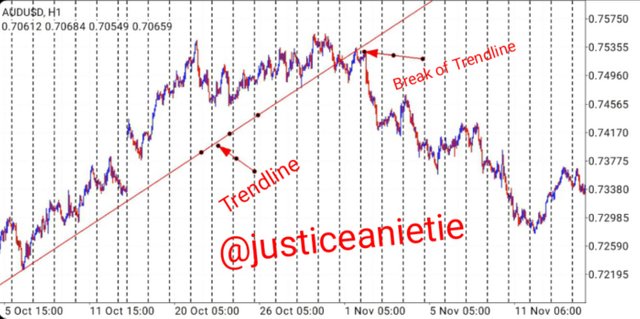
I will recommend 1 hour/4 hours time frame to be used in trading when using Trendline.
c) Divergence:
Looking at divergence, you will see that it has stronger signal because it combines price action with an indicator.
This only takes place when there is a combination of different indicators with price action.
Divergence shows what the price will do in future through an indicator and this helps the traders in making early decisions in their trading.
Bullish Divergence:
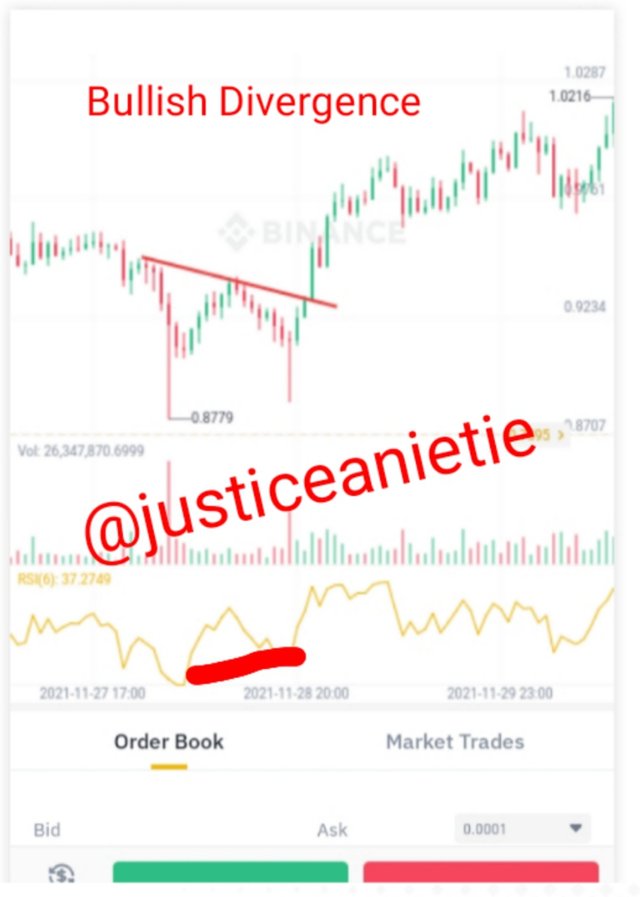
Screenshot of Reversal of price to uptrend
When the price makes a new lower low, but the indicator makes a higher high, this indicate a weakness and shows a signal of a new reversal in trend from a bearish trend to a bullish trend.
Bearish Divergence:
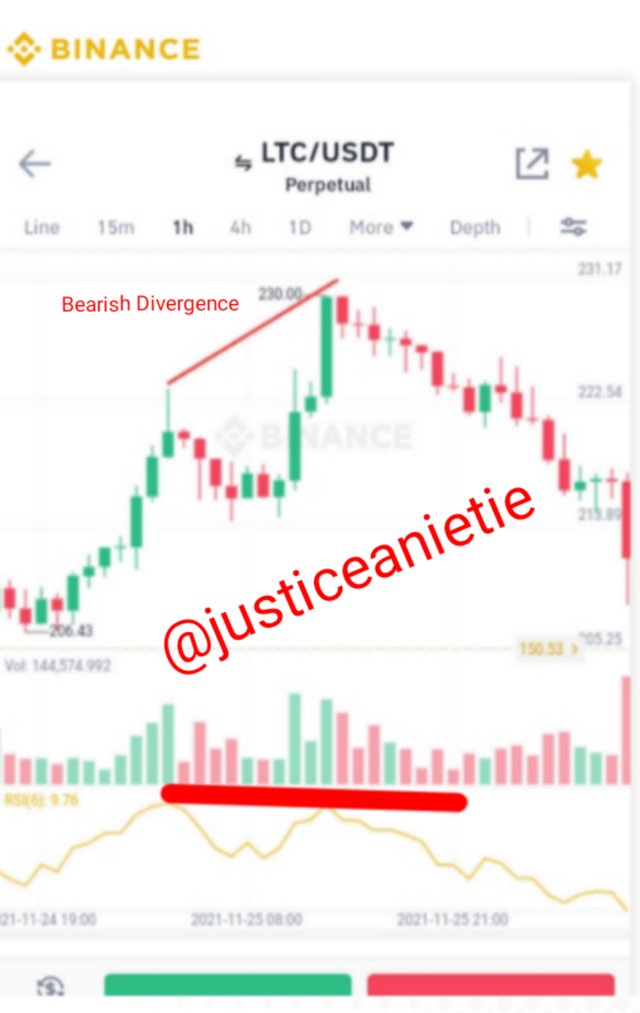
In a bearish divergence, we will see that the bulls/buyers are loosing their grip on the market, this is because the bears/sellers have taken over the market. This creates a potential downtrends when prices rally to a new high while the RSI/indicator is going the opposite direction.
Double Top:
Double top is always identified in a bullish trend. This happens when there is retracement in price, then the price goes up to retest the previous high in which it has reach before. At this point, it is assume that there is a strong weakness in the strength of buyers to take the price up. This will cause a trend reversal in price to the down side and it can encourage trading decision.
The following must be put in place before a double top is considered:
√ The price must not break higher than the previous high point.
√ The second top closing price must not be higher than the previous top.
Double bottom:
Double bottom are always created at the down trend. Here the price could not break the previous low. This means, the current market price on the Candlestick could not close lower than the previous low.
Here, sellers could not push the price downward so the bulls takes over and a new trend is created or formed which signified an up trend.
Criteria for double bottom:
√ The closing price of the second bottom must not be lower than the low of the previous bottom.
√ The price must not break below the previous low.
I will be using trading view to place my Demo trade using double bottom reversal pattern.
Below is the chart from trading view.
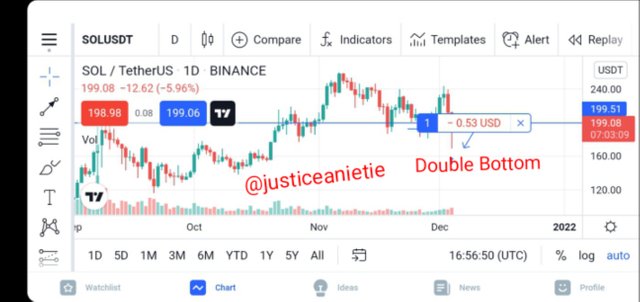
Tradingview
Am using Double Bottom as one of the reversal pattern.
The blue line is the entry point and it is a buy trade.
Entry point: 199.51
Crypto pairs: SOL/USDT
For taking a buy trade, it means am buying SOL.
As a trader, you are expected to put your Stop Loss and take profit. The Stop loss will help to close the trade if the market go against you. While if the price reaches your TP, it will close with profit.
The content of this post will help a trader go a long way in determining trend reversal.
As a trader, you can use double bottom, double top, Trendline to enter a position in the market.
For you to have a strong signal, please you should combined it with technical analysis together with price action.
Thank you for your time from @justiceanietie
Hello @justiceanietie , I’m glad you participated in the 3rd week Season 5 of the Beginner’s class at the Steemit Crypto Academy.
Unfortunately, you are not qualified to participate in this homework task as you haven't powered up to 150 Steem in the last one month.
Remark: Homework Task Disqualified
Prof. @reminiscence01 I have no reward for longtime now. The steem transfered out was sourced.
Please permit me to be setting my reward to 100% Power Up!
I wish i can help. This is a requirement to participate in the homework task and the standards must be respected.
Ok. Pls how is my work? Is it okay?