Steemit Crypto Academy Contest / S4W1 - Crypto Market Technical Analysis by @justiceanietie

Hello great people of this community, i am happy for this new session 4 that has just began. I trust we all will be happy in this session. I will be discussing on Crypto Market Technical Analysis and this can be seen below:

How would you define Technical Analysis in the Crypto ecosystem? Mention its Importance.
When we talk about technical analysis, this can be seen as a trading guide or discipline which gives a trader a statistical patterns in order to make gain from trading the Crypto market. This might involved the movement of price volume and looking for trading opportunities by assessing investments.
For a trader to utilize various charting tools, he must have the knowledge on how to analyse the market through technical indicators. As this will enable the trader to have a dept of knowledge about the strength of the assets been traded.
Note, this analysis can only take place for assets that has primary trading data. Example: The Crypto market, equities, futures, currencies, commodities etc. When we talk of technical analysis in the Crypto market, just know that the same idea can be apply to other assets.
When a trader has a trading criteria and a based knowledge on technical analysis, we can say he has statistical edge over the market in a long run. This is because when you follow your rules in a long run, you stand the chance of gaining more which covers the loses made.
• Technical analysis help a trader to know the current movement of the trend.
• Technical analysis give a trader an edge over the market.
• It helps us to know the right time to place our trade or to open order/close order in the market.
• It helps us to have and developed several trading method.
• It helps in removing confusion from supply and demand of an asset which would have affected the price or volume when this tools are used. The indicator helps in giving directions on where the trend is heading to.
• Using the historical price action: the used of technical indicators makes it much easier for a trader to identify an existing trend pattern which will still occur in the future.
• It helps traders to combine different trading indicators to know the trend direction.
Some of these technical indicators can be seen below:
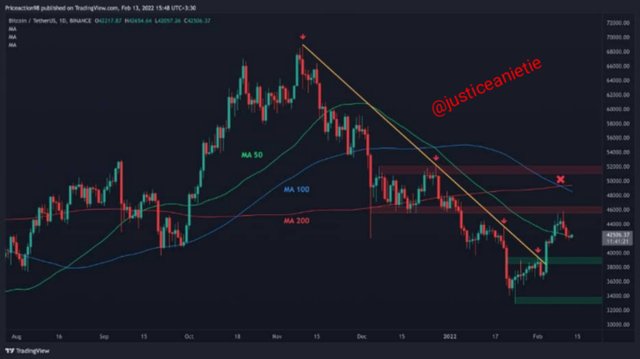
The Bollinger Bands, Moving Average(MA), Trendlines, Relative Strength index (RSI), MACD Etc.
A screenshot from my MT4 is seen blow.
Do you have practical knowledge of how to conduct technical analysis? Highlight some of the components of Technical analysis.
As a trader who has acquired some knowledge about technical analysis, the first thing i do is to check the trend of the market from the higher time zone. This can be from my 4hrs time frame before i will move down to 1hr time zone. But my trade is always executed using the 15 minutes time frame.
Here i can make use of my trendlines, as this will help me to spot support and resistance level and once this trend line is broken, i will then go to my lower time frame and wait for possible entry to the market.
I can also make use of moving average cross over inline with the MACD cross over to take my trade and also following the market trend and making sure i have higher highs and higher lows when bullish and making sure i have lower highs and lower lows during a bearish trend.
However, the major components of technical analysis can be seen below:
1.Charts
2.Indicators
3.Overlays
Charts are one of the key components of technical analysis, and we have different types of charts which can be used to execute a trade and this can be seen below:
Line Chart
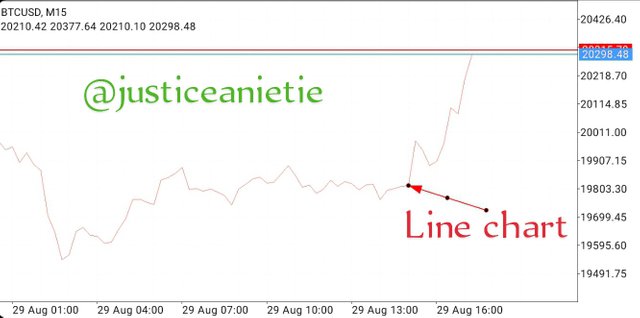
A line chart is gotten when the closing price for a given period of an asset is been connected together.
Bar/OHLC Chart
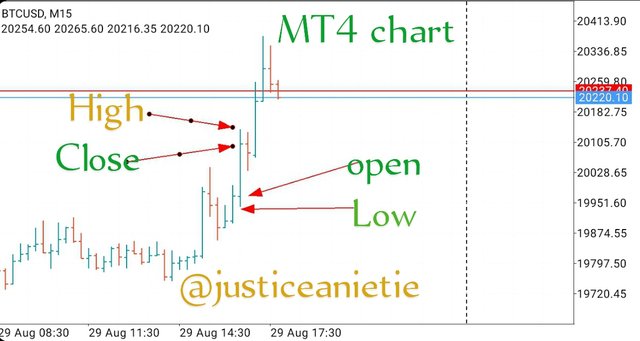
The Bar chart is also known as OHLC chart. This is gotten using the high, low, open and close price within a given period of time. The chart presentation is for a bullish OHLC chart while the reverse is for a bearish OHLC chart.
Candlestick Chart
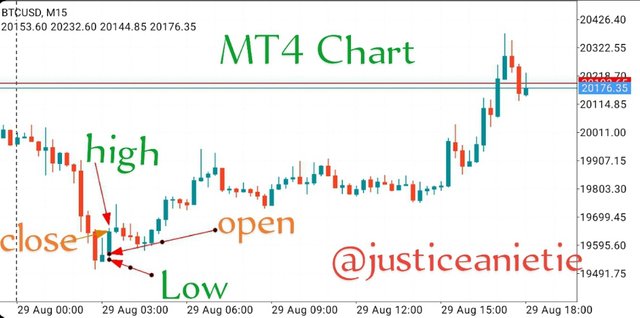
Candlestick is the most used chart because of it simplicity. It also has the features of High Low, Open, Close. Here the bearish candle is always red while the bullish candle is green. Note you can change the candles colour to suit you.
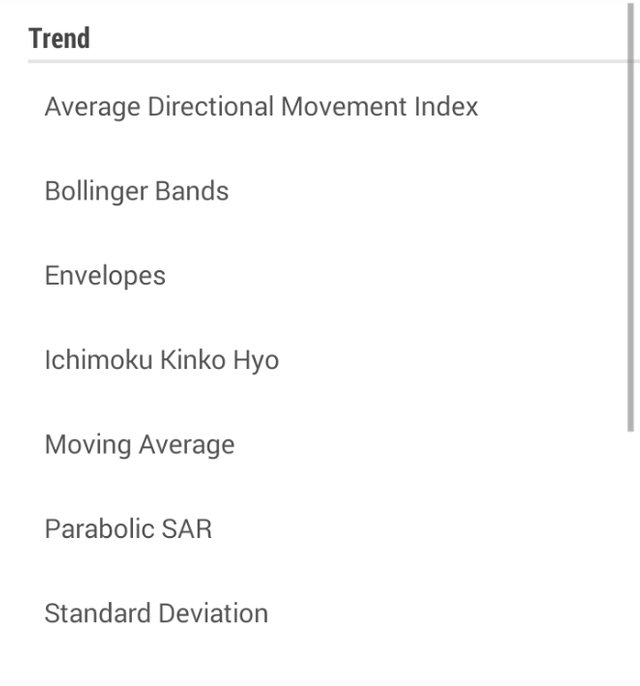
Indicators are used by traders to identify momentum/trend of the market when we talk of technical analysis. Some of these indicators can be seen below:
Stochastic Oscillator
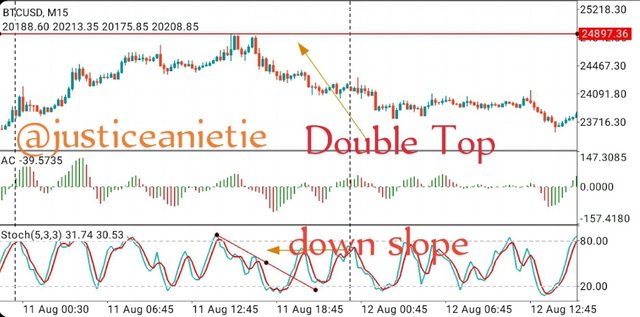
MT4 Chart
This indicator help in identifying the turning point of an asset price and this is identified through the divergence observed between the price chart of this indicator. However, this is identified when we have a double top in our price chart while the oscillator is currently showing us a downward slope. Here a trader can go short / open a sell position.
Overlays uses the same scale which are also used on the major price chart. An example of overlays is Bollinger Band as we can see below:
Bollinger Band
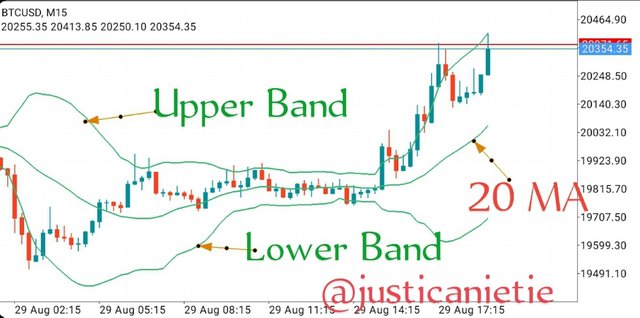
The Bollinger band allows us to measure the highness/ lowness of price which is compared to the previous trades. This indicator make use of moving average as well as standard deviation in calculating the band.
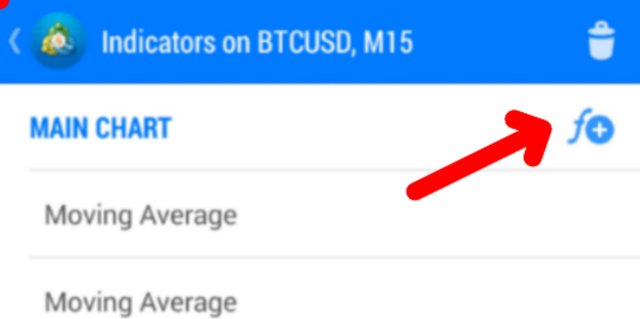
What do you understand by technical indicators? Do you consider them effective for trading cryptocurrency? Which one is your favorite and how does it work? (Screenshots required where necessary)
Technical indicators are tools which assist traders in analysing the price chart of Crypto market. Here traders make use of those tools like the trendlines, Bollinger band stochastic Oscillator, MACD etc.
This indicators helps' the traders to know the direction of the trend and equally give momentum.
Note; these indicators are not 100% reliable, so you should know more about the market structure, higher highs and higher lows is very important in a bullish trend, before opening a buy position in the market.
This indicators may sometimes fail you if you rely on them so you need to do your top down analysis together with the candlestick formation and the trend.
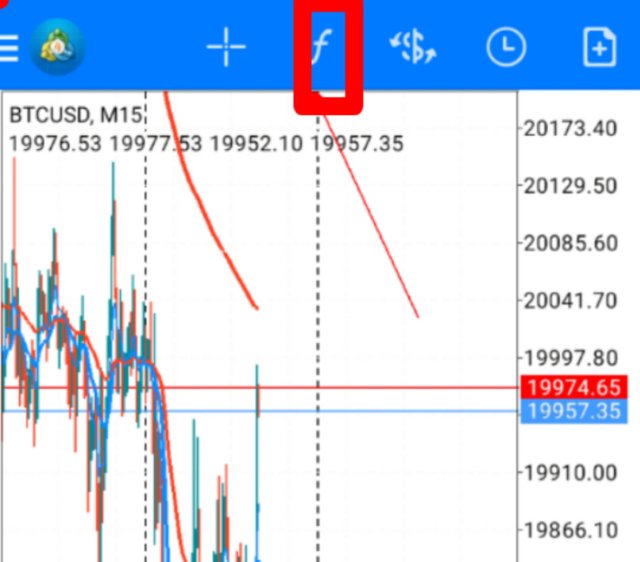
Of all the indicators, i like using the Bollinger band. Here the price must be at the lower band and a bullish candle closes above the lower band before i can go long. But that a lone does not guarantees' success in the trade. I will make shaw there is a certain candle formation like the pin bar or a bullish engulfing candle formed at the lower band before i can take the trade.
An example is seen below using BTCUSD
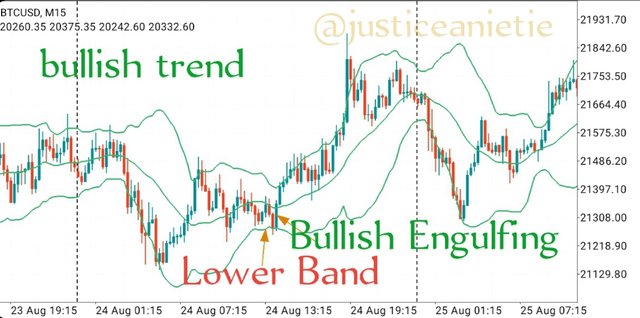
Once the bullish engulfing is formed, place your buy stop order and catch the trend up. The reason why i like using the buy stop order is because; if the market did not continue on the upward direction, you can cancel the order and wait for another entry.
Highlight the advantages and disadvantages of technical analysis. What's your advice to anyone about it?
| Advantages | Disadvantages |
|---|---|
| 1. All the information needed by traders concerning technical indicators are already in place. | New traders might find it difficult to identify these indicators |
| 2. It gives traders direction to follow the trend | the trend might be misleading. |
| 3. Technical analysis help traders to carry out chart analysis before taking the trade. | if the market go against the analysis, it can result to great loss. |
| 4. Traders can use past performance of the market to predict the future outcome. | It rely on past performance and we all know that this does not repeat it self exactly and because price actions are not certain, this might be misleading. |
| 5. It can be used to analysed different markets | Some of these indicator might not be accurate when apply to different market thereby not producing accurate result. |
| 6. Technical analysis is been used by majority of users. | Many traders don't apply indicators in their chart. This is because it makes the chart looked confusing. |
| 7. You can make use of the indicator which you understand best. | If things does not go well, this indicator will not give us the information. |
| 8. Understanding technical analysis will give a trader an edge over the market. | Many persons are not used to graph and numerical values, so it might not be suitable for everybody. |
I will advised that you should not try to be a master of all the indicators but try and master one or two of it and try to learn price action as this will help you to be a better and favourable trader in a long run.
Technical analysis is important when you have an idea on how to make proper use of it. You have to do your top down analysis from the higher time from, then go to the lower time frame and execute the trade when all your stars have alined.
Thank you for your time.
Hello @justiceanietie
Very good post, I like the simplicity you use to explain the points. Easily understandable.
I think you give a good overview of what technical analysis is, its advantages and disadvantages.
Thanks for your credit i really appreciate your time.
Greetings friend.
As you say, although technical indicators are not 100 % reliable, it helps us to better understand the market. One of my favorite technical indicators is similar to Bollinger's bands, but this is called Dochain channels.
Wao! I have not heard of Dochain channels as an indicator but since you have made me to know about it, i will make findings. Thank you for sharing such a great idea.
Nice analysis by you.Do you that you have really explained this so well that i can teach someone about crypto from this .
Oh thank you very much for you comment i do appreciate your effort.
I must say that you are an experienced trader. Using Meta4trader has shown it all. Yes I agreed to what you have said about the important of TA. It actually helps traders to know the current movement of a trend which I myself have witnessed it several times.
Thank you for the information you have shared. Best of luck.
Thank you for your time, i sincerely appreciate you.
What more do I have to say than voice out a big Weldon to you
You're an expert at your work, while going through your post I was kinda cracking my brain on some aspects, will you please teach me more??
Lol 😆 my dear you are free only if you wish to, then i will.
Thanks.
Ohhhhh, thanks
You can chart me up
08061556125
Your post made me conclude that you have been in the cryptocurrency market for a long time. Such a detailed publication requires some level of expertise.
As you indicated in your article, indicators are not always 100% reliable but they are "pointers" to what is obtainable in the market when other factors remains the same.
Generally, that was superb! Keep it up.
Thank you for your encouragement i sincerely appropriate your time.
Good point stated, when you faint have techno analysis you can’t trade with cryptocurrency unless you depend on market sentiment lbs to mark you positions which would take a very long time to have such opportunities.
Yeah, it’s always advisable to apply your strategy on higher timeframe to identify general market trend before opening position with smaller timeframes.
Well, Bollinger band is a volatile indicator that projects in the direction of price. The only issue is that it can’t be solely reliable and have to be combined with different indicators.
Please find time to visit my post as well. Good luck!!
https://steemit.com/hive-108451/@sadiqxylo/steemit-crypto-academy-contest-season-4-week-1-crypto-market-technical-analysis-by-sadiqxylo
Good evening friend
This is an awesome feature, because it uses existing experience to predict future trend, I like this trend because it's has fetched so much positive results when it comes to the predictions of crypto market.
Thank you very much for sharing
wishing you success