SEC S18-W4 || Mastering Liquidity Levels in Trading
Complement of the hour of the day to you. I'm happy to participate in this topic "Mastering Liquidity Levels in Trading"
This is an important lesson that will sharpen the understanding of traders and make them know where the liquidity is and the opportunity to buy and sell in the Crypto market.
This will be discussed below using the contest guide:
| Describe the concept of liquidity levels in trading. Why are they important for traders? What indicators or tools are used to identify these levels on a price chart? |
|---|
We have what is called demand and supply levels in the Crypto market. Relating this to the liquidity levels in trading, we can say it's the point or level where traders place their buy/sell orders at the lowest/highest point of the chart and wait patiently for the price to return to that zone. This zone can be seen as the golden zone. However, when there is high demand for a particular asset in the market, there will be liquidity in the market and this will help the price of the asset to increase rapidly.
At this point, there will be efficient trading where traders can buy and sell their assets very fast at market price.
The importance of liquidity also facilitates efficient trading. It also allows traders to exit their opened positions on time, thereby minimizing the risk in the market.
Moving forward in identifying the liquidity levels on the price chart, some indicators can help us to identify these levels
• The Volume
• Support and Resistance level
• Brack of market structure and retesting the zone.
• A retest on a Trend Line at the support or resistance level.
• Price retesting the Moving Average at support or resistance levels with the formation of an Engulfing candle.
• The use of Fair Value gap, Order block, and Fibonacci Retracement to 61.8 levels.
| What is a fakeout in the context of liquidity levels? Explain why and how traders are often trapped by fakeouts. |
|---|
Fakeout in the context of liquidity levels refers to a situation where the market price breaks a particular demand or supply zone as traders rush into the market for a new direction of the trend but the price reverses to its original direction. Note the market makers know that a lot of open orders are in that zone, so they will push the price higher/lower to take out those orders. At this point, retail traders' stop loss will be hit while others can close with a loss as the price reverses back to an opposite or original direction.
| Describe an effective strategy for trading liquidity levels correctly. What signs or confirmations should traders look for before taking a position based on a liquidity level? |
|---|
In trading liquidity levels correctly, there are a few things we need to consider as traders before taking the trade:
• Avoid being caught in the liquidity: Here once the price returns to the demand zone and breaks it to take the stop loss, it means retail traders have sold their position and since they don't have enough power to push the price lower, the market will reverse to its opposite direction.
• Aim to enter where the institutional volume does: This means we should wait for the liquidity sweep before entering the market to grab the big move back to its original direction.
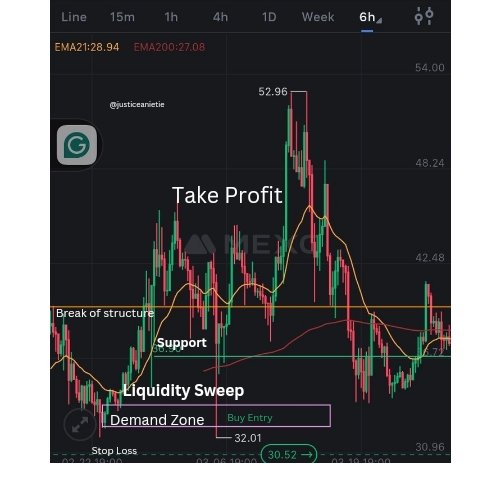
To really know when to enter your trade using liquidity levels, you have to pair your trade with Supply and Demand which is what makes the market moves up and down.
At these zones, we have consolidation before seeing the price have a big move either up or down.
Allow the market to trade into the demand zone before placing your trade. This is where the institution traders buy from. Note, that if you place your order at support, you will be kicked out.
Pairing the liquidity concept with supply and demand is an effective strategy for trading liquidity.
| What are some tips and techniques to avoid fakeouts when using a trading strategy based on liquidity levels? Give a concrete example with detailed steps. |
|---|
For a trader to avoid fakeout, you must be disciplined and keep emotion away from trading.
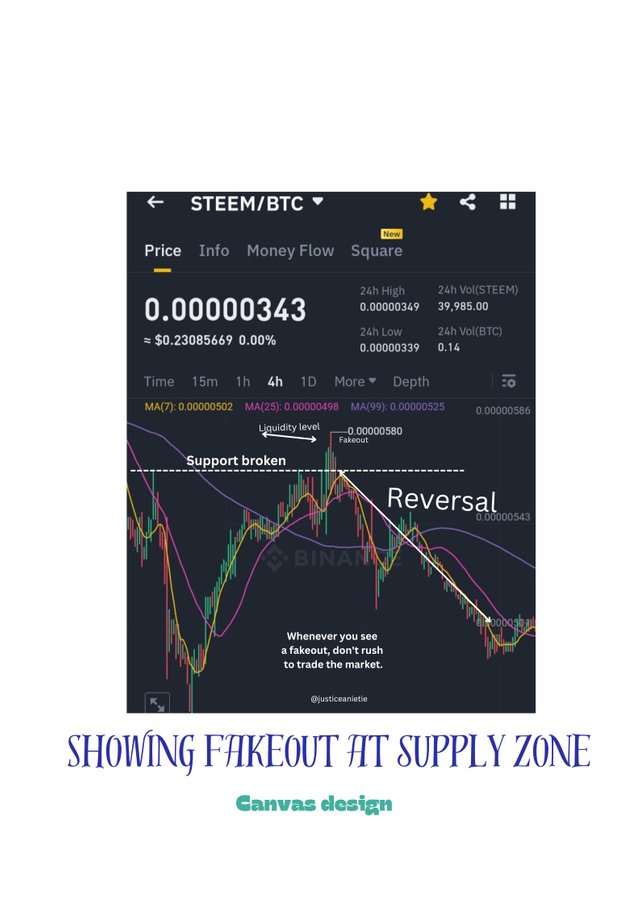
Once a support or resistance is broken, don't enter the trade immediately always wait to see the outcome of the trend.
Always look at the left-hand side of the chart to find the demand or supply zone.
Place your buy/sell Entry at your demand/supply zone and stop loss below the zone. This zone is also identified as liquidity level.
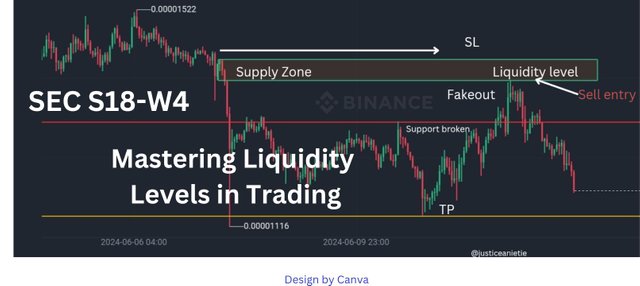
The chart above is showing a supply zone which represent a sell entry
The higher the movement of price from our supply and demand zone, the greater the chances for strong fakeout.
The wick of the candle also represents the strength of the fakeout. The smaller the wick, the lesser the fakeout while the longer the wick the higher the chance of fakeout.
You should know the trend of the market whether it's bullish or bearish.
| Analyze a chart of a crypto asset of your choice, including the Steem token, to identify liquidity levels. Describe a potential trade based on these levels by explaining your reasoning and the steps you would take to enter and exit the position. |
|---|
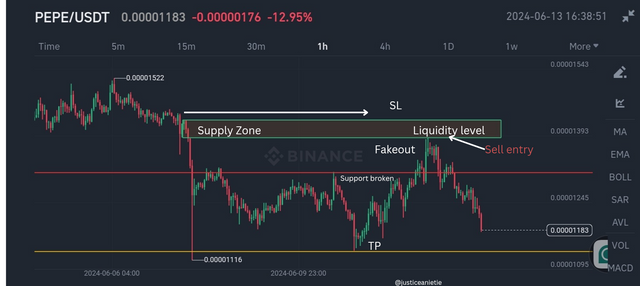
This is a chart of PEPE/USDT. Looking at the chart you will see it's a sell market because it's making lower lows and lower highs.
The market traded downward and created a support which the market had respected that area over time but because at that point there were lots of sell orders which is opened there, the market traded above that level and takeout all the stop loss which placed above that level up to the supply zone/liquidity level.
Since there is no buying strength in the market, those stop losses became fuel for the market to push downward as seen in the chart.
Once the market comes to the supply zone, that zone is your golden zone to enter the market by opening a sell position. Your take Profit should be at your lowest low as indicated in the chart.
Note, the liquidity zone is where the big traders like banks and hedge funds reverse the market. That is also the supply zone.
Having the knowledge of identifying the supply and demand zones in the market is of great importance.
When you have this knowledge, wait for liquidity to sweep through the support.
Place your buy/sell entry at the demand/supply zone.
Close your trade at the highest high or low.
Reading through this post, you will have a fair knowledge on how to identify liquidity levels in combination with the supply and demand zone. Thank you for your time.
My X post
https://x.com/AnietieJus27278/status/1801299690345893983?t=6d3rwKRDXIfsk3DUVOaRJQ&s=19
Nice information on liquidity levels . The institution traders are the big player, we never know when they create hype in the market. Keeping emotions away is must needed, we should not think that market will move accoding to us, intead we need to understand the market.
Yes that is true about the market. That is why there is a saying that you should not use money for house rent or school fees for trading because the market is risky However, having a fair knowledge about the supply and demand zone in line with liquidity level make you an outstanding trader.
Thanks for your comment.
@justiceanietie This is a great explanation of liquidity levels in trading! Understanding where the big players place their orders is crucial for making smart trades. I appreciate the detailed breakdown of indicators and strategies especially how to avoid fakeouts. Pairing liquidity levels with supply and demand zones makes a lot of sense and can definitely help traders make better decisions. Good luck with the contest!
Thank you very much I do appreciate your time for reading through. I'm glade you found value.
Hello dear @justiceanietie 😊
I read your post you explain about effective strategy of trading it's interesting point ..I have also participated in it because it's really informative contest .
Best wishes 💞
Thanks for your encouragement in joining this contest. When we join to do contest like this, it gives us more ideas and information that will help us in executing effective trade.
Once again thank you and I'm glade you found value. Wishing you all the best.
Greetings @justiceanietie,
It's like a sneaky move by the big players in the market, right? When they push the price to hit all those stop losses and then reverse it back. Retail traders get caught in that trap. So, to avoid getting trapped in those liquidity games, we gotta be smart. Waiting for that big institutional move and pairing it with Supply and Demand zones is the way to go. Keeping an eye on those consolidation zones before the market makes a big move is key. Patience is the name of the game when it comes to trading smart with liquidity levels. Good luck brother.
Una de las razones por las que los traders quedan atrapados en la falsas rupturas es no contar con una buena gestión de riesgoso. Conocer los stop-loss es indispensable para plantear una estrategia adecuada cuando no se dan los resultados esperados.
Por supuesto el dominio de los conceptos y la experiencias en el mercado ayudan mucho con la detección de estas falsas rupturas, existen además herramientas que se han hecho imprescindibles para el análisis técnico pertinente.
Gracias por compartir, saludos y éxitos.
You are welcome. I'm happy you found value.