Price Action and the Engulfing Candle Pattern - Crypto Academy- Dynamic Course for Beginners - S5W7 - @lenonmc21
I am pleased to be part of this wonderful lecture presented by @lenonmc21, I really appreciate your efforts in all aspects of your presentation. Your lecture on price action and Engulfing Candle Pattern has really made me to have an inside of the market. Based on this, I will be submitting my assignment on the topic below:

1.Say in your own words that you understand about the Trading Strategy with “Price Action and the Engulfing Candle Pattern, also describe each step to be able to execute it (Place at least 2 examples in clear cryptographic assets and with your own charts mandatory) ?
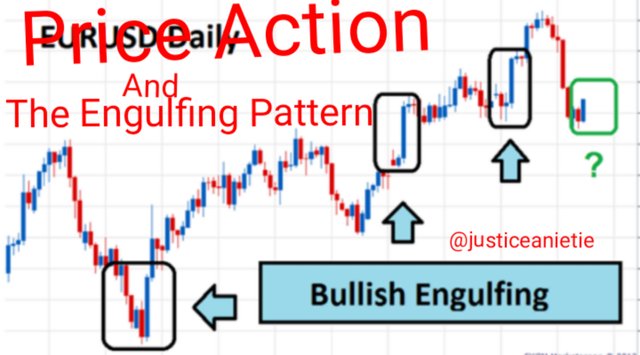
Price action is the basis where Trading strieve and this is all about the movement of price in the price chart. As a trader you need to have a full knowledge of price action strategy as well as the Engulfing Candle at certain level in order for you to execute the trade. At this point, when there is a strong movement of price in the market, this will help us in making proper trading decision in the market.
As a trader that understand the movement of the market, whenever we see a change in trend to the opposite direction, we should be ready to make proper analysis in order to make profit in the market. Note; this can be a bullish or bearish trend reversal.
When the market changes its direction, allow the market to have a break and come back to the previous breakout. At this point, there will be a formation of either bullish or bearish Engulfing candlestick at the support, then you can now open an order in the market.
As a trader, I want you to understand that you need a combination of strategy in order to trade the market. For you to identify a change of trend in the market, you will see that the market must be at the over bought level or over sold level, then the Engulfing candlestick will form, at this point we can take the trade and this is how to find a valid entry in the market. below is an example:
Screenshot from my binance app
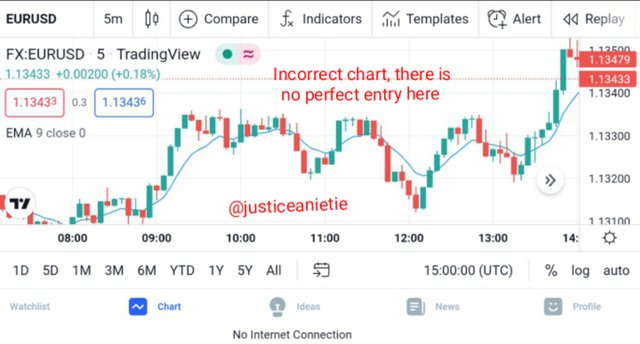
Screenshot from my tradingview app
For you to be able to attend success in carrying out a trade, confluence is one of the best things you should consider before entrying/ opening an order in the market. Below is the steps to considered before you can successfully carry out the strategy:
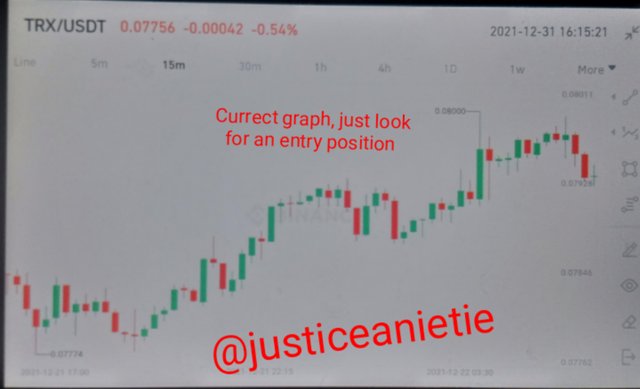
1.look for a Crypto pairs with clear trends, this might be bearish or bullish trend. I will encourage you to make use of 15 minutes with the use of price action.
Screenshot from my binance app
2.look for a movement to the opposite site of the trend. Whenever you see the market changing direction from bullish to a bearish trend, you should know that sellers are in control of the market. This means that, the sellers has put in huge amount of cash in the market. And this is what makes the market to change its direction from bullish to bearish trend or from bearish to bullish trend. Now when you see 3 to 4 candlestick bearish or bullish, you should know that there is a strength in the market as we can see in the chart below.
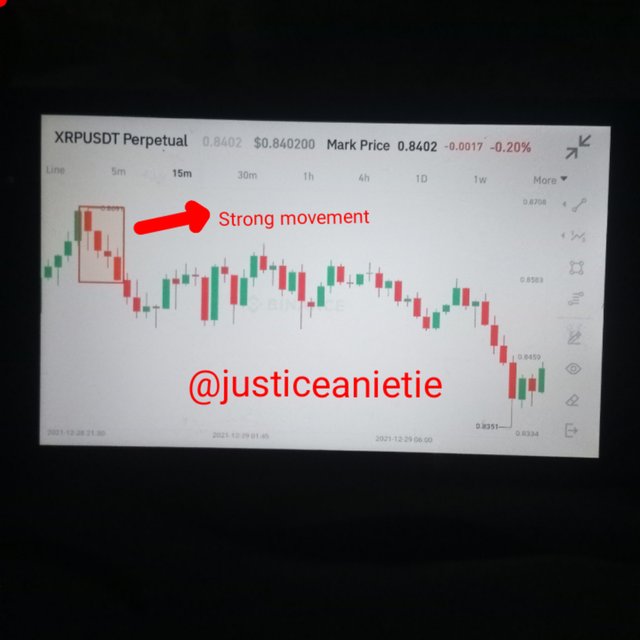
Screenshot from my binance app
3.Since we are dealing with a bearish trend, At this point we are looking for the retracement of price back to the previous break of Market structure which serve as a new support level. Then what we must be looking for is the bearish Engulfing candlestick at the retracement of price level before we can go short or sell the market. Note, this bearish candlestick must cover the previous bullish retracement candlestick and you can draw a horizontal line at that support and a vertical line on the bearish Engulfing candlestick as seen in the chart below.
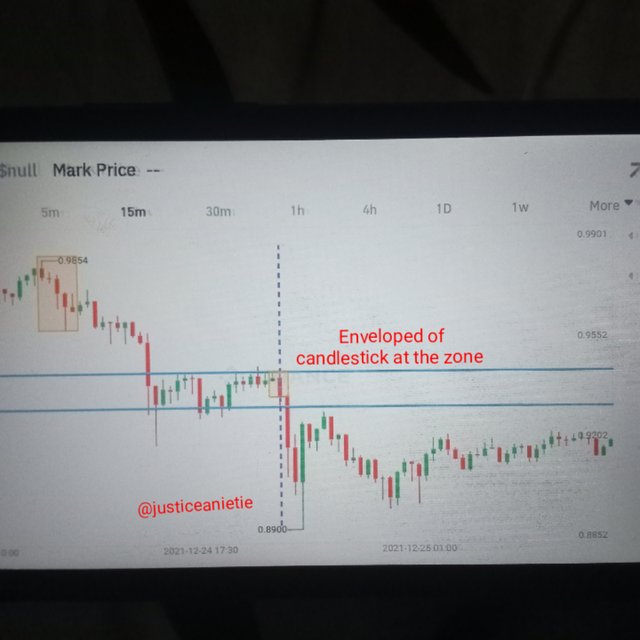
Screenshot from my binance app
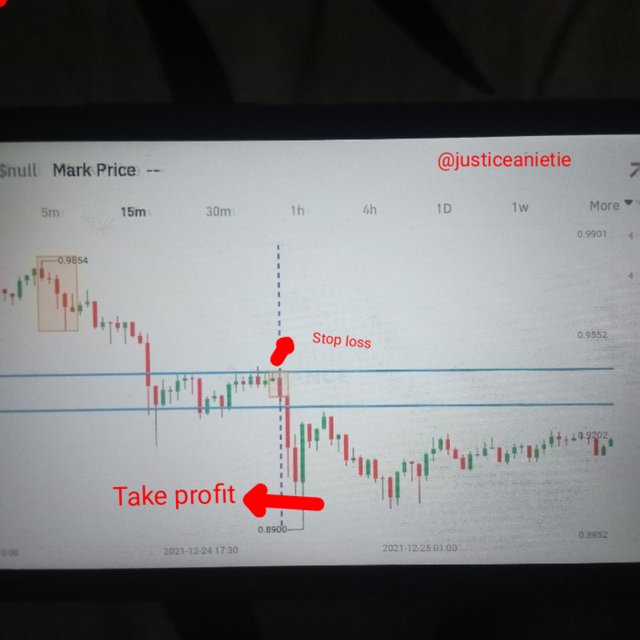
4.Here we have to move from 15 minutes to 5 minutes
chart to take our entry. But you need to watch the 15 minutes chart and allow the price to retracement back to the support, immediately you see a bearish Engulfing candlestick formed at that zone, you can now move to 5 minutes chart to take your trade. But to be on a saver side, the price must be at that zone in your 5 minutes chart before you can take the trade. If the price is not at that zone, please allow the price to return back to the zone. At this poin, once there is an engulfing bearish candlestick, please you are advised to go short in the market. Remember to place your stop loss above the support level and your take profit at the residence.
Snapshot from my binance app
2.Explain in your own words the interpretation that should be given to a large strong movement in the market. What does the price tell us when it happens?
For you to know how to read the trend, you must have an idea of the market structure and also the ability to identify the trend whether it's bullish or bearish trend. Now when there is a strong movement of Trend in the market either bullish or bearish, you will notice same formation of good body candlesticks. This can be during a bullish trend or bearish trend.
Bullish Trend:
Bullish Trend is an up trend. Here the market is easily identified when the price on the Candlestick making higher highs and higher lows.
You can equally see a strong movement in the market, this is where there are series of green candlesticks with good bodies.
An uptrend is easily discribed that the bulls has taken over power. This maens that buyers are more than sellers in the market. At this point, the price is indicating that we should go long or place a buy trade. Note, before you place a buy trade, you must make sure all the steps in question 1 has been met.
Bearish Trend:
As a trader, you should know that a bearish trend is a down trend and for you to know that there is a strong movement of price in the market is when the bears takes over power from the bulls.
You can easily identified this when there is a series of bearish candlestick with good body formation. At this point, the price on the Candlestick is telling you that there is a strong movement of price to the downside.
3.Explain the trade entry and exit criteria for the buy and sell positions of the trading strategy with Price Action and Engulfing Candlestick Pattern in any cryptocurrency of your choice (Share your own screenshots taking into account a good ratio of risk and benefit)?
Snapshot from my binance app
• Make sure the price is in a clear up trend: you should look for a pair of Cryptocurrency that has a clear uptrend, making higher highs and higher lows.
• Allow the price to retraced back to the previous high (support level). Here you can see series of bearish candlestick back to the support level.
• Wait for a bullish engulfing candle at the support level, using the 15 minutes chart
• Go back to 5 minutes chart to open a buy position in the market. Make sure that the market is at the support zone.
• Set your stop loss below the support and your profit target should be at the residence level.
• Your risk to reward ratio should be 1:2.
Note, the Engulfing candlestick must enveloped the previous candle. Please make sure you understand the whole process before taking the trade. When using the 5 minutes chart, if the price is not at the support, please be patience for the price to return back to the zone before taking the trade. If all the guidelines are followed, you stand the chance of making profits in the market. This is what you benefits as a trader only when all this rules are properly followed.
Snapshot from my binance app
• Make sure the price is in a clear down trend: you should look for a pair of Cryptocurrency that has a clear down trend, making lower highs and lower lows.
• Allow the price to retraced back to the previous high (support level). Here you can see series of bullish candlestick back to the support level.
• Wait for a bearish engulfing to enveloped a bullish candle at the support level, using the 15 minutes chart
• Go back to 5 minutes chart to open a sell order. Make sure that the market is at the support zone.
• Set your stop loss above the support/ above the bearish candle you have used to enter the trade and your profit target should be at the last residence level.
• Your risk to reward ratio should be 1:2.
Note, if the candle is not engulfing, please don't take the trade rather, wait for another entry. Equally note that your support and resistance in 5 minutes if it's not visual, you can check it in higher time frame.
Buy Trade
Screenshot from tradingview
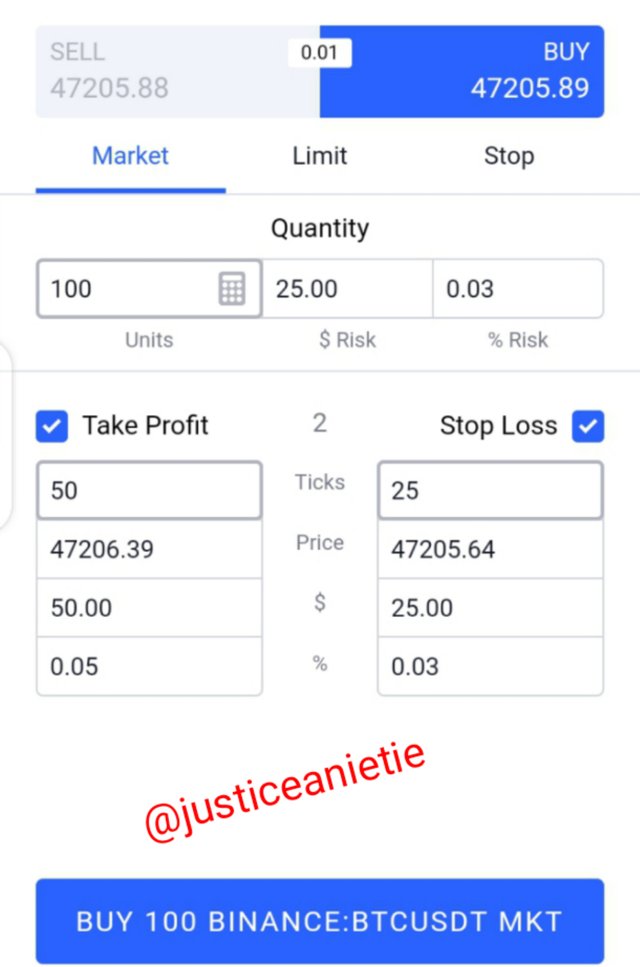
Screenshot from tradingview
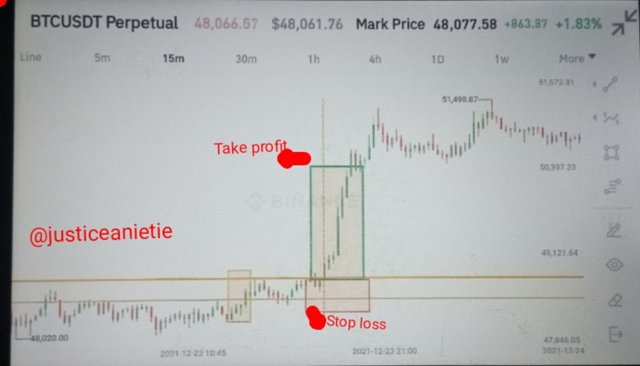
This is a buy trade as we can see from the chart above. I have open this trade using BTCUSDT trading pairs. The stop loss is placed below the support level, the entry is at the support level immidiately a close of a bullish Engulfing candle, and the take profit is at the residence zone. This is in line with what I have explained in this article above.
Sell Trade
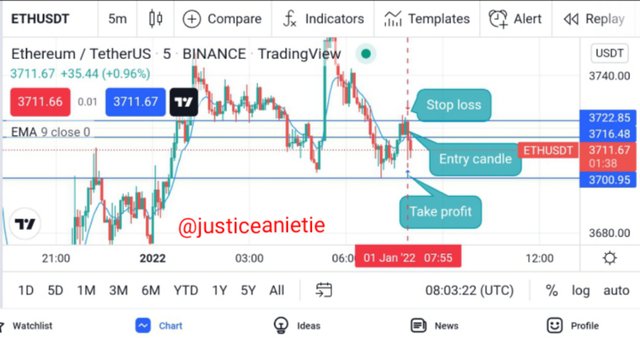
Screenshot from tradingview
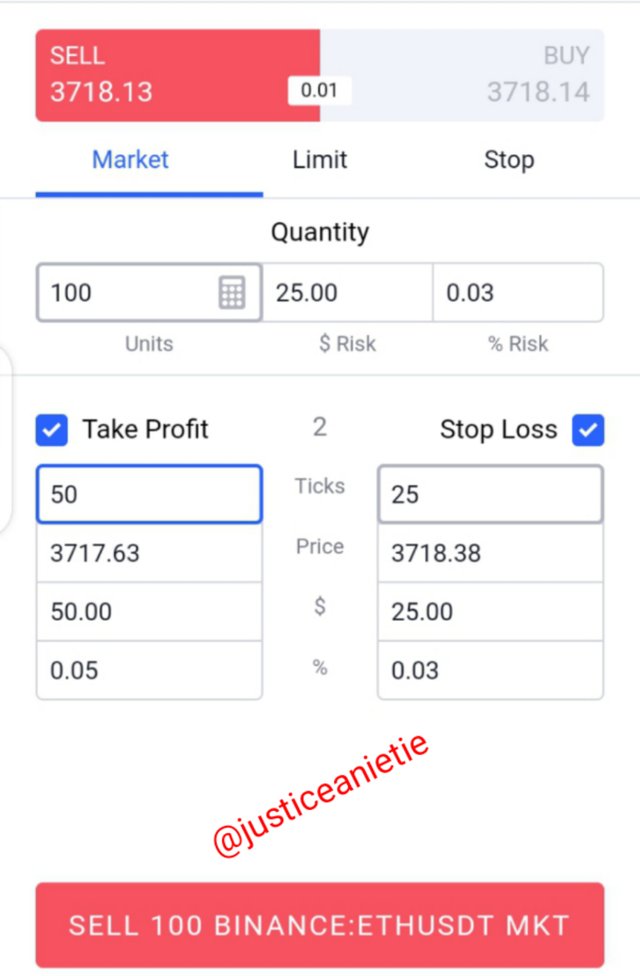
Screenshot from tradingview
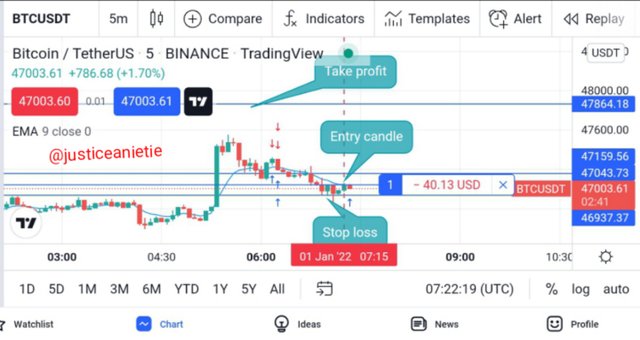
When you look at the open position, you will notice that it's a sell trade. All the conditions are met as explained above before I placed an order. The risk to reward ratio is 1:2. Stop loss is placed above support while take profit is at the first resistance. The order is opened immediately there is a bearish Engulfing candle at the support zone.
In this article, we have learned about price action and the Engulfing candlestick pattern.
We now have the knowledge on how to identify the engulfing pattern before taking the trade in both bullish and bearish trend.
We have identified the places where we can placed our stop loss and take profits in both bullish and bearish trend
We also looked at the 15 minutes chart to make out trade analysis before go to take the trade in 5 minutes chart.
I believed if we followed all the guidelines listed above, we will stand the chance of making profit from the Crypto market.
Thank you for your time.