[CRYPTO TRADING STRATEGY WITH MEDIAN INDICATOR]- Steemit Crypto Academy- Homework post for Professor @abdu.navi03 by @justiceanietie
Hello greetings to you all, i trust we all are doing great. Today i am happy to be part of this lesson and my thanks goes to Professor @abdu.navi03 for sharing this wonderful lecture. I will be submitting my assignment bellow:

1-Explain your understanding with the median indicator.
Indicators are always essential when it comes to Crypto currency trading. Traders makes use of indicators because it helps in giving directives on what the future trend is all about. However, Median indicator is known as a trend based/caching indicator which gives traders the foresight of measuring the direction of the market and its volatility to some level. At the chat, you will see that specific length of the high and low of the median value is been displayed. You should know that it uses the Average True Range (ATR), and this is determine by moving average which represent the thick median line. This always gives a purple which represents a bear market while the green color represent a bull market.
Therefore, as a trader you should always pay close attention to the chart, in order to identify the current market trend. Whenever you see the median line go above/ crosses the Exponential Moving Average, the green band appears and this is a signal of a bull market, while when we have the median line goes below the Exponential moving average of equal length, here the purple band appears.
Below are the procedure of applying median indicator:
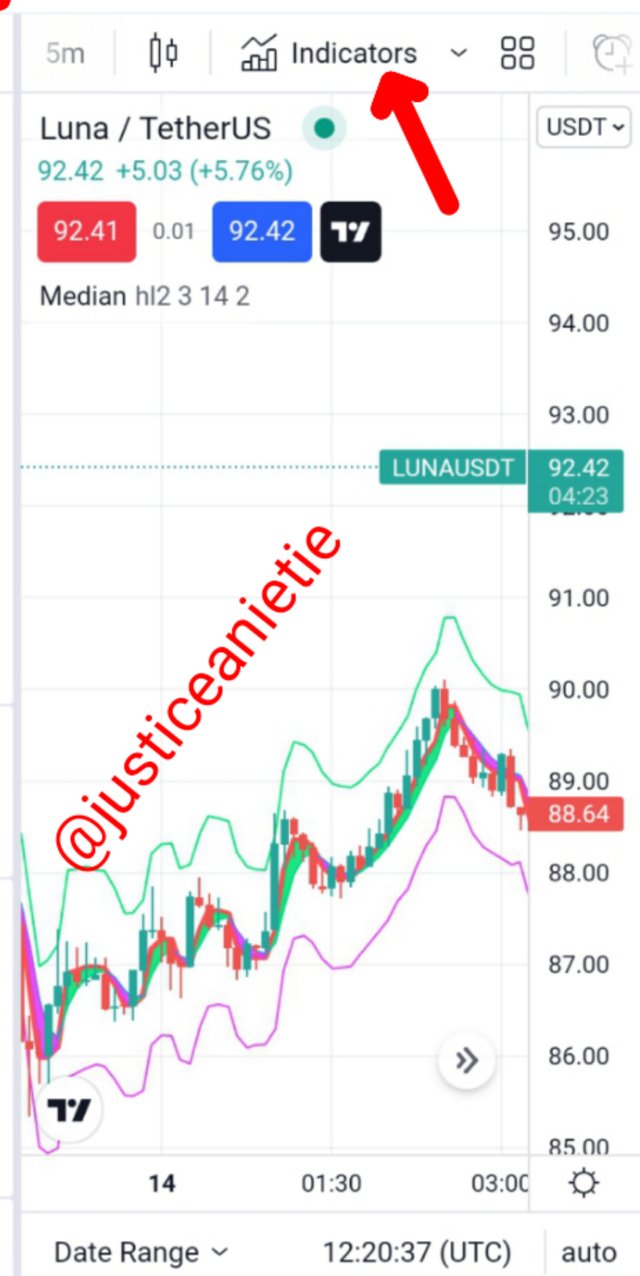
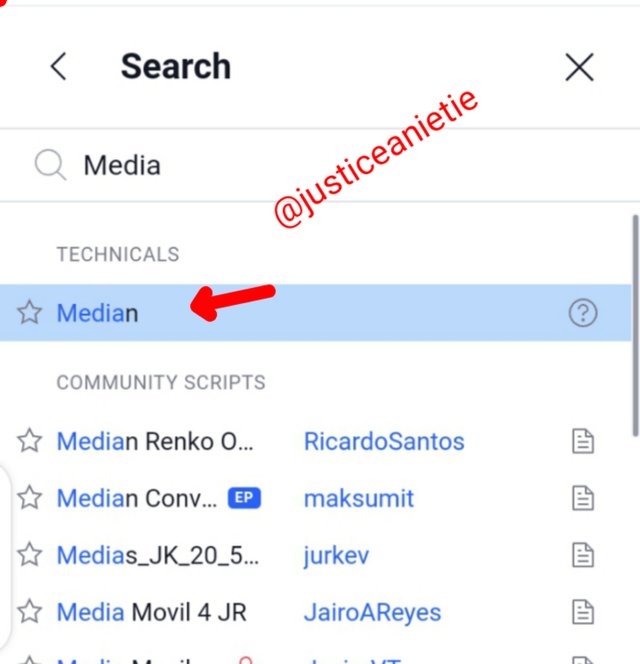
√ Open Trading view application
√ locate indicator and search for median indicator
√ Apply the median indicator to the chart by clicking on it.
Screenshot from trading view
Screenshot from trading view
Screenshot from trading view
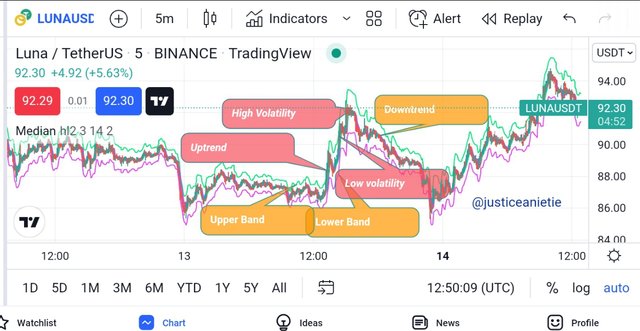
When you take a close look at the chart above, you will see that all what is needed in median indicator is clearly spelt out. Like the upper band, lower band, uptrend, downtrend, high Volatility, as well as low volatility.
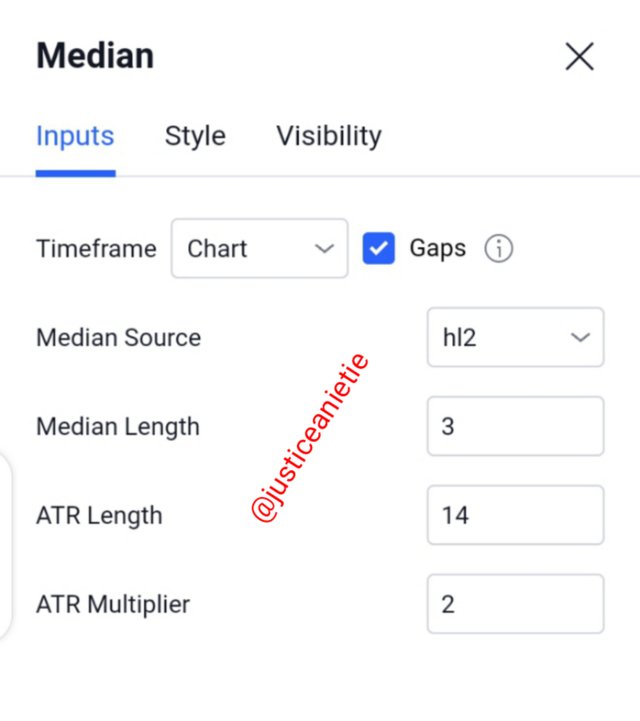
2-Parameters and Calculations of Median indicator. (Screenshot required)
As a trader, the calculation of the median indicator is not far fetched. However, it involves the calculation and addition of the high and low prices and then divide it by two, this is how the median value is determine when it comes to numbers. Therefore, for you to get the calculation of the median price, you have to calculate the average price of the candlestick, at this point you have to sum all the numbers of the specific period average price before you can now divide it by the actual period number.
This normally work with the Simple moving average line. The indicator is always plotted on the candlesticks share price, you can see this at the overlay option in the indicator settings.
What you need to do is to calculate the average price of each specific period candlesticks, next is to sum each of the candlestick average price, then at this point, you have to divide the outcome by specific period.
Formula:
first calculate each candle average = (High price + low price)/2.
then sum all 14 candle average.
then divided the 14-period average price by 14.
Screenshot from trading view
Screenshot from trading view
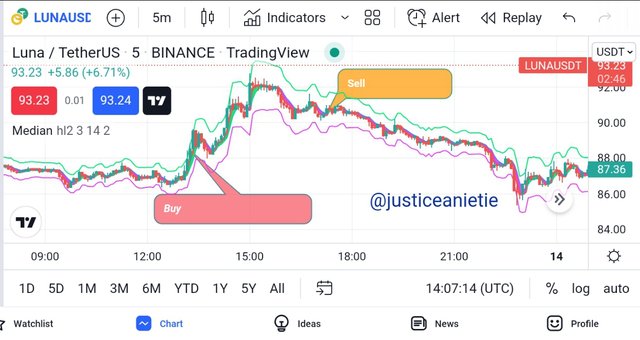
I want you to know that the indicator line is plotted on the share price candlesticks, here the movement of the historical price is in line with the average price line. Here the future and average price movement is determined. When you see the price moving above the median line, here you can place a buy order, while when the price is crossing the median line downward, you can sell the market.
3-Uptrend from Median indicator (screenshot required)
As i have explained before, the median indicator is a trends based indicator, this indicator generates buying and selling signals. I want you to know that traders make their money during a trending market and this is the benefits which is derived from the trend based median indicator.
When you look at the chart above, you will see that the band turns green and this is a clear indication of a buy signal and since it's a trend indicator, the trend moves on until it ends. Whenever you see the purple band, it indicates the end of the trend and this should be your take profit point or Stop loss point.
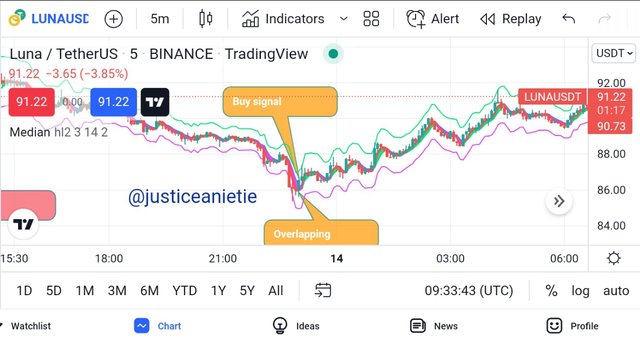
4-Downtrend from Median Indicator (screenshot required)
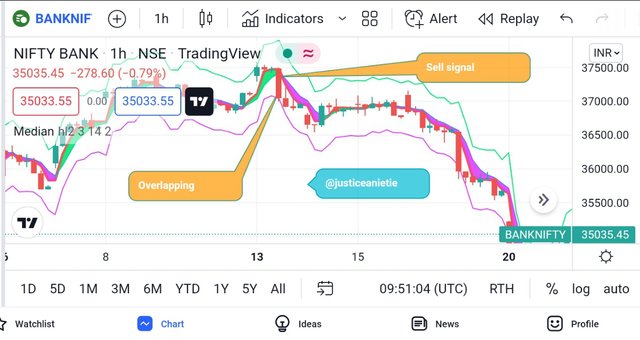
In identifying a down trend, this is when the band changed to purple/pink, just know that it's a sell signal. Also note that it's a trend indicator and this continues until the trend ends. Whenever the green band shows up, this signifies the end of the downtown trend which you should set your TP or SL.
5-Identifying fake Signals with Median indicator(screenshot required)
This indicator, as it is a trend-based indicator, can be used with that indicator that is not trend-based, to identify their wrong signals. And dodge from wrong trade openings. Such as signals from RSI.
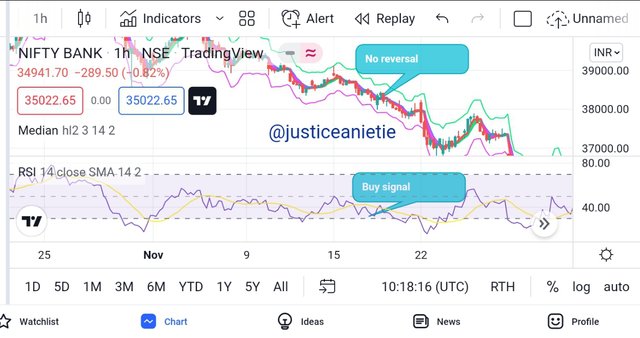
In this screenshot, it is clear how will this indicator will work and identify the wrong signal by RSI. When RSI gives the signal, watch and take a trade when the band changes, if it doesn’t, do not take the trade.
6-Open two demo trades, long and short, with the help of a median indicator or combination that includes a median indicator (screenshot required)
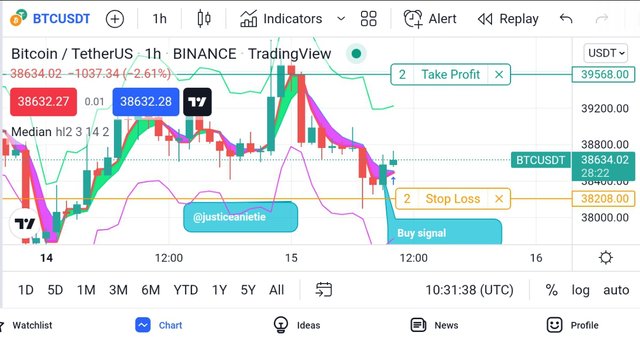
With the help of median indicator, i have been able to open a buy trade with BTCUSD Crypto trading pairs as you can see the screenshot above. With the help of the overlapping candle, i have carried out this trade.
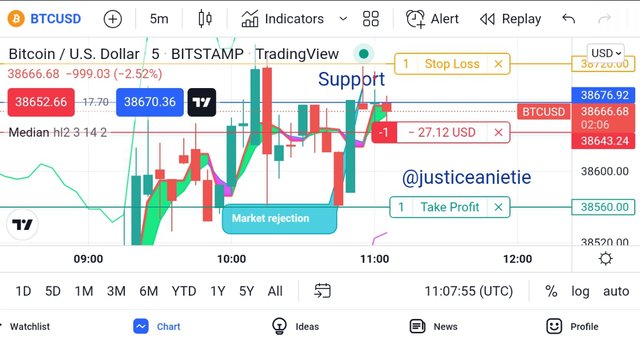
If you watch carefully, you will see that i have entered this sell trade at support in line with a long wick rejection together with the median indicator. Here, i have entered the market a little bit late, because when you look back to two or three candles, you will see where this trade might have start from and we would have gotten a better entry. For the this trade i have place my stop loss and TP using BTCUSDT trading pairs. I have placed my stop loss a bit above the pin bar.
The median trend following is one among the best indicator because it gives the direction of the trend. Beginners can use this indicator and make reasonable cash without stress.
But for you to succeed in using this strategy, you must study and understand the chart and learn how to follow the band and make use of the overlapping signal candle for reversal.
Thanks you for your time.