Understanding Trends- Crypto Academy/S5W1- Homework post for @reminiscence01
With a heart full of appreciation and joy, I welcome all to the season 5 of the steemit crypto academy.
We give thanks to the Almighty for keeping us alive to begin this season and we pray that we shall end this season together.
This week being the first week of Season5,we shall be discussing on trends, we shall gain insight on the usefulness of trends in a chart.
Without further ado, shall we proceed to the first question of this lecture;
WHAT DO YOU UNDERSTAND BY A TRENDING MARKET?
WHAT DO YOU UNDERSTAND BY A TRENDING MARKET?
Before diving in, on trending market, we need to first understand what a market is.
A market is a place where two or more people meet, all with the objective of getting involve in a trade, either buying or selling. It also involves exchanging valuables.
Cryptocurrency market is usually decentralized, that is, it is free from the control of central authorities, it's currencies are usually digital currencies, operated over a network of computers, and are exchanged using the pair to pair network.
The nature of a market is heavily affected by demand and supply, and this is controlled by the price of commodities.
The law of demand states that "with all things being equal, the higher the price of a commodity, the lower the quantity demanded and the lower the price of a commodity, the higher the quantity demanded"
The law of supply state that the higher the price, the higher the quantity supplied and the lower the price, the lower the quantity supplied.
As clearly seen from the law of demand and supply, the price of a commodity is one huge factor that affects the nature of the market.
Having understood this fact, shall we proceed to understanding what a trending market is.
We all agree, that in a literal market, when a trader has much customers purchasing a particular commodity that is in limited quantity, there's always a high tendency of the price of such commodity going up.
And when the commodity is in abundance, it's price will definitely reduce.
A good example is a farmer who sells crops to his customers on both favorable and unfavorable condition.
No doubt when it gets to the unfavorable condition which is the dry season, the price of such crops will increase, because the crops are in limited quantity as they are hard to produce.
When it gets to the favourable condition, that is when it gets to rainy season, the price of such crops will reduce as the crops will be in abundance.
And no doubt, all farmers will do same inorder to maximize profit, in a sense following the trend of other farmers.
A trend can be explained as following a particular direction over a given period of time.
A trending market is also explained as the movement of market price in one direction over a specific time.
A market trend can either be a downtrend, an uptrend or a sideways trend.
An uptrend which is also known as a bullish trend, usually possesses a green Japanese candlestick which is characterized by higher high and higher lows in a given chart.
A downtrend which is popularly known as a bearish trend is one with the red Japanese candlestick, characterized by lower high and lower low.
A sideways trend also known as a ranging phase is a condition where there's neither an uptrend nor a downtrend.
The usefulness of trends in trading cannot be overemphasized, it's helps show the nature of the market and gives traders insight on the best position to enter and leave the market, it also helps identify the weaknesses and strength of a market.
1B
WHAT IS A BULLISH AND BEARISH TREND [ SCREENSHOT REQUIRED]
1B
WHAT IS A BULLISH AND BEARISH TREND [ SCREENSHOT REQUIRED]
BULLISH TREND
SCREENSHOT FROM BINANCE
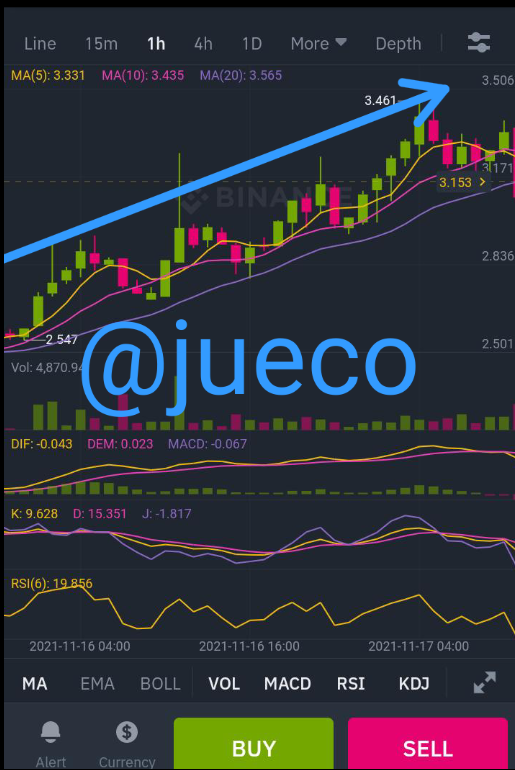
A bullish trend as I said earlier is an uptrend.
It is a trend that indicates the recovery of a market after a downtrend over a given period of time.
In other words, a bullish trend is a market trend that shows the continuous increase in the price of a commodity over a given period of time.
A bullish trend indicates that the bulls are taking charge over market, it also indicates that there are more buyers than sellers over such a commodity at that given period of time.
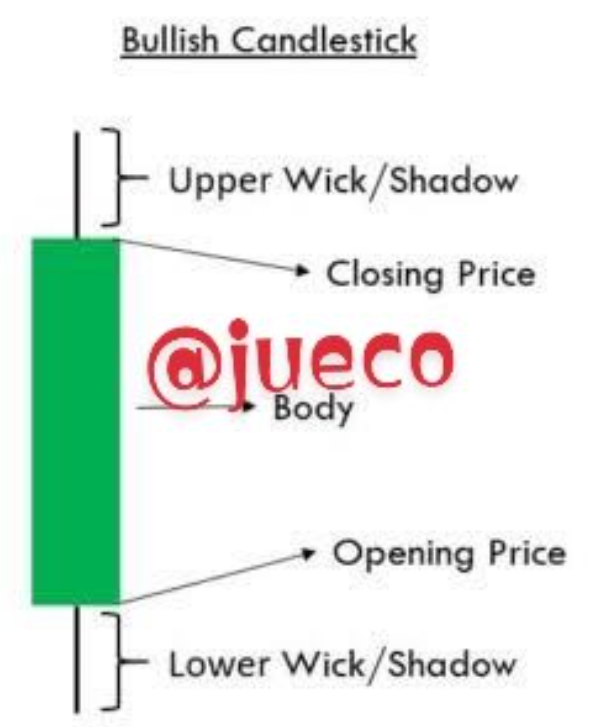
A bullish trend is usually characterized by higher highs and lower lows. This means that the closing price of a bullish is usually higher than it's open price.
The presence of continuous bullish trend usually leads to the formation of new all time highs of crypto assests, and this is usually a good time to enter the market and take profit, before the bulls take charge.
The understanding of bullish trend enables traders to know that minor decrease in price of a commodity is an essential part of the continuation of such trend, as this pull back is known as retracements.
It is necessary for a bullish trend to undergo retracements and then continue on its bullish move.
A bullish trend is usually characterized by the formation of bullish candles and they are green in color.
BEARISH TREND
SCREENSHOT FROM BINANCE
A bearish trend is opposite to a bullish trend.
A bearish trend also known as a downtrend, is a trend indicating decrease in the price of a commodity in the market over a given period of time.
A bearish trend indicates that the bears are in control of the market, that they are dominating the bulls. At this situation, short term traders are not adviced to enter the market, as the bears are still in control.
A Bearish trend shows that there are more sellers than buyers of such commodity in the market.
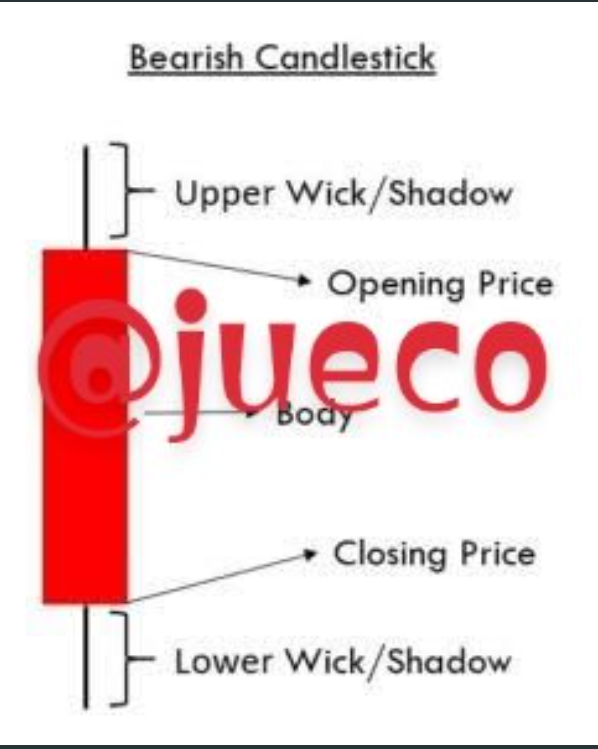
In a bearish trend, the closing price of a commodity is usually lower than it's opening price and this indicates fall in price of such commodity.
The bearish trend is usually characterized by lower lows and lower highs, and also by the formation of a bullish candles, which is red in colour.
EXPLAIN THE FOLLOWING TREND IDENTIFICATION AND GIVE AN EXAMPLE OF EACH OF THEM [ORIGINAL SCREENSHOT FROM YOUR CHART]
DO THIS FOR A BULLISH AND BEARISH TREND
I.) MARKET STRUCTURE
II.) TRENDLINES
EXPLAIN THE FOLLOWING TREND IDENTIFICATION AND GIVE AN EXAMPLE OF EACH OF THEM [ORIGINAL SCREENSHOT FROM YOUR CHART]
DO THIS FOR A BULLISH AND BEARISH TREND
I.) MARKET STRUCTURE
II.) TRENDLINES
MARKET STRUCTURE
Market structure deals mainly with support and resistance on a chart, it deals with the high swings and low swings of trendlines on a chart .
Gaining an understanding on market structure is one of the keys to trading as it makes trading easy.
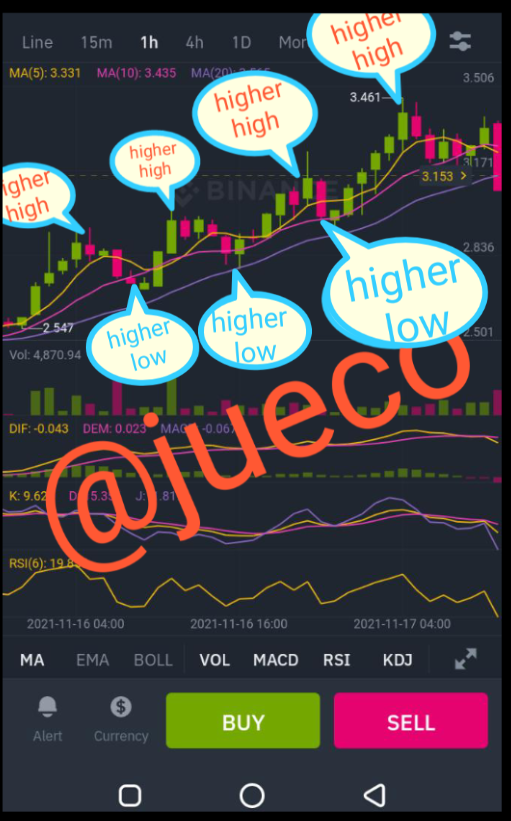
Market structure can thus be explained as the wavy movement of price on a chart, which leads to the formation of higher highs and higher lows as the market experiences an uptrend, and the formation of lower highs and lower lows as the market experiences a downtrend.
But, if the market is neither in an uptrend nor a downtrend, we can say that the market is ranging or in a consolidation.
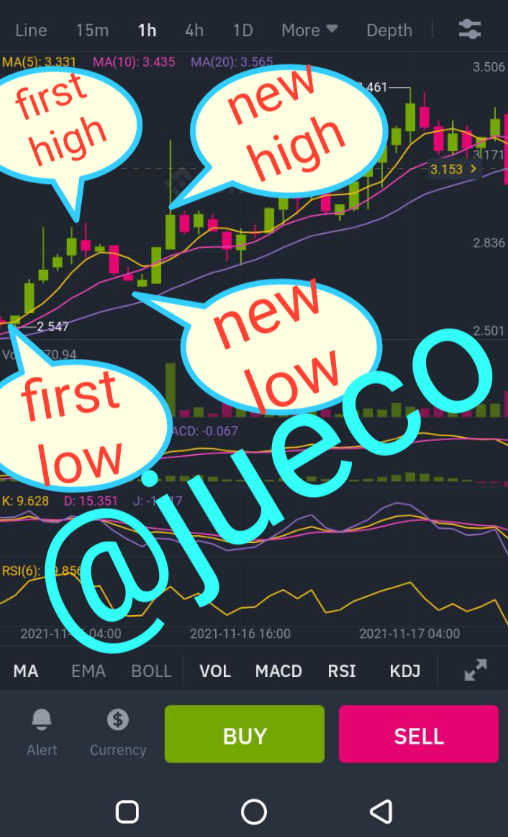
In a bullish market structure, each distinct high is a good selling point as the market tends to go downward and every low is a good buying point.
SCREENSHOT FROM BINANCE
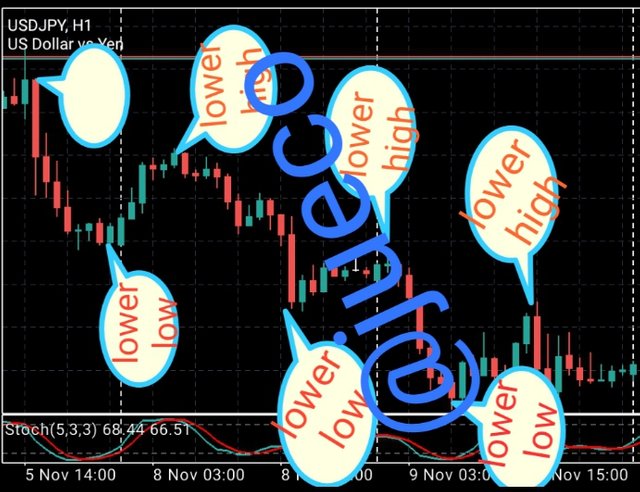
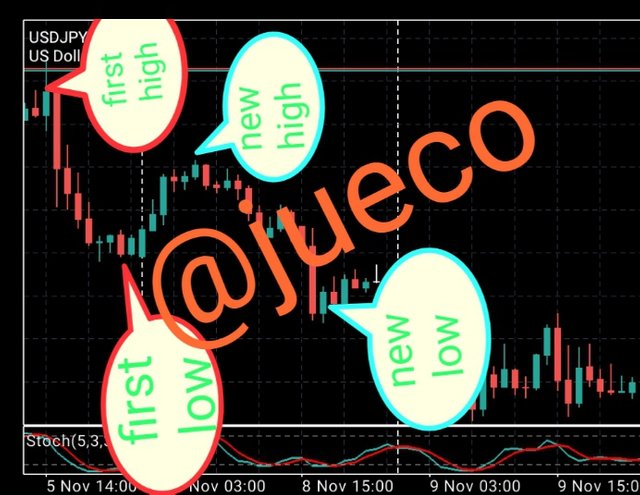
In a Bearish market structure, there's formation of lower low and lower high.
This is thus indicating that the market is decreasing in price as it falls to reach it's previous low prices.
The formation of lower low and lower highs are good trading signals for experienced traders, each lower high tends to be a good selling point and every lower low happens to be a good buying point.
The price tends to increase after every lows and tend to decrease after every highs.
SCREENSHOT FROM MT5
The market structure sometimes happens to be in a consolidation or a ranging phase.
This means that the market is neither in a bullish nor a bearish trend.
This market condition shows that the price of the market does not exceed it's support and resistance point.
TREND LINES
Trendlines also known as bounding lines are recognisable lines drawn by traders on a chart to connect pivot highs and pivot lows of prices, hence, showing the directional move of such price.
The trend line is a very useful technical analysis tools used by traders, it helps a lot in ascertaining the current direction of the market.
As the saying goes, "the trend is your friend", so to successfully make a good trade, Identification and understanding of market trend is the first step to take.
A line on a chart can only be referred to as a trendline when it has successfully touched two pivot points on the chart.
To create a trendline, a trader has to spot at least two highs or two lows on the chart and connect them together.
It is also good to note that not every pivot points joined on a chart can be called a trendline, unless it is confirmed by ensuring it touches three points.
We have two types of trendlines, they are the support trend line and the resistance trend line.
A support trendline is one formed when decrease in price of commodities form pivot points that align to its previous pivot points.
A resistance trendline is one formed when increase in price forms pivot points that aligns to its previous pivot points.
A support trendline is usually used for a bullish market and a resistance trendline is usually used for a bearish market.
Below are some screenshots indicating the bearish and bullish trend.
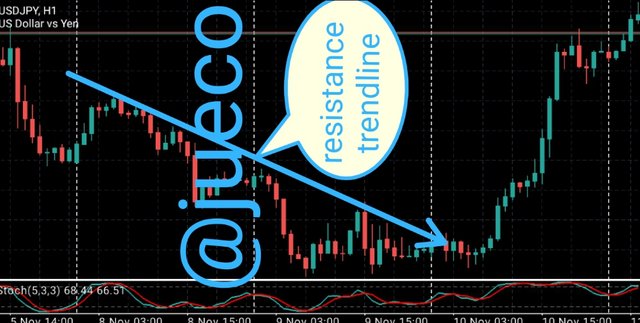
BEARISH TREND FROM MT5
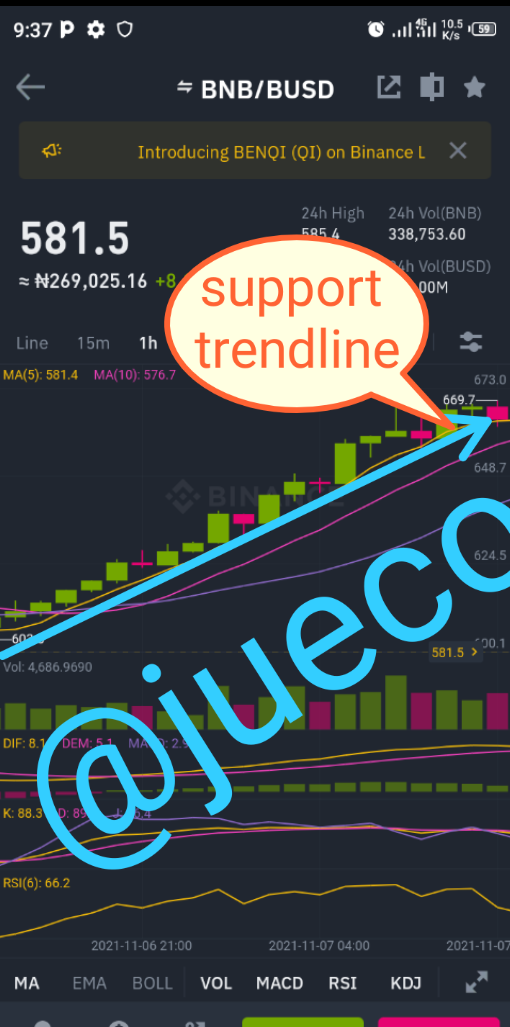
BULLISH TREND FROM BINANCE
EXPLAIN TREND CONTINUATION AND HOW TO SPOT THEM USING MARKET STRUCTURE AND TRENDLINES [SCREENSHOT NEEDED] DO THIS FOR BOTH BULLISH AND BEARISH TRENDS
EXPLAIN TREND CONTINUATION AND HOW TO SPOT THEM USING MARKET STRUCTURE AND TRENDLINES [SCREENSHOT NEEDED] DO THIS FOR BOTH BULLISH AND BEARISH TRENDS
A trend continuation pattern indicates the continuation of a trend once it has ended.
And there are various forms of trend continuation patterns and they are;
- Flags continuation pattern
- Triangles pattern
- Rectangle pattern
- Pennants pattern
The triangle are continuation pattern formed by the converging of prices alongside lower low and lower highs.
The flags are usually referred to pause in the trend where the price falls within a small range and parallel lines.
Pennant are just like the triangle continuation pattern but they are within smaller ranges.
The rectangle continuation occurs when there's a pause In the trend and the price neither goes upward nor downward, but ranges
This continuation trend is created between parallel support and resistance lines.
For a trend continuation to occur on a bearish trend, there must exist a lower low and a lower high.
This means that the new high must not be equal to nor greater than the previous highs and the new lows must be in a lower position than it's previous lows.
Below are some screenshots of bullish and bearish trend continuation
BULLISH TREND FROM BINANCE
BEARISH TREND FROM MT5
The above is the trend continuation for for the market structure and it holds as long as the trend is not broken.
Spotting a trend continuation in a trend is only possible if the trend line is not obeyed . The trend line should not be broken, once it is , then the trend continuation is not ascertained.
Below are some screenshots of trend continuation using trendlines
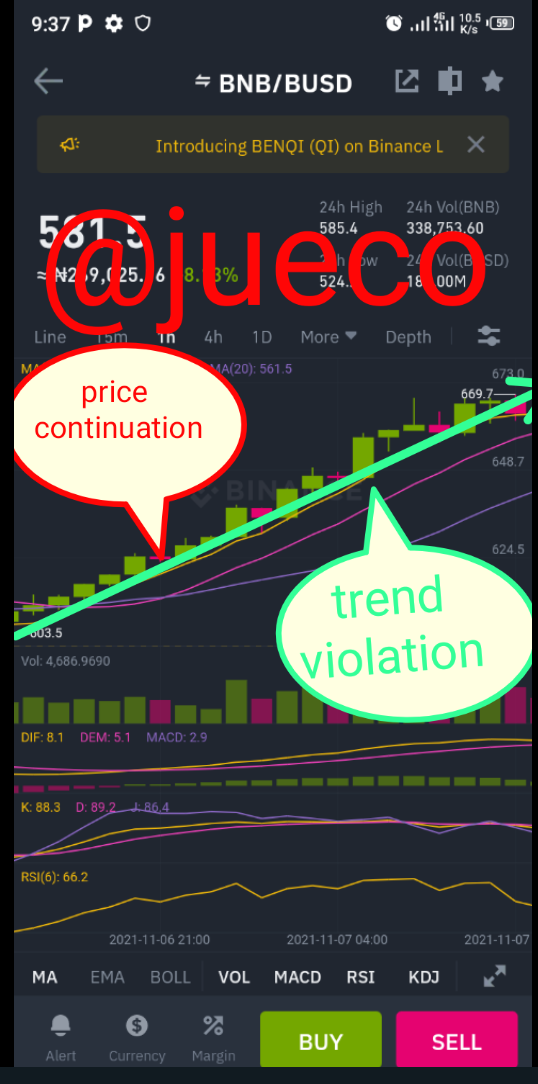
SCREENSHOT FROM BINANCE
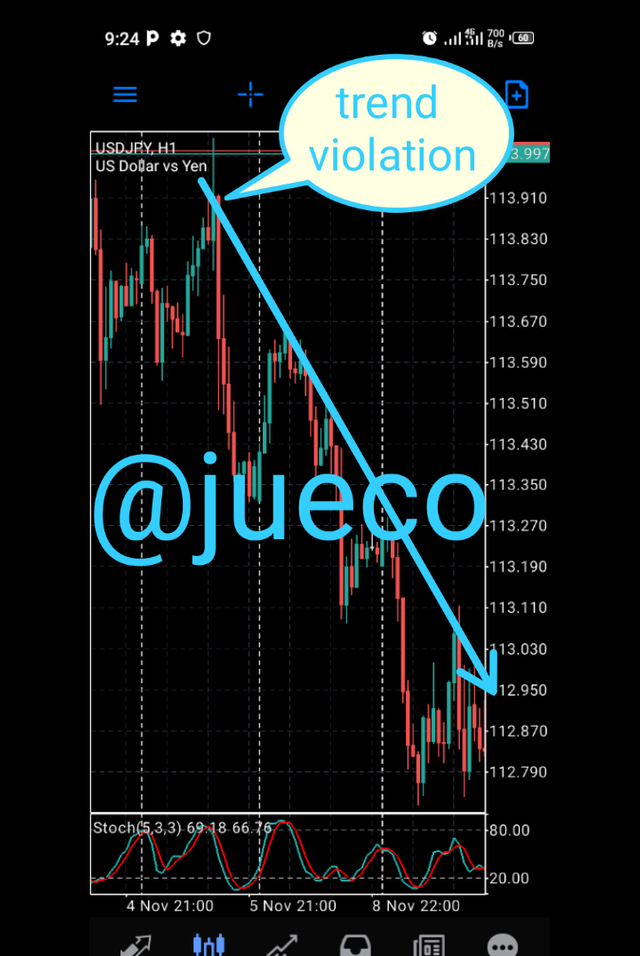
SCREENSHOT FROM MT5
PICK UP ANY CRYPTO ASSET CHART AND ANSWER THE FOLLOWING QUESTIONS
1.) IS THE MARKET TRENDING
2.) WHAT IS THE CURRENT MARKET TREND
PICK UP ANY CRYPTO ASSET CHART AND ANSWER THE FOLLOWING QUESTIONS
1.) IS THE MARKET TRENDING
2.) WHAT IS THE CURRENT MARKET TREND
1.)
SCREENSHOT FROM BINANCE
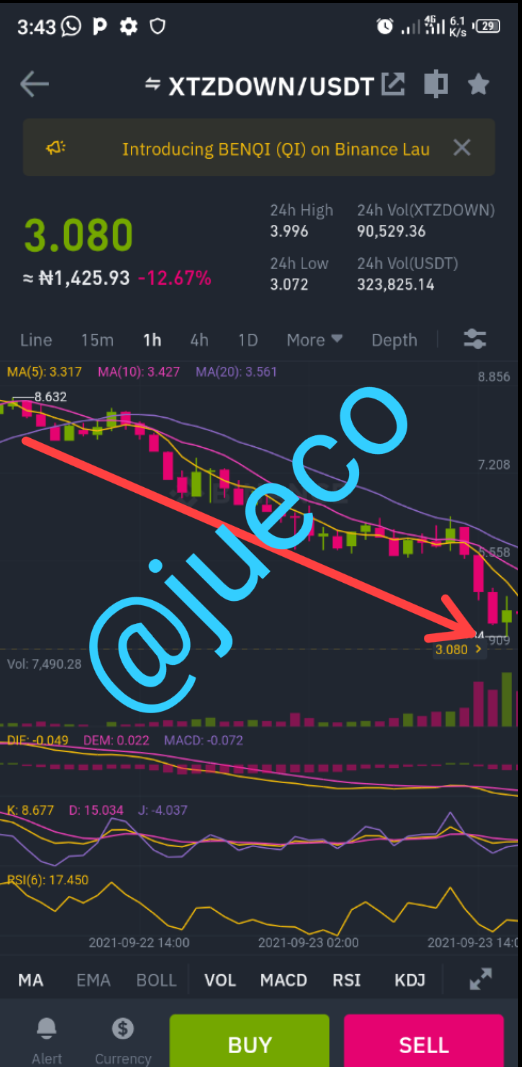
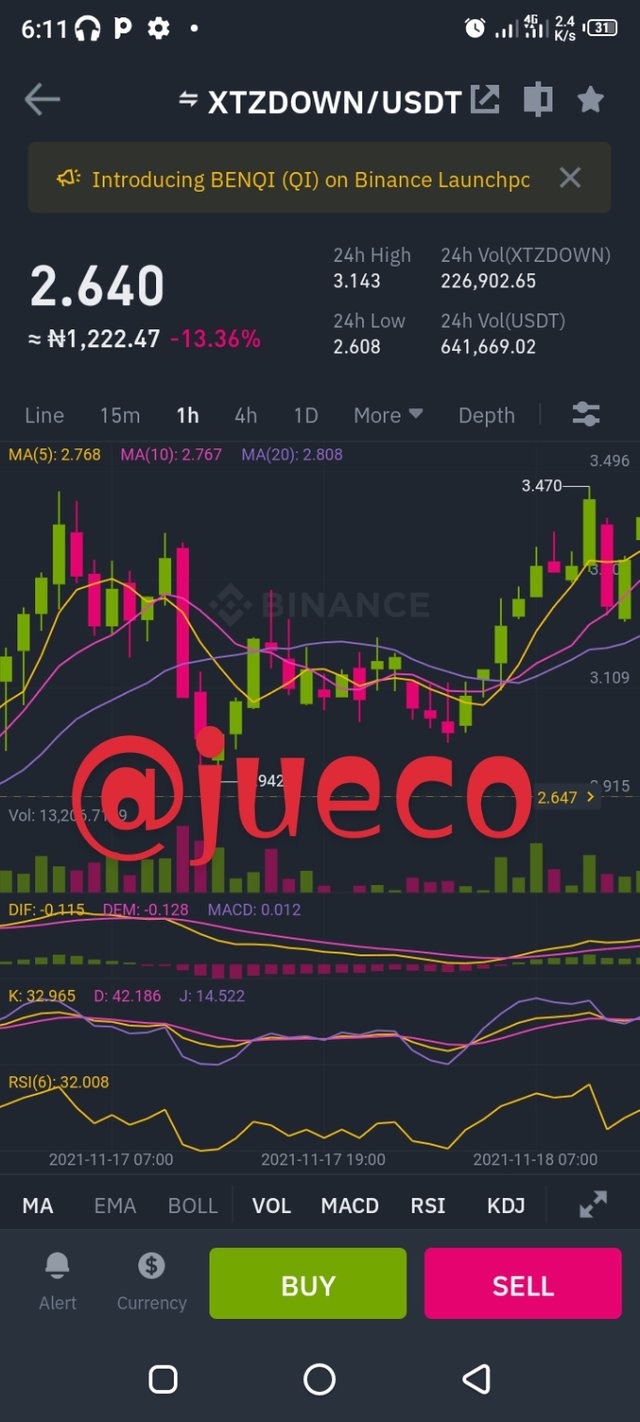
I choose to analyse the crypto pair XTZDOWN/USDT.
Earlier, the chart was not indicating a trending market, the prices were moving randomly in a zigzag manner. This is clearly seen from the screenshot above.
(2)
SCREENSHOT FROM BINANCE
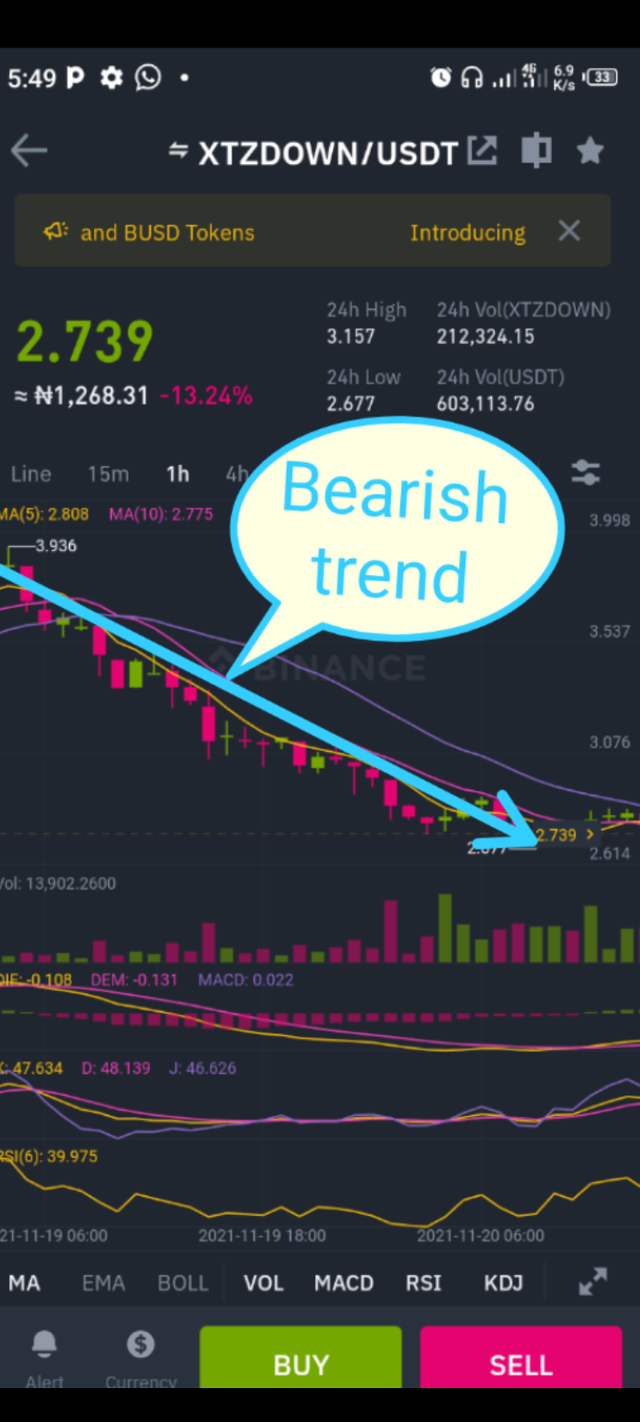
As of when this post was made, the Current trend of the market was in a bearish move, that is it's price was decreasing.
As earlier explained, a downtrend has its opening price higher than it's closing price and this is clearly seen from the chart above.
CONCLUSION
Indeed, understanding trend is a very essential aspect in crypto trading, it will be impossible to be a successful trader without having a broad understanding of trends.
Trends happens to be the stepping stone to success of every crypto trader.
I appreciate Prof @reminiscence01 for his lecture on trends. I look forward to your next lecture professor.
My comment box is opened to all who have additional comments to make.
Hello @jueco, I’m glad you participated in the 1st week Season 5 of the Beginner’s class at the Steemit Crypto Academy. Your grades in this task are as follows:
Observations:
Price action either has a trending movement or in a ranging movement. Try to use the right terminologies.
Recommendation / Feedback:
Thank you for submitting your homework task.
Thanks for the review prof
My able prof @reminiscence01, please help me with my post, it have not been curated by @steemcurator02.
CC
@sapwood
Please @reminiscence01, I humbly and patiently await your response sir