Technical Indicators – Crypto Academy / S4W2– Homework post for @reminiscence01
With all humility of heart, I sincerely welcome you to the week2 of the season 4 of the steemit crypto academy. To an assignment given by my humble Prof @reminiscence01 on the topic Technical Indicators
This happens to be the first topic taught by my Prof in this new season, season 4, and I eagerly wait to participate in all his classes as all his classes tends to be educative and fun-filled.
His lectures on season 3 taught us a lot of information on crypto currency, as we channeled more attention to the primary trading tools used in carrying out technical analysis.
To further butress the importance of technical analysis, it is good to note that without the support of technical analysis, investors and traders will make lot of losses in their trading transactions.
In this assignment, we will be discussing on one of the important tools of technical analysis which are Technical Indicators
Please follow along as we begin our adventure by attempting the first task
IN YOUR OWN WORDS, EXPLAIN TECHNICAL INDICATORS AND WHY IT IS A GOOD TECHNICAL ANALYSIS TOOL
As above explained, it will be almost impossible for traders to make profit without technical analysis, as it influences their decision making.
Now, one of the tools that aids the smooth running of technical analysis is what is known as technical indicators.
Technical Indicators can be described as one of the tools used in chart analysis that helps in the expansion of the knowledge and understanding of traders on the movement of price.
There are different kinds and categories of technical Indicators and they help in diverse of ways.
There are some that helps in trend analysis, we also have those that assists in the measurements of volatility of a market and we have those that indicates price averages.
There are still more assistance rendered by technical Indicators that will be explained later in our adventure.
We can also say that technical Indicators are created signals given by the volume/price used by a technical analyst.
By this analysis of data, technical analyst are able to foretell the future movements of prices.
Technical Indicators are most times mathematical tools which involves calculations used by traders to interpret price movements by analysing past/historical price trend and predicting future price trends.
The aim of using indicators is to spot trading opportunities, for instance, an upward trend change is signaled by a moving average crossover, and for a trader to spot areas where the trend changes direction and run out of gas, he may need to apply the price chart of a moving average indicator as this helps creates a trading opportunity.
It is good to note that a technical Indicator differs from a trading strategy.
Agreed, Indicators assist traders to identify the conditions of a market but a strategy happens to be the rule book of a trader, and a trading strategy is formulated by the use of multiple Indicators.
To develop a strategy, a trader needs to choose carefully on what type of Indicator to be used.
For example, a trader who wishes to participate in a long term moves accompanied by large gains will need to focus and use a trend following Indicator while a trader who seeks a small move will need to focus on a volatility based Indicator.
It is the duty of a trader to state the methods that indicators will be used to give signals on trading opportunities as indicators alone don't create trading signals.
Yes, technical Indicators are undeniably good technical analysis tools as they help in so many ways to make technical analysis more accurate, their importance are highlighted below:
- Market prices fluctuate haphazardly in a continuous manner and this makes its data difficult to track but with the help of a technical Indicator, these data are smoothened and made easier to comprehend.
- It also helps in the identification of the direction and strength of the price of a market.
- Another of its importance is that it helps in the identification of the resistance/support levels of prices, that is, it helps indicates if a price has climbed higher or dropped lower.
- It acts as an alarming system that alerts traders on the volatility of a market stock.
- Technical Indicators play an important role in the determination and prediction of the future prices of a market.
- It also helps in the establishment of both downward and upward trends as this is of great assistance to traders.
The above mentioned are the reasons technical Indicators are good analysis tools.
Although Indicators are good analysis tools but there are some tips that should be taken note of by analyst, they are;
- An analyst should ensure that the price action of a market should be a considerable factor when taking the analysis of an indicator.
- The buying and selling decision of a trader should not be dependent only on an indicator, traders should endeavor to make use of other tools too.
- Analyst should also be aware that an indicator can give diverse of analysis when it is applied to different charts.
Having explored the aim of the first part of the task, shall we proceed to the analysis of the second part
ARE TECHNICAL INDICATORS GOOD FOR CRYPTO CURRENCY ANALYSIS?
The application of technical Indicators are diverse as it can be applied to any form of security with trading data like forex, crypto currency e.t.c.
For my part, I will say that technical Indicators are good for Crypto currency analysis because;
- It helps the trader to understand the market and price behavior of crypto currencies
- Another reason I said that technical Indicators are good for Crypto analysis is because Indicators helps in the prediction of prices, demans/supply of a market and this give the trader knowledge and insight on when to purchase and sell a commodity.
- Technical Indicators also helps to identify trading opportunities of crypto currency.
- As we know, change in demand and supply affect the price movements of commodities, and technical Indicators helps in the analysis of these price movements.
- Technical Indicators play a very important role in the interpretation of candlestick pattern and Prof @reminiscence01 has given a well understood lecture on candlestick pattern.
Having explored that, shall we proceed to the third part of the first question, please don't tire out as there are more to learn.
ILLUSTRATE HOW TO ADD INDICATORS ON THE CHART AND ALSO HOW TO CONFIGURE THEM
This is one of the most technical part of our adventure and I promise that if more than usual attention is paid, this adventure will be well understood and enjoyed.
To add Indicators to chart is an easy task to do.
I visited trading view on my phone, fortunately I have it as an application.
So I clicked on the app and I was asked to sign in of which I did.
SCREENSHOT FROM TRADING VIEW
and I searched for BTC/USD
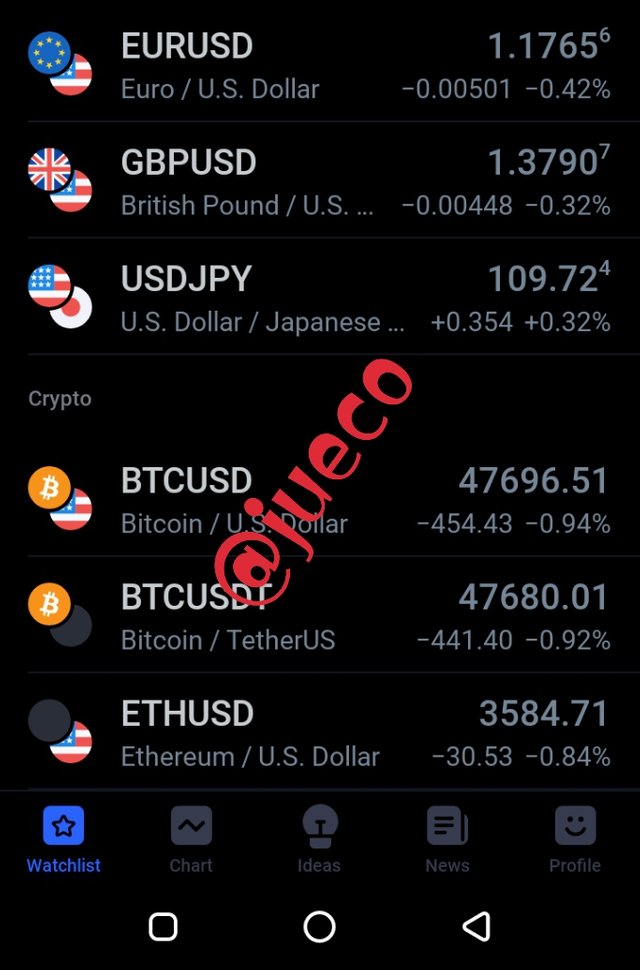
SCREENSHOT FROM TRADING VIEW
After that, the next thing I did was to click on fx Indicator
SCREENSHOT FROM TRADING VIEW
After I clicked on it, the below screenshot appeared
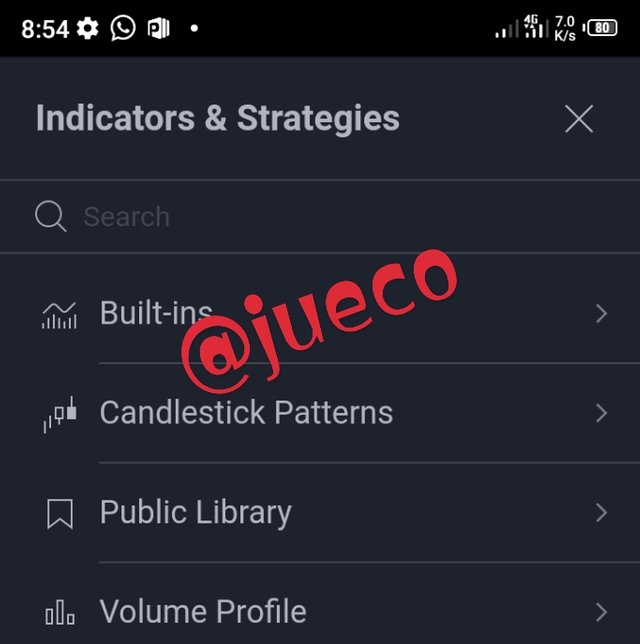
SCREENSHOT FROM TRADING VIEW
Of which I clicked on the search bottom and searched for parabolic sar, the Indicator I wish to apply.
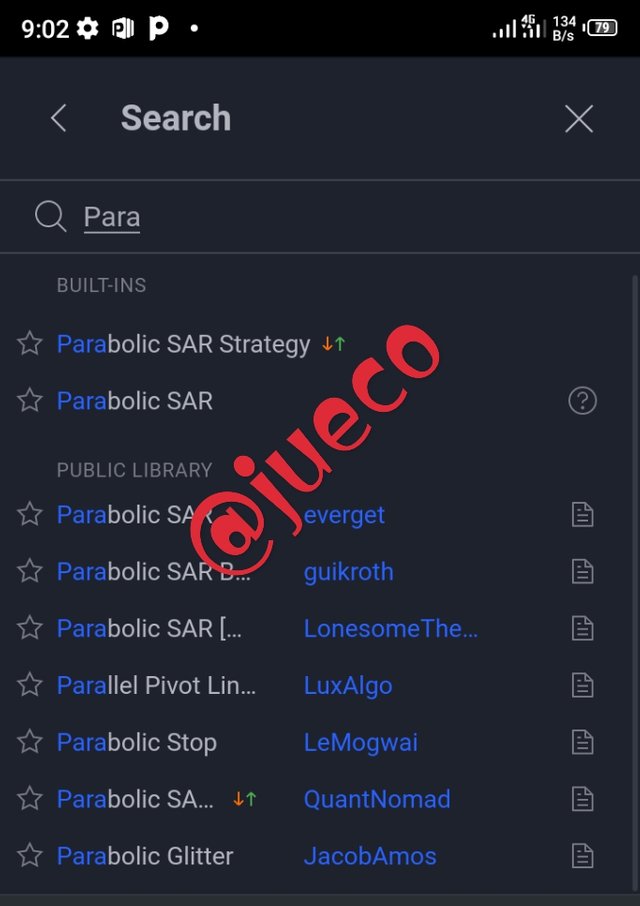
SCREENSHOT FROM TRADING VIEW
And I clicked on it and if was applied
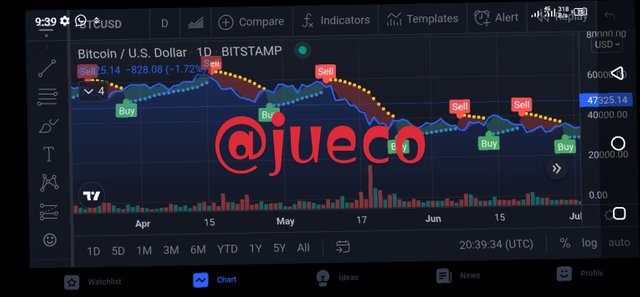
SCREENSHOT FROM TRADING VIEW
And the next thing I did was to configure it and I did it by checking this
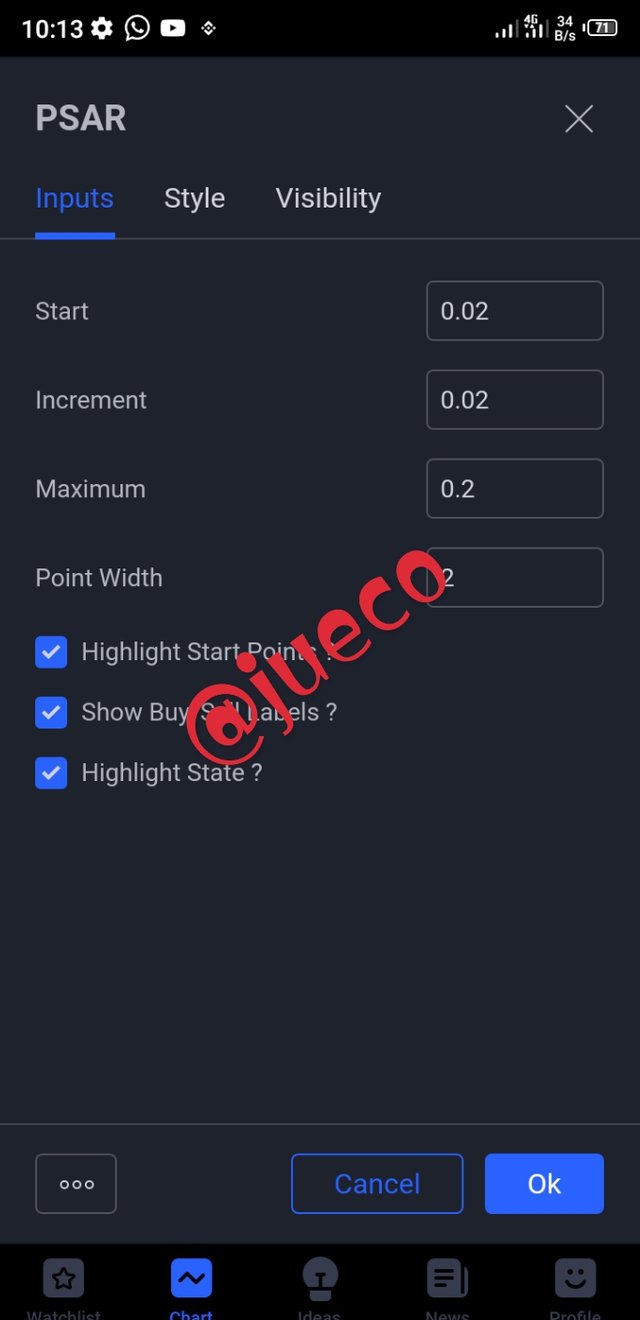
SCREENSHOT FROM TRADING VIEW
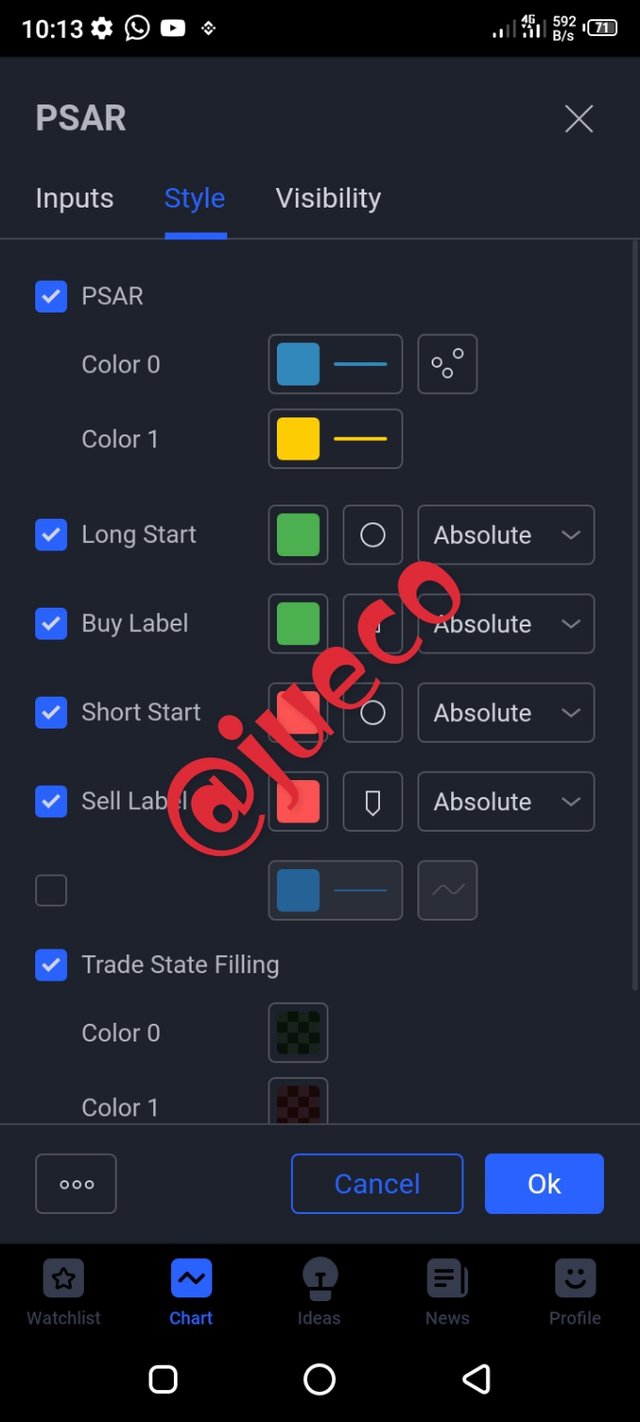
SCREENSHOT FROM TRADING VIEW
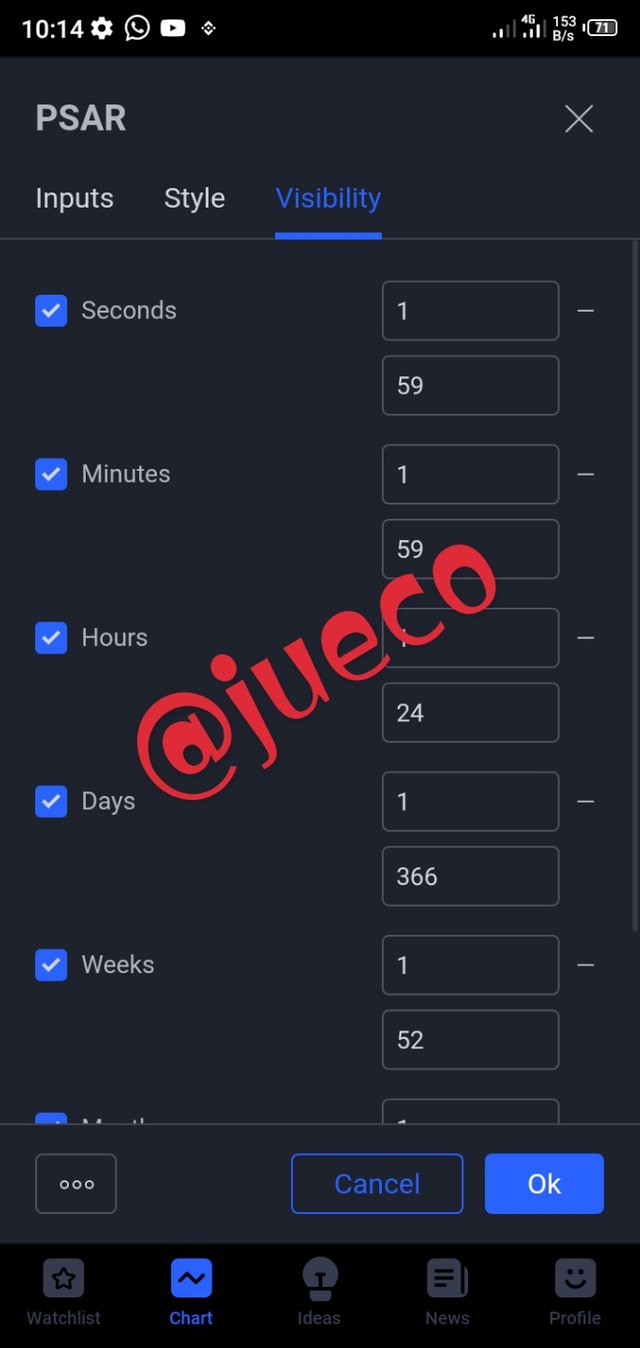
SCREENSHOT FROM TRADING VIEW
I also explored the configuration of the symbol and I configured some of the color
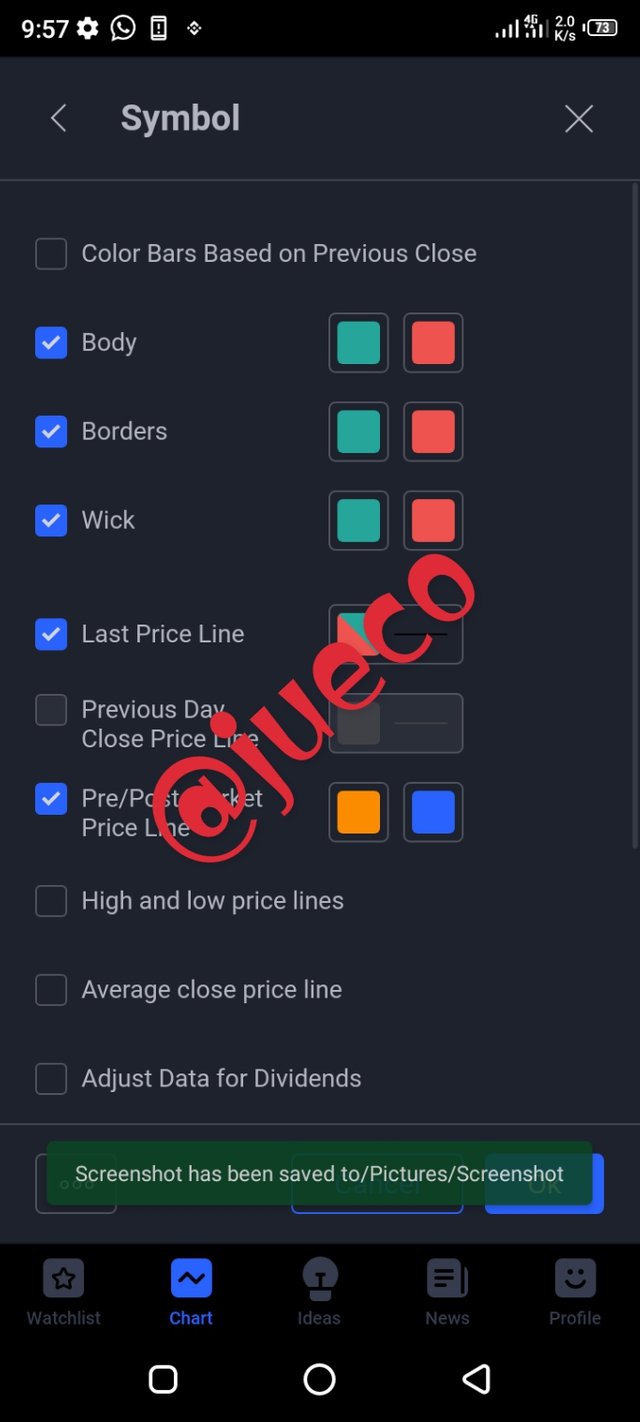
SCREENSHOT FROM TRADING VIEW
And below are the color changes in the chart
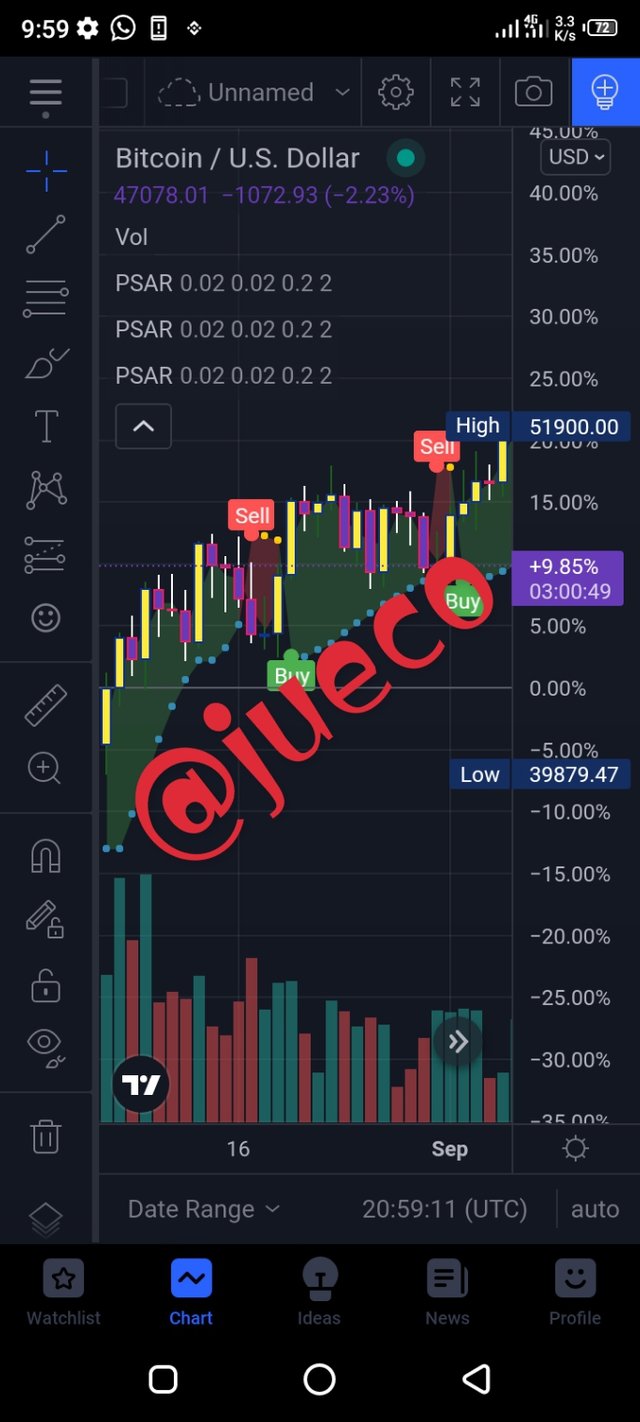
SCREENSHOT FROM TRADING VIEW
The above explained can also be done on Meta trader 5,
Visit the app and the below will be displayed
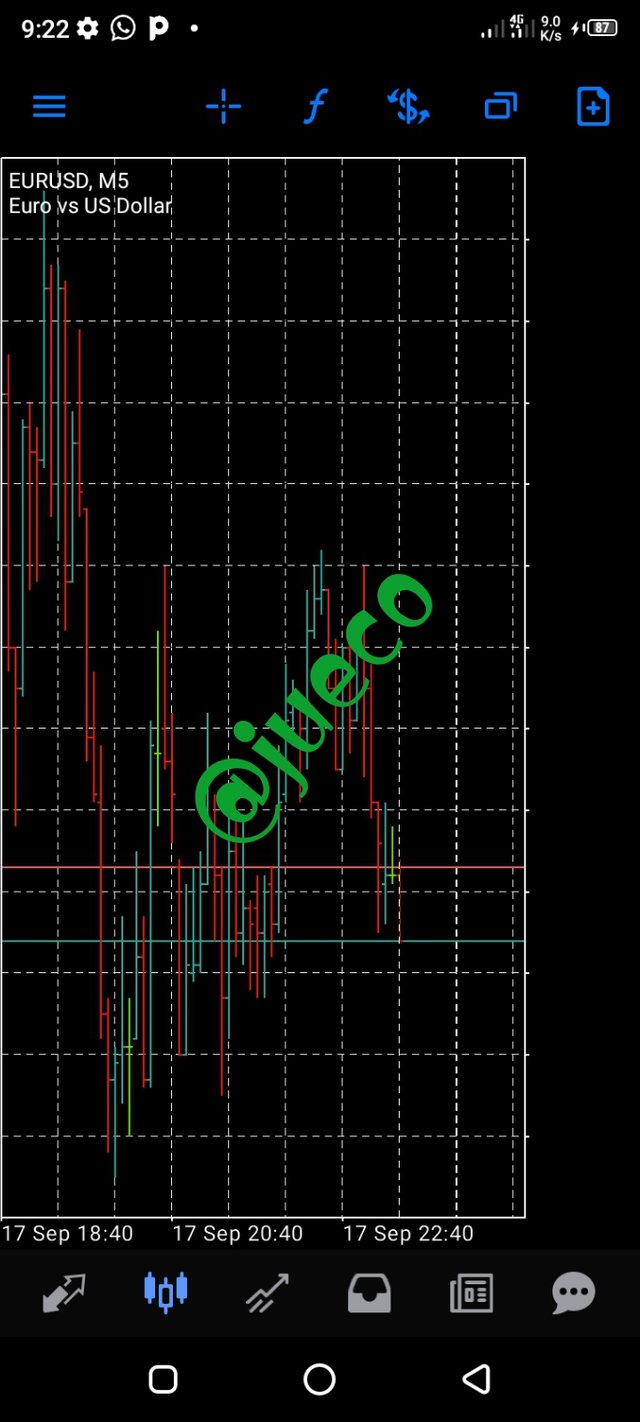
SCREENSHOT FROM MT5
I then click on the icon labelledf and a list of indicators appeared and I clicked on parabolic sar and it was applied.
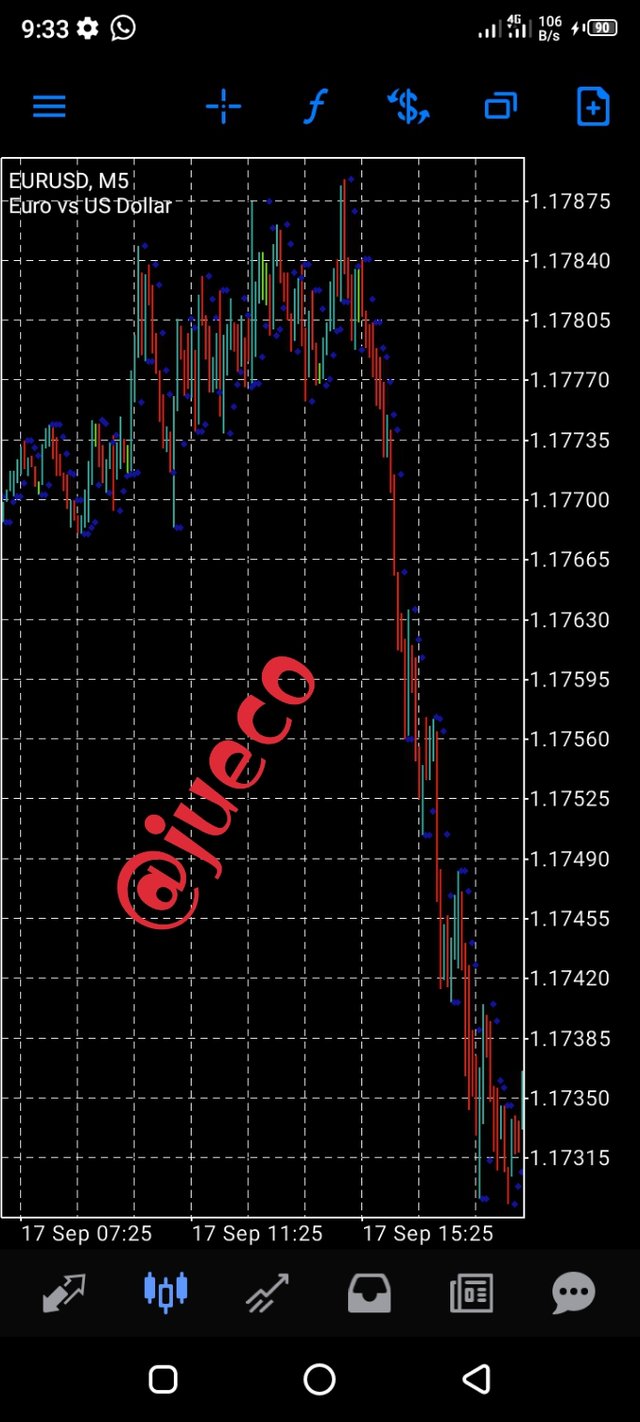
SCREENSHOT FROM MT5
And I went to settings to configure some of the things on the chart most especially the colors
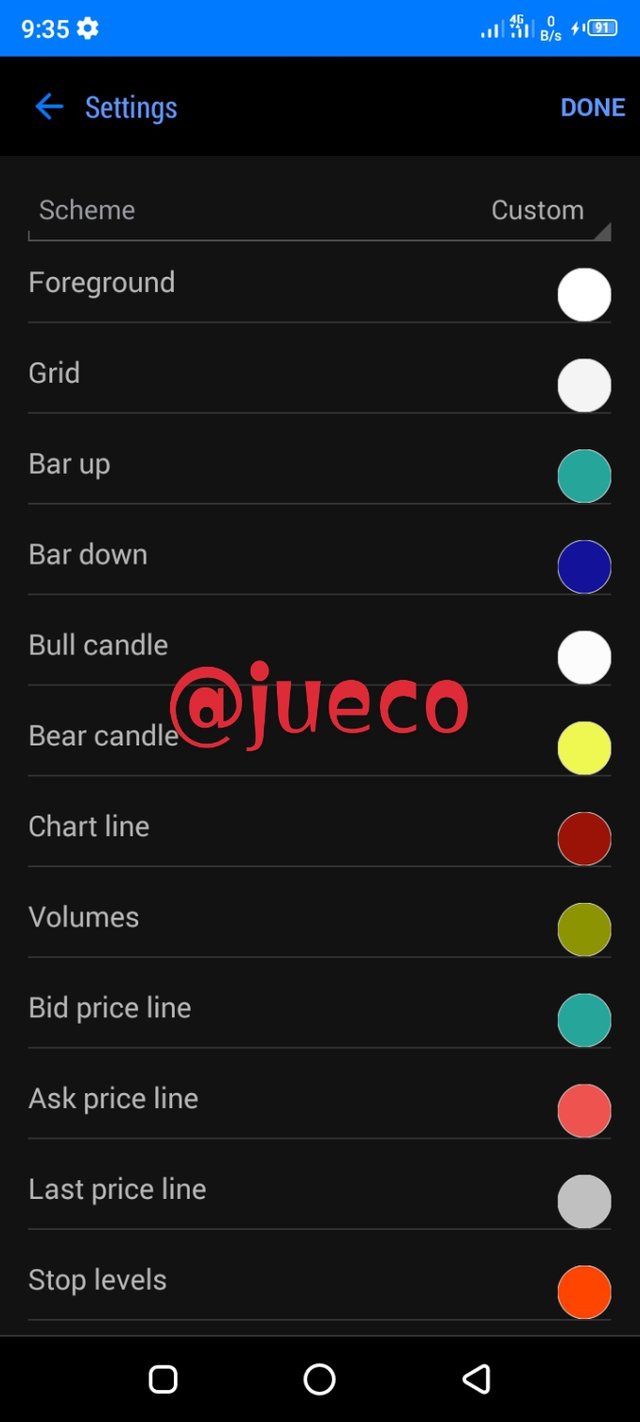
SCREENSHOT FROM MT5
And below are the color changes on the chart
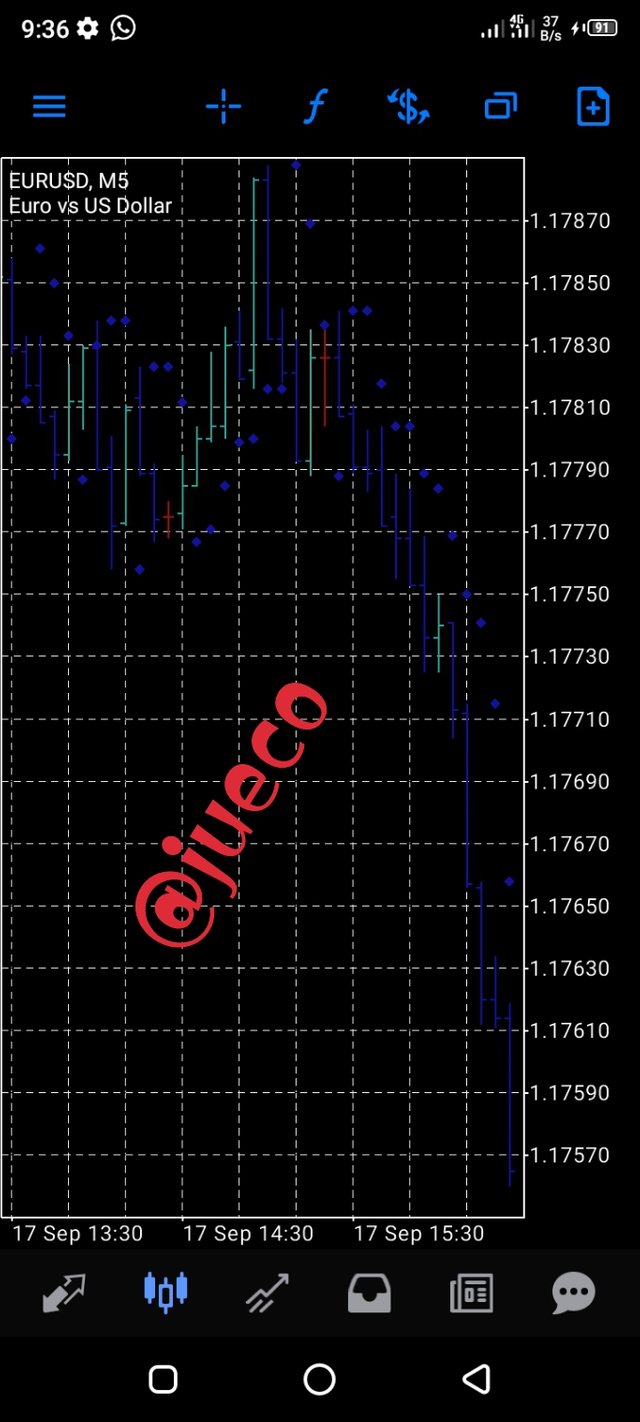
SCREENSHOT FROM MT5
Having explored and enjoyed the exploration, shall we proceed to the second task of the exploration.
EXPLAIN THE DIFFERENT CATEGORIES OF TECHNICAL INDICATORS AND GIVE AN EXAMPLE OF EACH CATEGORY.
ALSO SHOW THE INDICATORS USED AS AN EXAMPLE ON YOUR CHART
ALSO SHOW THE INDICATORS USED AS AN EXAMPLE ON YOUR CHART
As earlier stated, there are different types of technical Indicators and they are:
- Trend Indicators
- Oscillator Indicators
- Volatility Indicators
The above mentioned Indicators each possesses different categories of Indicators and all of these will be explored in our adventure.
TREND INDICATORS
As the phrase goes "the trend is your friend" the trend Indicators helps in the indication of the direction of a trend and it also informs a trader about the existence of a trend.
The trend Indicators provide assistance to traders that trade crypto currency pairs, either on an uptrend or downtrend move.
With the help of trend Indicators, a trader knows that the best period to enter the market and make profit is during an uptrend move.
Below are some examples of trend Indicators
MOVING AVERAGE INDICATOR:
SCREENSHOT FROM MT5
This is a tool that helps to average the pair's price of a crypto currency over a period of time
ICHIMOKU INDICATOR:

SCREENSHOT FROM MT5
This is a Japanese Indicator devised to act as a standalone Indicator.
It helps in the indication of the support/resistance level, it also indicates when a trend is reversed.
ADX INDICATOR:
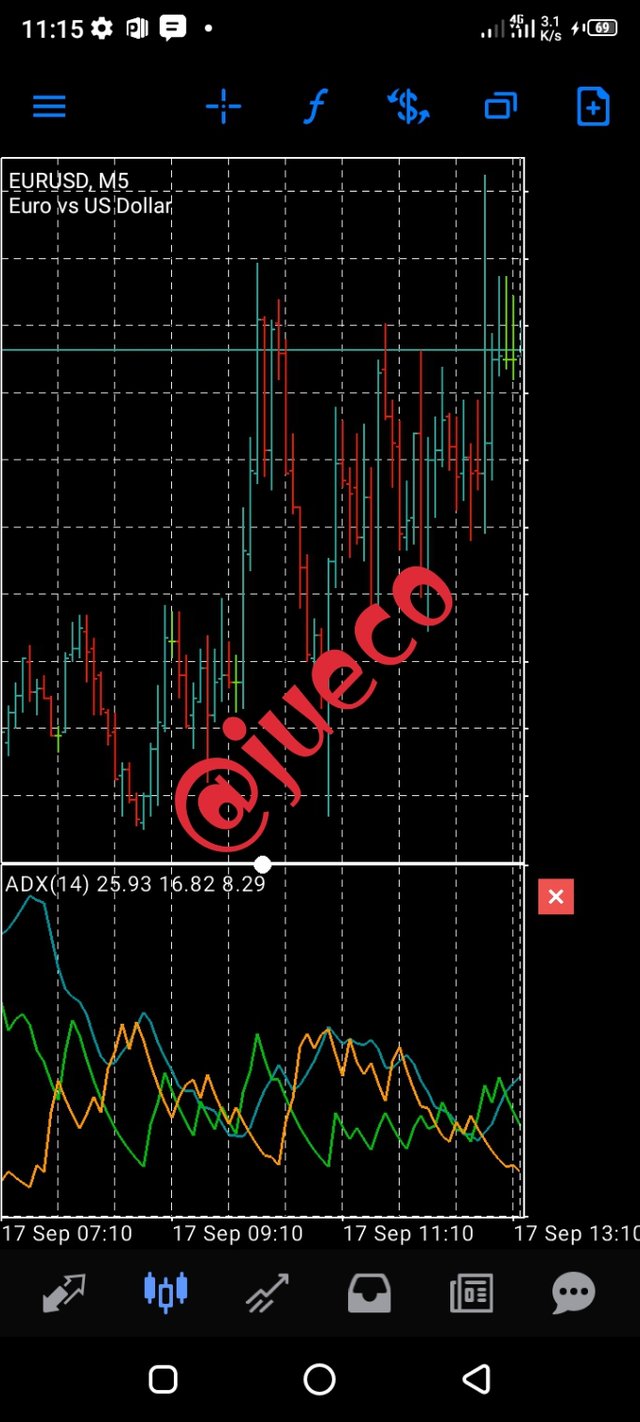
SCREENSHOT FROM MT5
The average direction index helps to indicate if a price is ranging or trending as it doesn't indicate an uptrend nor a downtrend
VOTALITY BASED INDICATORS
Votality Indicators plays a big role in the measurements of the magnitude of downswings and upswings of a cryptocurrency pair.
A cryptocurrency pair is said to be highly volatile when its price fluctuate wildly up and down and it is said to have low volatility when it doesn't fluctuate wildly.
Before opening a trade, it is of utmost importance to know the volatility of a cryptocurrency pair as this helps the traders in picking trade sizes and limit levels.
Below are the types of volatility based Indicators
BOLLNGER BAND INDICATOR:
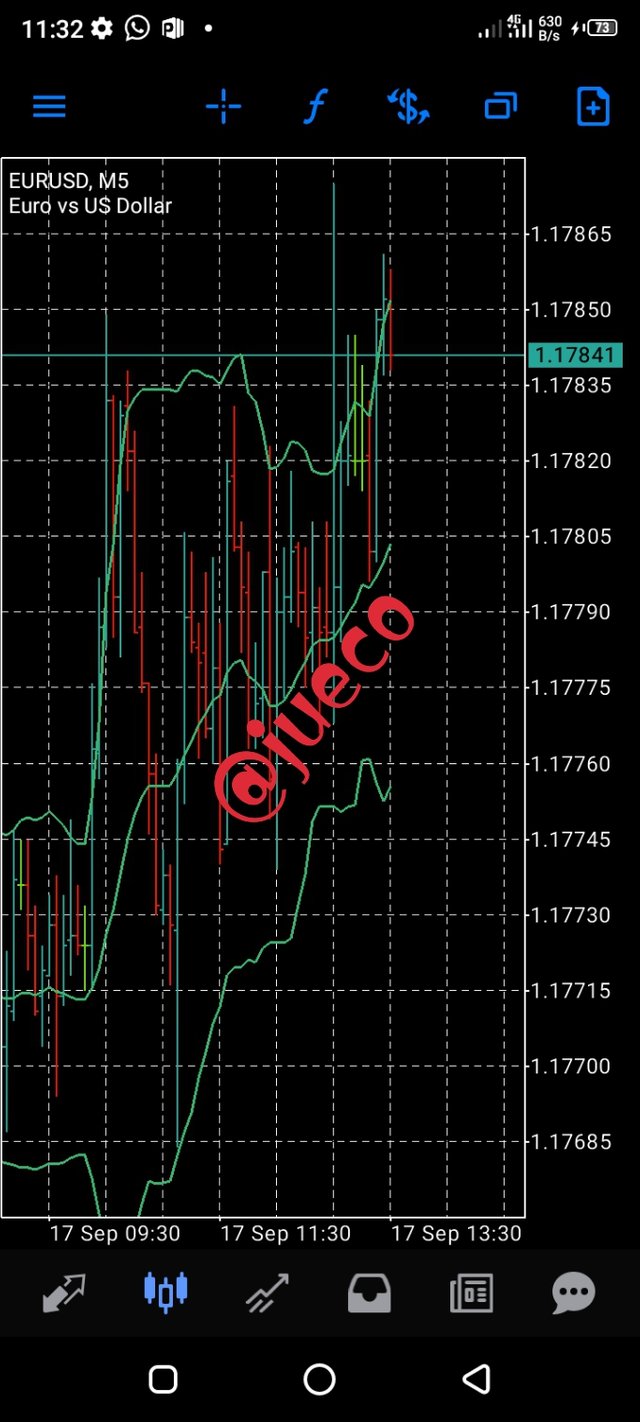
SCREENSHOT FROM MT5
The Bollinger band Indicator being a registered trademark of the popularly knownJohn Bollinger can be used across all pairs of cryptocurrency now matter their level of volatility.
This Indicators displays three lines on the price chart and this lines have their respective importance.
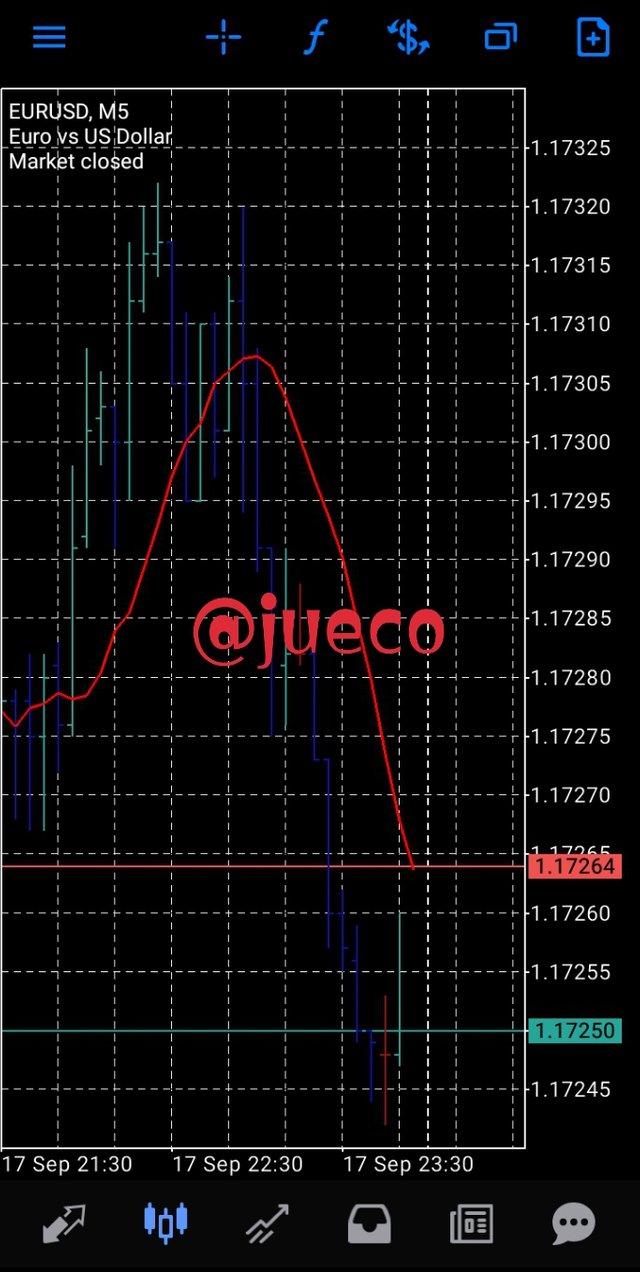
ATR INDICATOR:
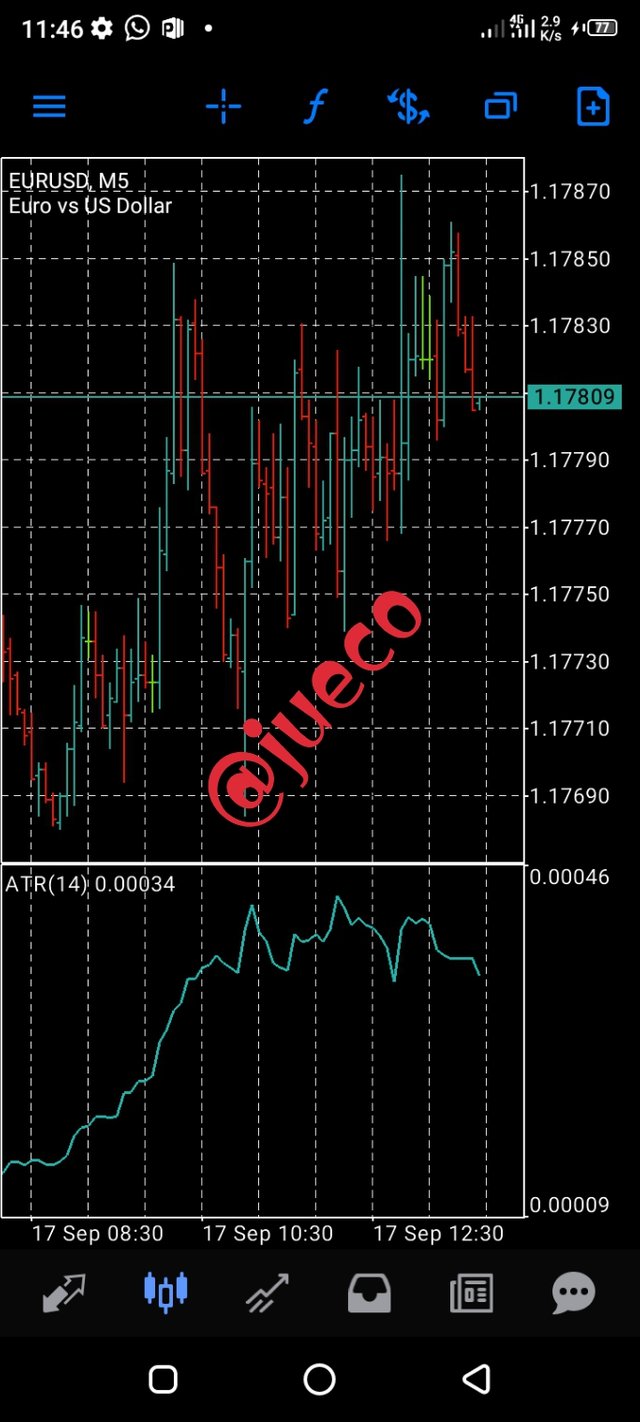
SCREENSHOT FROM MT5
The average true range Indicator helps in the indication of the average distance between the low price and the high price over the last 14bars.
Just as the word range indicates the difference between the highest value and the lowest value of a commodity
OSCILLATOR INDICATORS
The oscillator Indicator is sometimes called the momentum based Indicator because it enlightens a trader on the development of a cryptocurrency pair.
Before the commencement of a trade, a trader needs to wait for a genuine signal because when an indicator gets to an 'oversold' / 'overbought' level, it does not literally indicate a top or a bottom as oscillator can remain at extreme levels for a long time.
Below are some examples of oscillator Indicator
RSI INDICATOR:
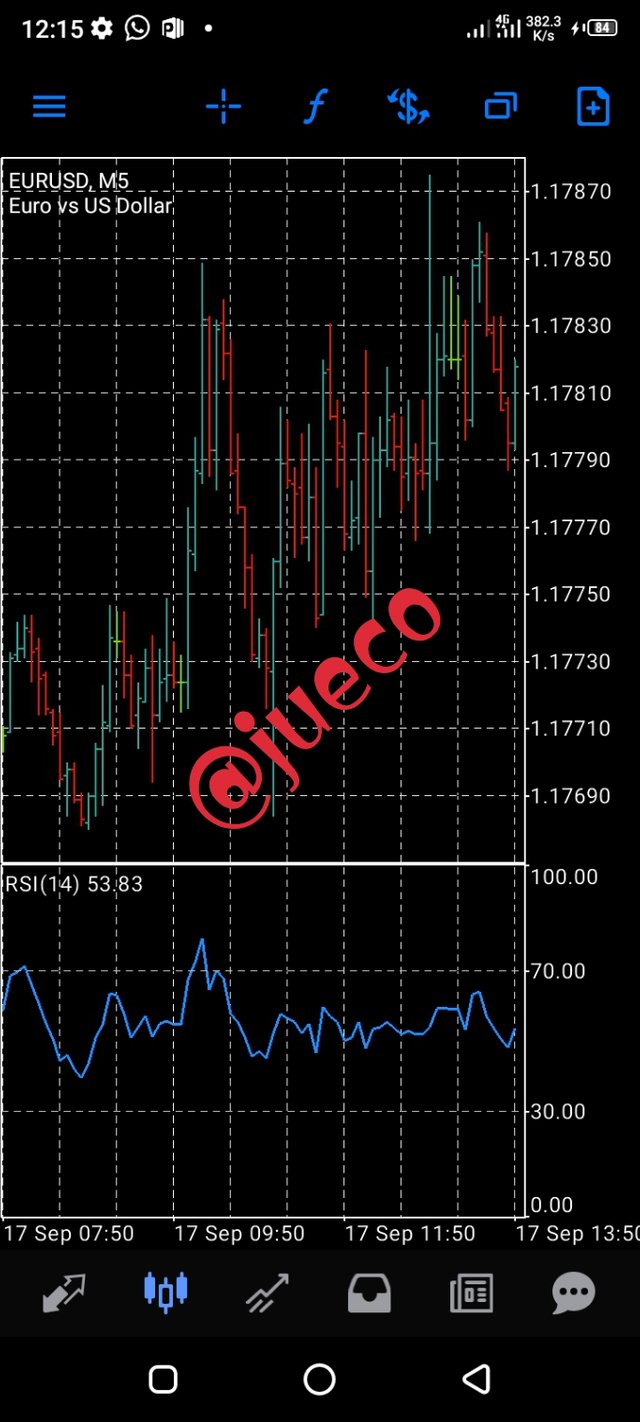
SCREENSHOT FROM MT5
The relative strength index is the most frequently used oscillator as it comprises of the ratio between average loss and average gain of a market over the last 14periods.
STOCHASTIC INDICATOR:
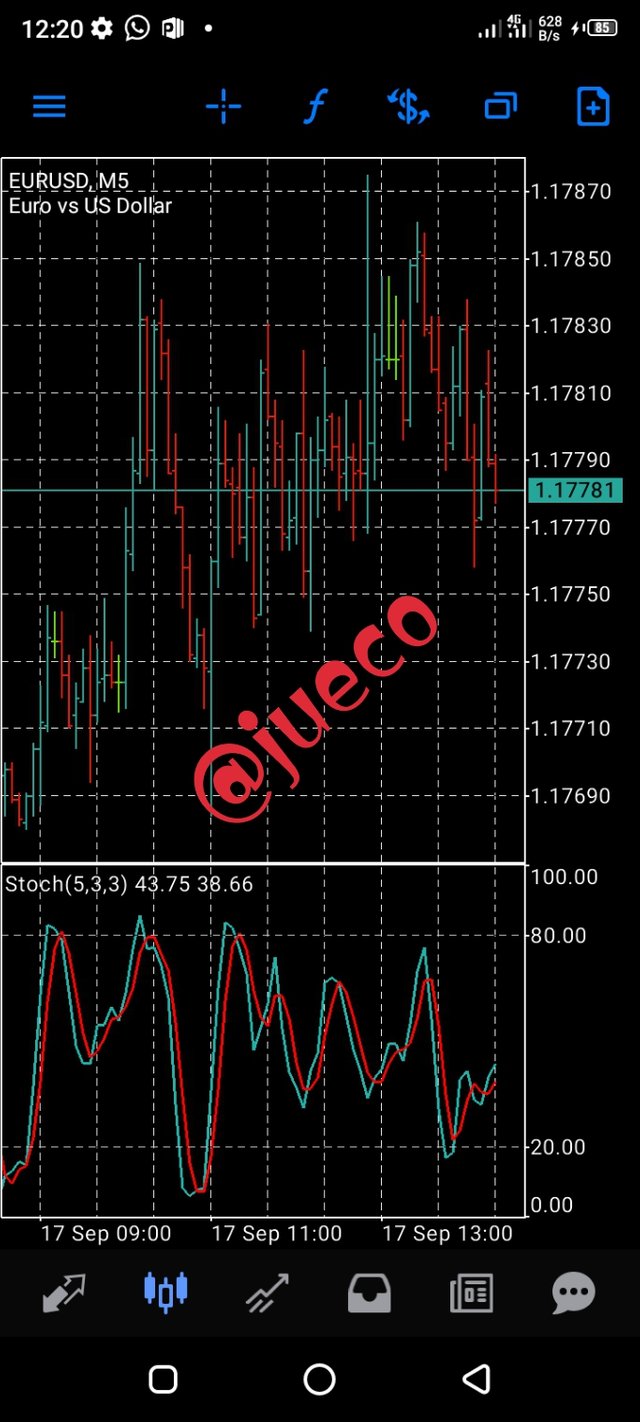
SCREENSHOT FROM MT5
The stochastic Indicator helps to track the distance/gap between the current price and the lowest low of a given number of periods.
CCI INDICATOR:
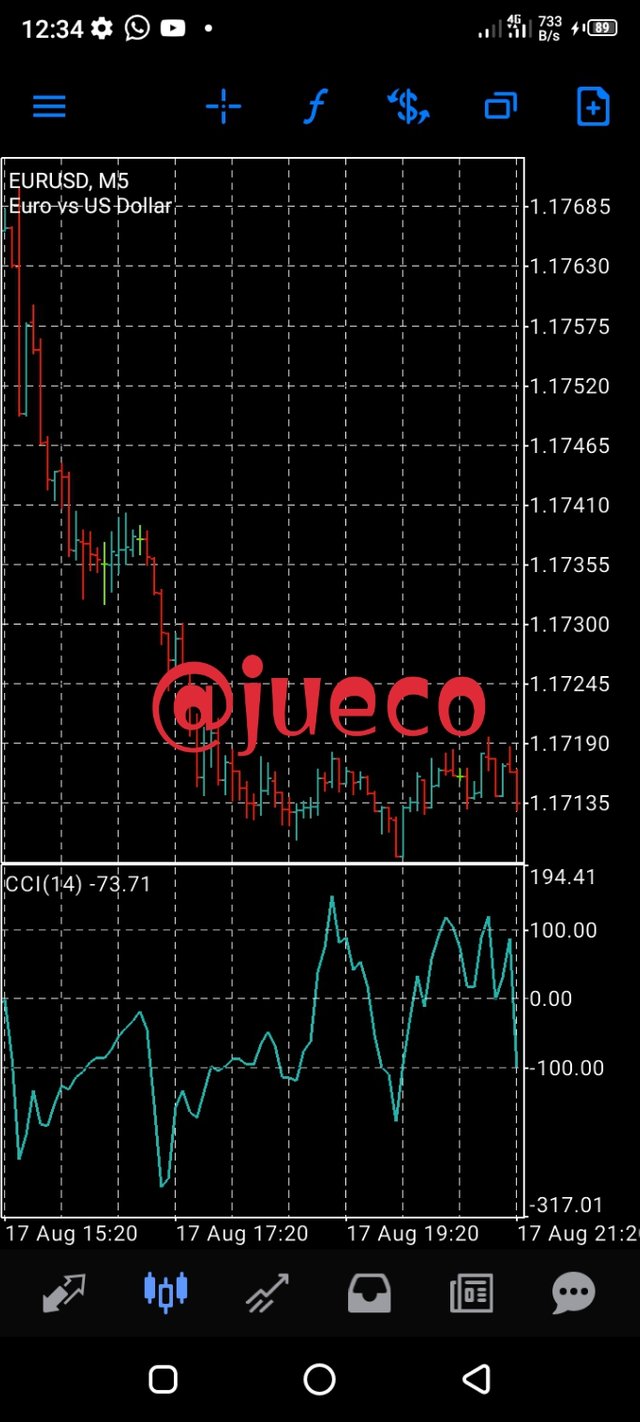
SCREENSHOT FROM MT5
CCI which stands for commodity channel index is an oscillator with no limit on how low or how high it can move.
As it makes use of 0 as a centerline alongside an oversold level beginning at –100 and an overbought level beginning at +100.
MACD INDICATORS:
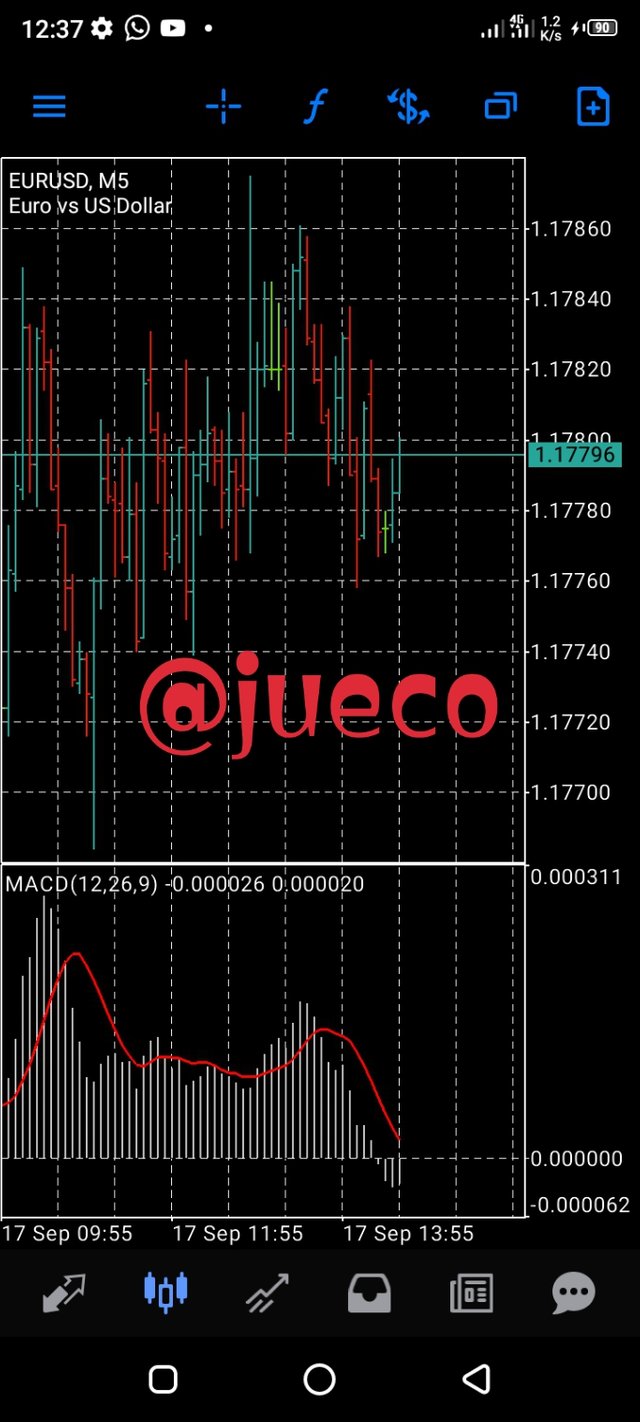
SCREENSHOT FROM MT5
The MACD Indicators play fully known as Moving Average Convergence/Divergence Indicator, helps in tracking the difference between 26EMA and 12EMA.
Having explored this fun-filled task, shall we proceed with immediate effect to the next task
BRIEFLY EXPLAIN WHY INDICATORS ARE NOT ADVISABLE TO BE USED AS A STANDALONE TOOL FOR TECHNICAL ANALYSIS
Undisputable, Indicators are not adviced to be used as a standalone tool for analysis because Indicators gives different analysis when used on different charts and this atimes leads to misinformation.
Also, there are diverse of Indicators with diverse of functions, if these Indicators should be mistaken for one another, it will give wrong analysis.
This is why the use of technical Indicators should be accompanied with the use of other technical analysis tools available.
Having gone past the above explained stage, shall we proceed to the final task of this very educative adventure.
EXPLAIN HOW AN INVESTOR CAN INCREASE THE SUCCESS RATES OF A TECHNICAL INDICATOR SIGNAL
To increase the success rate of a technical Indicator signal is not a hard task when compared to our previous fun-filled tasks.
The first thing an investor should ensure is that he is making use of the right Indicator, that is, making use of volatility based Indicator to measure the downswings and upswings of a pair of cryptocurrency not otherwise.
For if he uses a different Indicator such as trend based Indicator, he will get an inaccurate analysis.
Also, another thing he needs to do is to make use of more than one Indicator. I don't entirely different indicators, I mean he should make use of Indicators that belongs to the same category.
For example, the Bollinger band Indicator and Average true range Indicator.
CONCLUSION
Truthfully speaking, Indicators play a big role in technical analysis, as it helps to do a lot of things.
I thank Prof @reminiscence01 for using this lecture to remind us on the importance of technical Indicators, we really appreciate you, o Prof.
I eagerly anticipate your next lecture as it has always proven to be educative and fun-filled.
Please I urge all to feel free to visit my comment box on any question or addition as it will be highly appreciated.
Hello @jueco, I’m glad you participated in the 2nd week of Season 4 of the Beginner’s class at the Steemit Crypto Academy. Your grades in this task are as follows:
My Reviews and Suggestions:
You have completed the given task.
One of your explanations in questions 2.b and 2.c is too short, please try to give more explanation.
There are some grammars that are still wrong, please pay attention again.
Give some supporting pictures so that the task you love makes it look more interesting.
Thank you!
Pls o Prof @reminiscence01, with all due respect, it's been 4days since you rated my post and tomorrow will make my post 6days old and it hasn't been supported. Pls help me review before it pays out
CC:
@sapwood