Steemit Crypto Academy Season 3 Week 2 | Introduction to Charts
EXPLAIN THE JAPANESE CANDLESTICK CHART
Before I proceed further by providing answers to this thought provoking question, I will be delighted to shed more light on what a chart is.
A chart may be explained as a map or a table which makes use of pictures, graphs, symbols lines and diagrams to convey or communicate information of interest to it's viewers.
A chart is used in different aspects of life, to secondary school students, a chart is used to represent statistical data, and helps in calculating the mean, median, mode, mean deviation, variance and standard deviation of such statistical data.
In finance trading, a chart is used to reveal the movement in price [increase or decrease] of a given cryptocurrency over a given period of time. And this Charts makes it possible for technical analyst to make profit over a short term investment.
Just as there are different types of Charts to the secondary school students ( Charts such as barchart, piechart, histogram etc), in a like manner there are different types of price movement Charts in finance trading and some of which are; Line Charts, barchart, volume Charts, Renko Charts and the most frequently used the Japanese candlestick chart
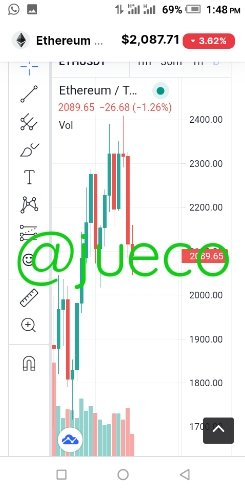
The Japanese candlestick chart is the most frequently used chart by technical analyst as it helps identity price actions and make profitable decisions based on a short term direction of prices.
The Japanese candlestick was invented by a rice trader named Munehisa Homma, he used the chart in the analysis of the futures of the price of his rice commodity.
The most reliable candlestick patterns are
- Single candlestick patterns ( which includes Doji, hammer, inverted hammer, shooting star, Marubozu and spinning tops)
- Double candlestick patterns ( which are the bullish and bearing engulfing, Tweezer top and bottoms)
DESCRIBE ANY OTHER TWO TYPES OF CHARTS
As mentioned earlier, there are lots of Charts that can be used in the analysis of trading among which are; linechart, barchart, volume chart etc. But I will be describing the line chart and barchart
Line Charts:

Source
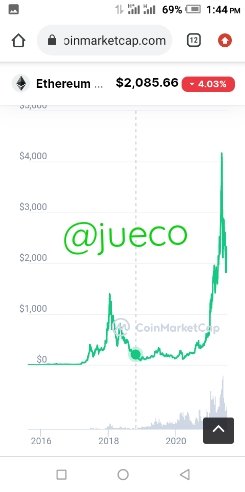
The line chart as the name implies is a trading diagram that uses a single line, drawn from left to right to connect prices. It is a very simple chart to use as it is simple to understand.
Barchart
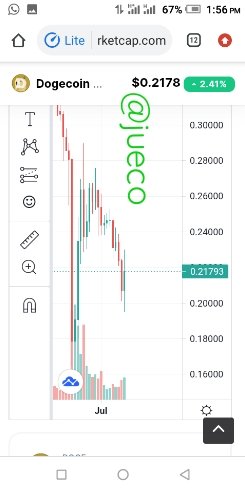
The barchart is different from the line chart in the sense that the barchart uses bars instead of lines to connect prices from the left to the right of the chart.
The bar in a price barchart shows red If the closing price of a commodity is lower than it's opening price. And shows green when the closing price is higher than the opening price .
Whenever a bar shows red, it is termed a bearish market and whenever it is green, it is termed a bullish market
IN YOUR OWN WORDS EXPLAIN WHY THE JAPANESE CANDLESTICK CHARTS IS MOSTLY USED BT TRADERS
The Japanese candlestick is commonly used because of how it displays the interaction between sellers and buyers alongside the market trend
The Japanese candlestick shows the opening, closing, high and low prices of the day, this makes it easily understood with just a glimpse.
The colour change in the Japanese candlestick makes it very easy for analyst to distinguish between a bearish and a bullish market
It give a more analytical and accurate information on the changes in price of a given commodity
DESCRIBE A BULLISH CANDLE AND A BEARISH CANDLE IDENTIFYING ITS ANATOMY
BULLISH CANDLE
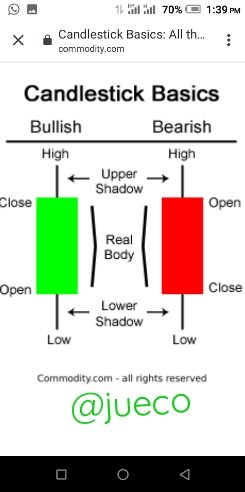
A bullish candle is said to appear when the closing price of a commodity is higher than its opening price, and it is usually green or white in colour.
There are other technical took that can be used to validate the pattern of a bullish candle and they are volume indicators, trendline etc.
BEARISH CANDLE
A bearish candle is said to appear when the closing price is lower than the opening price, and it is usually red or black in color. A bearish candle depicts a fall in price over a given period.
From the analysis of the bullish candle from the screenshot above, we can see the bullish candle labeled; open, close, low,high.
- The open label indicates the opening price of the commodity
- The close label depicts the closing price of the commodity
- The high label explains when the price of the commodity is high and
- The low label shows when the price of the commodity is low.
The same explanation goes to the bearish candle, but if we observe the diagram of those candles critically, we would observe that there's a change in the position of the opening and closing price of the candles.
This explains that in a bullish candle, the opening price is lower than the closing price, and it indicate a rise in price of a commodity, likewise that of the bearish candle indicates that the opening price is higher than the closing price.
CONCLUSION
The Japanese candlestick Charts is indeed a very important charts as it aids easy analysis of trading a commodity.
I will love to express my gratitude to my able professor @reminiscence01 for this great lecture. I look forward to participating in the next assignment that will be given by him.


Hello @jueco, I’m glad you participated in the 2nd week of the Beginner’s class at the Steemit Crypto Academy. Your grades in this task are as follows:
Observations:
This is not a bar chart.
Recommendation / Feedback:
It's disappointing that you wrote your assignment from other users posts. From your explanations and the graph you provided, it is proved that you didn't read the lesson.
Thank you for performing this homework task.
Thank you very much Prof @reminiscence01 for the corrections.
And I sincerely apologise for making my assignment from other users' post. Not justifying my actions, but it was because I had little difficulty in understanding some key points from your lecture and I promise that this with never repeat itself. Please accept my sincere apology 🙏🙏.