[Crypto Trading by Identifying Support and Resistance] - Steemit Crypto Academy | S6W3 | Homework Post for professor@shemul21

Hello crypto friends, I am happy to welcome you to the third week of Season6 of the steemit crypto academy.
This week we shall be learning from professor @shemul21, and we shall be learning on resistance and support levels, join us as we embark on this lovely journey.
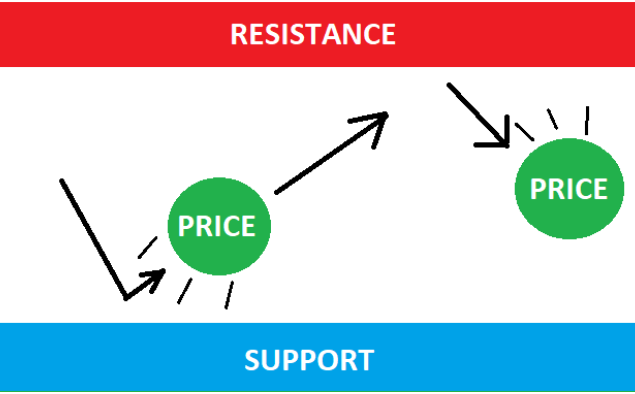
What is the Support & Resistance zone?
The concept of resistance and support zones are situations where there is a pause in the market, a condition where either buyers or sellers are about to take over the market.
They are key concepts that assist traders to analyze and understand the market conditions, hereby making good trading decisions.
It assist traders to make effective entry and exit position in the market. It also help them discern where to place their stop loss and take profit inorder to minimize risk and maximize profit.
Support and resistance is a basic, yet one of the most powerful trading techniques used by traders in technical analysis.
Infact, other trading analysis rely on the use of resistance and support levels techniques, Analysis such as:
Wedge pattern, Flag pattern, double top, double bottom, Qml and even some indicators as moving average, bollinger band etc.
SUPPORT LEVEL
The support level can be explained as a region on a chart where the price of a market has fallen to, but finds it difficult to break below.
It is sometimes illustrated with an horizontal line below the price.
Whenever a price hits a strong support, it is more likely to be rejected, do you know why?
Join me as we unveil the reason
The reason happens to be the fact that the support zone is a price level where there's a strong demand (buying power) which is strong enough to stop the further declination in price of the market.
The main concept behind the support level is that, the closer the price gets to the support level, the cheaper the commodity becomes, and the buyers see this as a good buying opportunity to buy more of that commodity.
And sellers, on the other hand, loose interest in selling because, selling at a low price is a big lose to them.
And with that being the case, the bulls will take over the market, hereby preventing it from falling in price.
A support zone can be confirmed when there are multiple price touches on the zone and the price finds it difficult to break below it.
A support zone is usually stronger when it is analysed with an higher time frame. Let's say, the higher the time frame, the stronger the support formed.
A support line is formed by connecting the previous lows of the price data of a market.
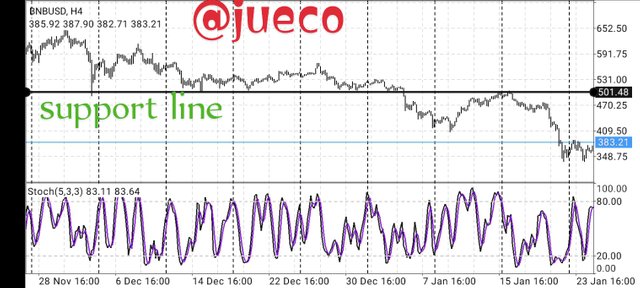
SCREENSHOT FROM MT4
The above screenshot is a chart of the pair BNBUSD on a 4 hour time frame.
Recall, the higher the time frame, the more valid the support will be.
As seen above, the price maintained a strong support at a price of $501.48, which the price was unable to break freely, and this is because of the pressure mounted by the buyers.
RESISTANCE LEVEL
The resistance level can be explained as a region on the price chart where the price of the market has risen to, but having a difficulty to break above it.
The resistance level is sometimes denoted with an horizontal line drawn above the price chart, in that whenever the price touches the resistance level, it gets rejected, depending on the pressure of the sellers.
The resistance level can also be explained as a price level where there's a strong supply (selling power) which is strong enough to stop the further increment in price of the market.
The concept behind the resistance level is that, the closer the price gets to the resistance level, the more expensive the price becomes, hereby giving the sellers a good opportunity to sell off their assets and make profit, thus leaving the buyers handicapped, as they cannot buy at a very high price.
With this condition, it is plainly seen that the bears will take over the market, preventing any further rise in the price of the market.
A resistance zone is usually confirmed when there are multiple price touches on the zone, and a strong resistance is gotten from a higher time frame.
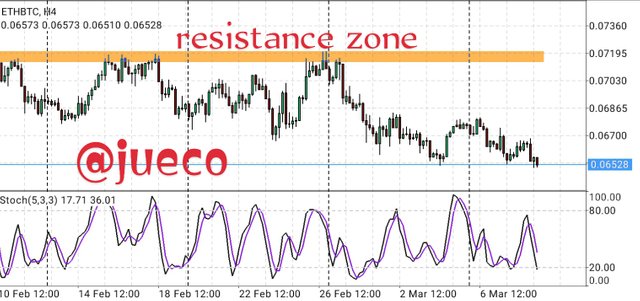
SCREENSHOT FROM MT4
The above screenshot is a chart of the of the pair ETHBTC on a 4hour time frame
As seen above, my resistance line is formed from the several touches the price had on the zone, and on a high time frame.
Explain different types of Support & resistance with proper demonstration.
Explain different types of Support & resistance with proper demonstration.
The ability of other technical Indicators to make use of the principle of resistance and support line is due to the diversity in types of the resistance and support line.
In a sentence, there are several types of resistance and support zones used in technical analysis, they are:
- Horizontal support and resistance
- Diagonal levels of support and resistance levels
- Dynamic support and resistance zones.
HORIZONTAL SUPPORT AND RESISTANCE LEVEL
The horizontal support and resistance level has the same working principle of a normal resistance and support levels known.
In fact, it is the most popularly known, commonly used, and easily understood resistance and support technique.
The horizontal support and resistance levels as the name implies, consist of horizontal lines which act as the support and resistance.
The horizontal line helps to connect previous price point on a chart, for example, the horizontal support line helps to connect previous lows of a chart which the market struggles to break below, and the horizontal resistance line helps to connect previous highs which the market is struggling to break above.
For an horizontal support and resistance level to be valid, it should be analysed on different time frame.
The horizontal resistance, when broken, acts as a strong support, likewise a strong horizontal support, when broken, acts as a strong resistance.
For example, in a bullish trend, when a strong horizontal resistance line is broken, the broken resistance line now acts as a strong support to the price.
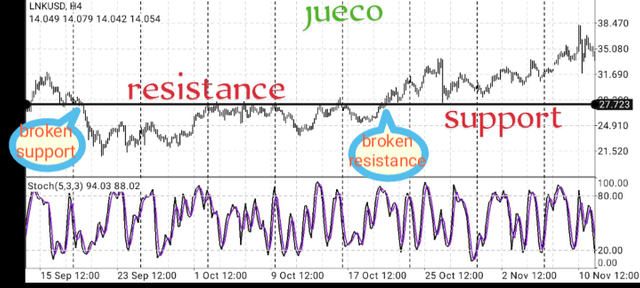
SCREENSHOT FROM MT4
The screenshot above that illustrates all I have said is a chart of the pair LINKUSD on a 4 hour time frame.
As seen above, the price first broke below its support line, which then turned to a strong resistance.
Then it made several touches on the resistance line which it could not break, then the buying pressure became much and it finally breaks the resistance line, and now the broken resistance line acts as a strong support once again.
Likewise in a downtrend, the broken support level turns out to be a strong resistance level.
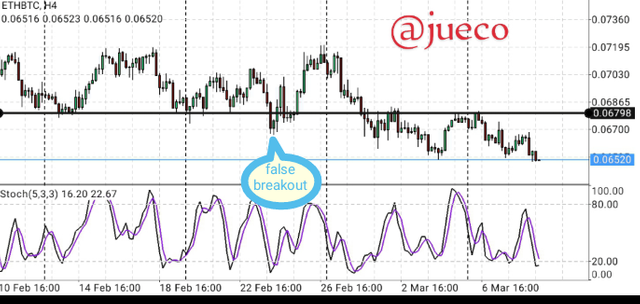
SCREENSHOT FROM MT4
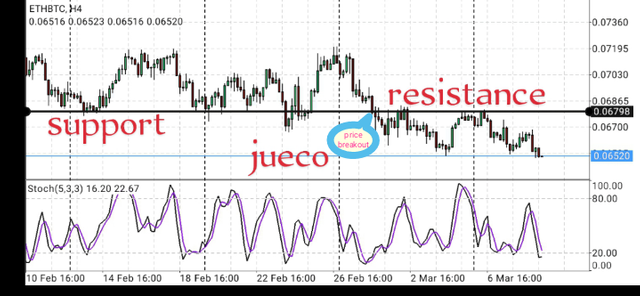
The above screenshot is a pair of ETHBTC on a 4hr frame.
As seen above, the price was having difficulty in breaking it's strong support at 0.06798, although there was a false breakout, then it finally broke the strong horizontal support line, which now acts as a strong resistance level.
DIAGONAL SUPPORT AND RESISTANCE
The diagonal support and resistance levels which is also known as a sloping levels or trendline resistance and support levels is another very important and effective trading strategy.
As the name implies, the diagonal support and resistance levels comprises of diagonal lines which act as the resistance and support line.
These diagonal lines help to connect previous price levels on a chart and they help a trader to determine the next direction of the market.
This pattern is different from the horizontal resistance and support lines, in the sense that, it's support and resistance lines are always slopy, drawn diagonally.
The sloping resistance and support line can be used to identify trend continuation and trend reversal.
In a bullish trend, this pattern is formed by the connection of higher highs and higher lows which forms the resistance and support line respectively.
Whenever the price breaks above the slopy resistance line, and then retrace back to retest the broken resistance line, it is signaling a Bullish trend continuation.
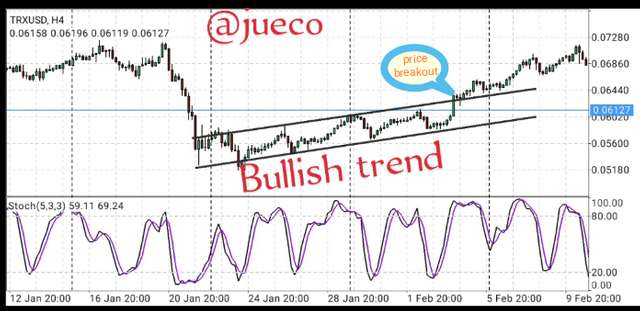
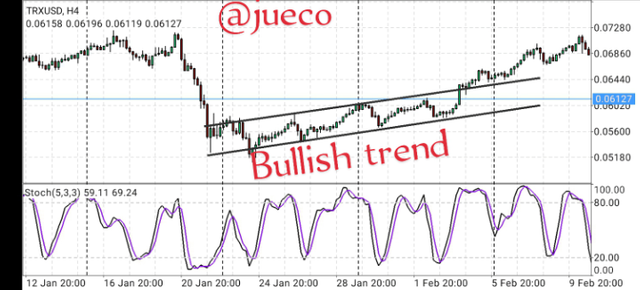
SCREENSHOT FROM MT4
The above screenshot is a chart of TRXUSD on a 4hr time frame, and as seen above, the price broke above it's diagonal resistance, and then retested the broken resistance, which is now a support, thus indicating a trend continuation
Likewise, whenever the price of a bullish market breaks below its support line, and retest it, it is signaling a trend reversal.
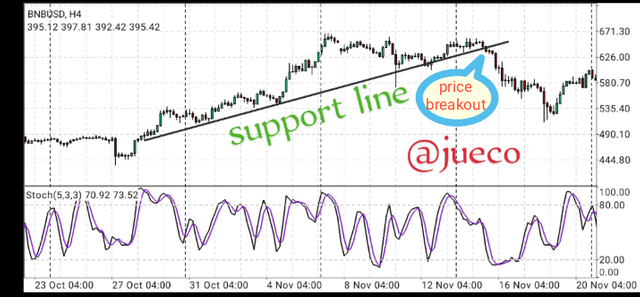
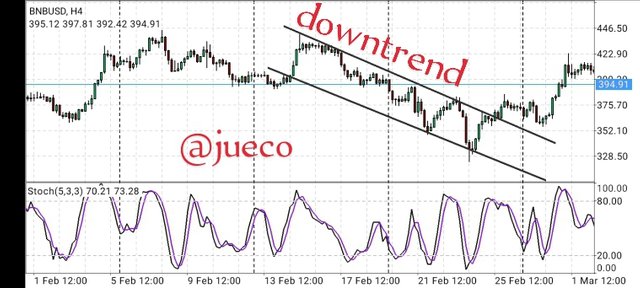
SCREENSHOT FROM MT4
The above screenshot is that of BNBUSD on a 4hr time frame, and as seen above, the price broke below its diagonal support line, thus indicating a trend reversal.
In a bearish trend, this pattern is formed by connecting lower lows and lower highs by diagonal lines which is known as the support and resistance line respectively.
Whenever the price breaks below the support in a bearish, it is signaling a bearish trend continuation.
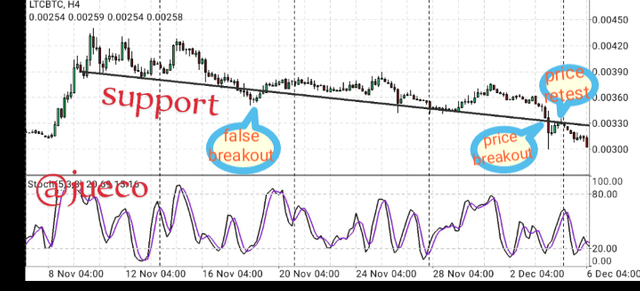
SCREENSHOT FROM MT4
As seen above, is a screenshot of the pair LTCBTC on a 4hr frame.
As shown above, the price broke below its support line, then retested the broken line which is now acting as a resistance, thus signaling a bearish trend continuation.
Also, whenever the price breaks above its resistance line in a bearish market, it is signaling a bullish trend reversal.
SCREENSHOT FROM MT4
The above screenshot is that of BNBUSD on a 4hr frame.
And as seen above, the price after making several touches on the resistance line, finally broke above it, thus indicating a bullish trend reversal signal.
DYNAMIC RESISTANCE AND SUPPORT LEVELS
The dynamic Support and resistance follows the normal working principle of a support and resistance, in that the price reverses when it hits a strong support or resistance line.
With the dynamic Support and resistance, a trader doesn't have to go through the stress of locating the support and resistance zones, as they are usually located with the help of technical Indicators.
The Identification of a resistance and support line using this strategy can only be done with the help of technical Indicators like moving average, RSI, bollinger band etc.
Let's consider the example of a moving average Indicator, whenever the market is in an uptrend, the moving average is always found below the prices, acting as a dynamic Support to the prices.
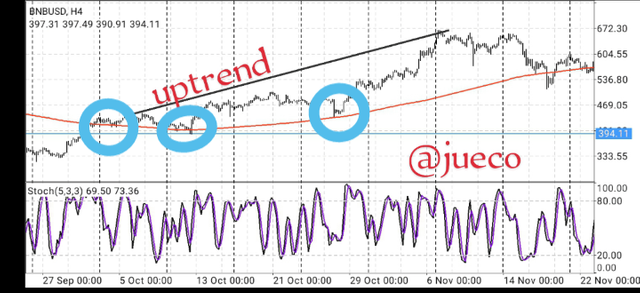
SCREENSHOT FROM MT4
The screenshot above is that of BNBUSD, and as seen above, the market was recovering from a downtrend and then it broke above the 200SMA line which was acting as a dynamic resistance, then as the market continued in an uptrend, the 200SMA line acted as a dynamic support to the price.
Likewise, when the market is in a bearish trend, the moving average is always located above the price, hereby acting as a dynamic resistance to the price.
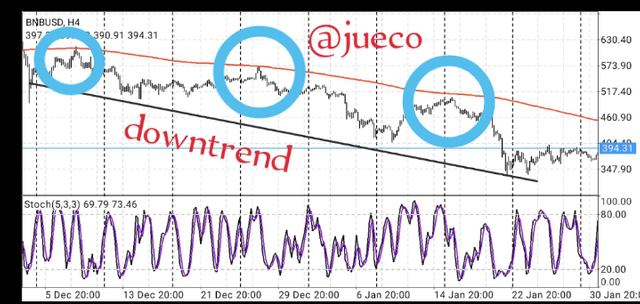
SCREENSHOT FROM MT4
The screenshot above perfectly explains a dynamic resistance in a bearish trend.
As seen above, the market is experiencing a bearish move with the 200SMA acting as a dynamic resistance to the price.
Also, the bollinger band Indicator also makes use of the principle of resistance and support line.
The bollinger band consist of three bands; the upper band, the middle band and the lower band.
With the middle band acting as a Support and resistance line and the upper band acting as a strong resistance line and the lower band acting as a strong support line.
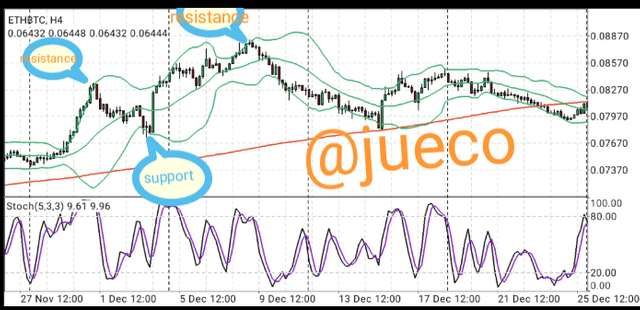
SCREENSHOT FROM MT4
The above screenshot is a chart showing the application of a bollinger band and its dynamic support and resistance levels.
As seen above, the first band acts as a very strong resistance, and whenever the price hits it, it is always rejected.
Also, the third band acts as a strong support and whenever the price nears it, it's always ready to project upwards.
Identify The False & Successful Breakouts. (demonstrate with screenshots)
Inorder for us to understand what a false breakout is, we need to first understand what a breakout is.
A breakout can be explained as a condition whereby the price moves through a resistance/support line and continues moving in that direction.
A false breakout on the other hand, can be explained as a condition where by the price of a commodity moves through it's resistance/Support level but fails to continue in that direction.
As traders, one of the things we cannot avoid in trading is false breakout/signals but they can be carefully filtered.
It is also good to note that there is a difference between a false breakout and a price retest.
A retest is said to occur when the price moves back to its previous support/horizontal level inorder to gather strength to project forward, while a false breakout is when the price fails to continue in the direction of its initial breakout.
A false breakout explains that the buying interest in the market was not strong enough to continue pushing the price above the broken resistance line and also the selling interest was not strong enough to keep the price going below the support line.
SCREENSHOT FROM MT4
The screenshot above shows a false breakout on the pair ETHBTC on a 4 hour time frame.
As seen above, the price failed to continue moving in the direction of its breakout, instead it moved in the opposite direction.
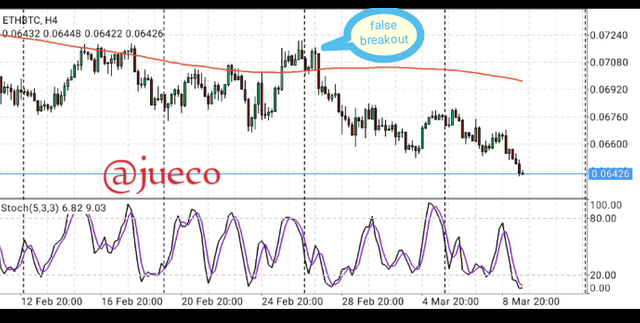
SCREENSHOT FROM MT4
The screenshot above is also that of ETHBTC, showing a false breakout with the use of dynamic support and resistance.
As seen above, the price made several touches on the moving average, then it broke it and then failed to continue in the broken direction.
SUCCESSFUL BREAKOUT
Successful breakout, as expected, is the opposite of false breakout.
A successful breakout is said to occur when the price passes through the resistance or support line and continues moving in that direction.
Successful breakout is usually characterized into two based on their functions, they are:
- Trend reversal breakout
- Trend continuation breakout
TREND REVERSAL
The trend reversal breakout is characterized a trend reversal breakout because it occurs in a reverse direction of the previous trend.
For example, if a market is in a bullish move, comprising of higher lows and higher highs, then it fails to make new highs, and then break below its support level, that breakout below its support level is known as a breakout, as it signals a trend reversal
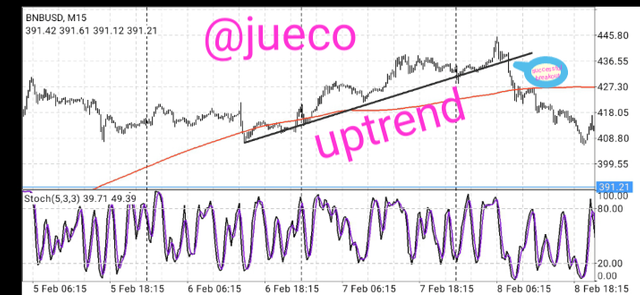
SCREENSHOT FROM MT4
The above screenshot is that of the pair BNBUSD, it is a chart showing an uptrend, comprising of higher highs and higher lows, and then it failed to form new highs, it also proceed to break below its support line, indicating a bearish trend reversal.
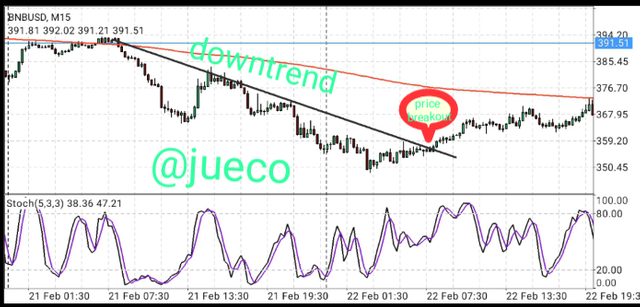
SCREENSHOT FROM MT4
. The above screenshot is a chart of the pair BNBUSD on a 15mins time frame.
As seen above, the market was in a bearish trend, forming lower lows and lower highs, then it failed to form new lows and began projecting upwards to its resistance level, then it broke it resistance level, indicating the confirmation of a bullish trend reversal
TREND CONTINUATION BREAKOUT
Trend continuation breakout is unlike trend reversal breakout, in that, it is one that occurs in an existing trend and signals the continuation of the trend.
For example, if the trend is in a bullish move and it breaks above its resistance line, it can be characterized as a trend continuation breakout as it signals a trend continuation.
SCREENSHOT FROM MT4
The above screenshot shows a chart of the pair TRXUSD on a 4hiyr time frame.
As seen above, the market was in an uptrend, comprising of higher highs and higher lows, then it continues upward and breaks its resistance line, thus indicating a trend continuation.
Use Volume and RSI Indicator Combined with Breakouts & Identify the Entry Point. (demonstrate with screenshots).
This task requires me to make use of my RSI, alongside my volume indicator to analyze and identify a good entry point.
First, we need to understand that RSI Indicator plays a major role in identifying overbought and oversold regions in a chart.
When RSI Indicator is in an overbought region, it is signaling a bearish trend reversal and when it is in an oversold region, it is signaling a bullish trend reversal.
Inorder to perform this task, I picked a crypto pair of my choice, I then identified its support and resistance line.
After that, I noticed that the market was ranging, then it broke below its support line and then retraced to retest the broken support which is now acting as a strong resistance.
This is a confirmation signal for a bearish move.
I then added my moving average Indicator, the moving average was initially below the price, acting as a support to the price.
Then the price broke below the moving average, and then retrace to retest the moving average at the same point of my initial signal.
I then took this as the second confirmation to enter the trade.
But then, I added the RSI Indicator and it was in an overbought region of 80, signaling a bearish trend reversal.
With these confirmations, I entered a trade on the pair TRXUSD, on a 30mon time frame.
I placed my stop loss above the previous resistance line and my take profit was placed close to my closest support line.
All I explained can be seen in the screenshot below
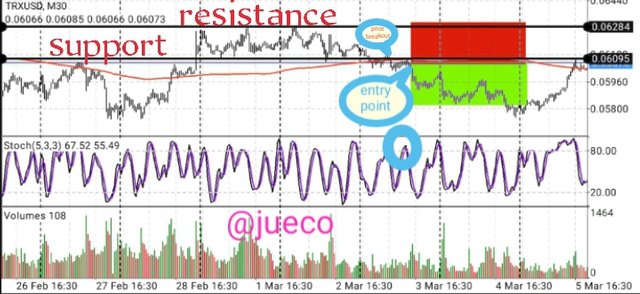
SCREENSHOT FROM MT4
As seen above, my volume Indicator was also added, and it indicated a low volume, which is signaling a bearish trend.
Take a Real Trade(crypto pair) on Your Account After a Successful Breakout. (transaction screenshot required).
Take a Real Trade(crypto pair) on Your Account After a Successful Breakout. (transaction screenshot required).
I then came to my MT4 to make my Analysis of the price chart, and I chose the pair TRXUSD.
I recalled from the lecture of my able professor, that the higher the time frame used for analysis, the more valid the resistance and support levels are.
With that in mind, I decided to analyze on a larger time frame.
On getting to a one hour time frame of the pair TRXUSD, I noticed that the market was ranging, making multiple touches on the resistance and support line.
I then watched and noticed that the price was at the support level, I waited for it to be rejected and form some bullish candles, so I can take it as a confirmation signal.
As I watched, the chart formed few bullish candles which is a strong confirmation to enter my trade.
I then went ahead to confirm the signal by using the bollinger band Indicator.
On applying the bollinger band Indicator which acts as a dynamic support and resistance to the price.
I noticed that the price touched the strong support on the bollinger band at the same point it retested my horizontal support line, and is about to be rejected. Thus signaling a good bullish trend move..
As it is known, the bollinger band serves as a very strong support and resistance to the price.
It upper band act as a good resistance and its lower band acts as a good support.
Inorder to make the signal valid and filter out false signals, I decided to add the RSI Indicator which helps to signal overbought and oversold regions in the market.
Whenever the RSI signals an overbought, it is usually a good bearish trend reversal and when it is in an oversold, it is a good bullish trend reversal.
From my Analysis, my RSI was in an oversold region of 30, thus indicating a bullish trend reversal signal.
From this Analysis made, I got three confirmations to enter a buy order, and this can be seen below.
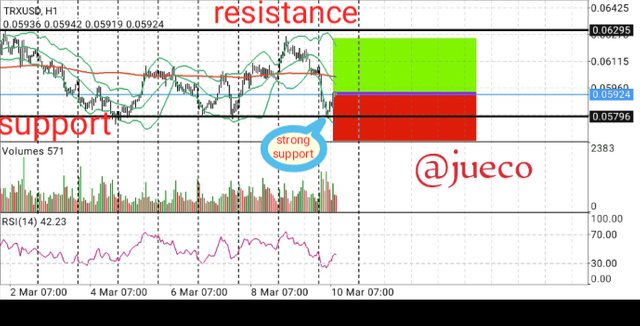
Screenshot from mt4
I also recalled from the lecture that it is advisable to analyze on different time frame.
I then decided to analyze on a 4 hour time frame of the same pair TRXUSD.
On the 4hiyr chart, I got the same signal as I did on the 1hour time frame.
I noticed that the market was ranging and it just hit its strong support, forming few bullish candles which is a sign of price rejection. Indicating a good buy signal.
I then applied the stochastic oscillator which performs the same duty as the RSI, it helps to signal overbought and oversold regions in the market.
On checking my stochastic Indicator, I noticed it was in an oversold region, which is a good bullish trend reversal signal.
I also went ahead to apply the bollinger band, which acts as dynamic support and resistance to the price.
When analysing using the bollinger band, I noticed that the price was on the strong support of the bollinger band, thus indicating a bullish trend reversal.
This is illustrated below
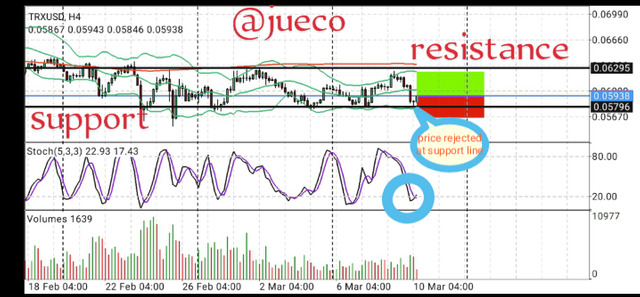
SCREENSHOT FROM MT4
With these three re-confirmative signals, I chose to enter a buy order on the pair TRXUSD using my binance.
I entered the market at 0.05931 and placed my stop loss a little bit below the support line at 0.05750, incase of price retracement and retests.
I went ahead to place my take profit at 0.06210, close to my resistance line
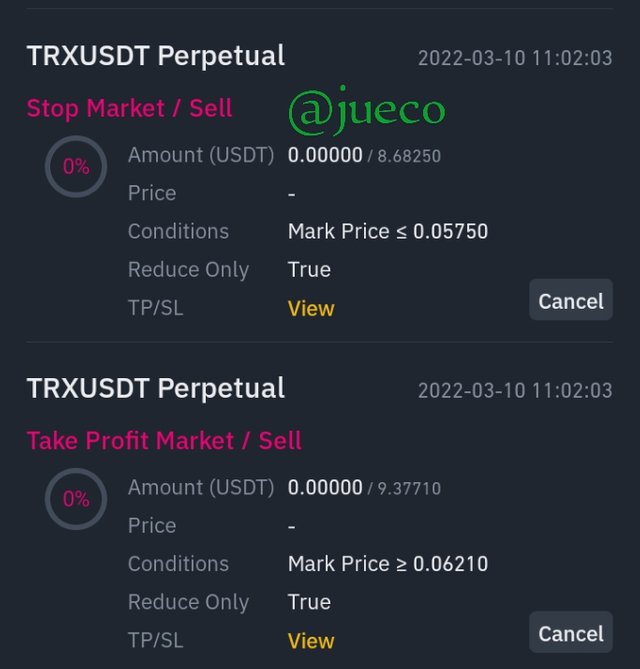
Screenshot from binance
Explain the Limitations of Support & Resistance (false breakout).
Explain the Limitations of Support & Resistance (false breakout).
As explained earlier, no technical analysis technique can be 100% accurate and this is due to the high volatility of the market.
The resistance and support trading techniques is also prone to false signals, this false signal is known as false breakout.
This false breakout occurs due to the fact that the resistance and support levels are critical levels in the market where there is usually a pause in the price movements, and the price can either move in an uptrend or a downtrend.
It is a point where the whales manipulate the market and this leads to the formation of false breakout.
False breakout is one of the major challenge been encountered with the use of the resistance and support trading strategy and many traders fall victim to it and loose lots of money.
Meanwhile, this false breakout can be filtered.
It can be filtered using other trading techniques or through the use of technical Indicators.
Many wise traders filter out false breakout by waiting for the formation of a confirmation candle before trading on a price breakout, and this has been so effective.
CONCLUSION
CONCLUSION
The use of resistance and support levels in trading is a very good trading techniques, it is very effective in predicting the next trend direction of the market
The use of support and resistance also makes the functioning of other trading techniques effective, as they solely depend on the resistance and support levels.
I appreciate professor @shemul21 for his lecture on the effective use of the support and resistance line.