Candlestick patterns- Steemit Crypto Academy Season5- Homework post for Task10
I believe we are all doing great and we have all been Participating in the club5050 project.
I count it an honor to be here to submit my assignment post on the lecture given by Prof @reminiscence01 on candlestick patterns.
This assignment happens to be task 10 of the introductory courses of Season5 of the steemit crypto academy.
For me to participate in this assignment, I have been instructed to list the question I intend to answer in block letters, below are the questions;
1a)
EXPLAIN THE JAPANESE CANDLESTICK CHART? (ORIGINAL SCREENSHOT REQUIRED).
b)
IN YOUR OWN WORDS, EXPLAIN WHY THE JAPANESE CANDLESTICK CHART IS THE MOST USED IN THE FINANCIAL MARKET.
c)
DESCRIBE A BULLISH AND A BEARISH CANDLE. ALSO, EXPLAIN ITS ANATOMY. (ORIGINAL SCREENSHOT REQUIRED)
Shall we proceed to the first question.
EXPLAIN THE JAPANESE CANDLESTICK CHART?
EXPLAIN THE JAPANESE CANDLESTICK CHART?
The Japanese candlestick chart is used by traders as a technical analysis tool, to analyse the price of movements of commodities in the market.
The Japanese candlestick chart was designed by a Japanese rice trader named Munehisa Homma in the 18th century.
From his daily marketing experience, he realized that the emotions of traders greatly affected the rice market. This experience led to the creation of the Japanese candlestick chart.
The Japanese candlestick chart was designed in a way that it displays the graphical movements of prices using different colours.
The Japanese candlestick chart assisted traders to make wise decisions, as their decision solely depended on the short term movements of the prices.
The development of the Japanese candlestick chart made Homma Munehisa very popular and this enabled him dominate the rice market.
The Japanese candlestick methodology was introduced to trading process in the 1870s when the Japanese stock market was ignited.
This methodology was later introduced to the West by Steve Nison through his work "Japanese candlestick charting technique".
The Japanese candlestick now happens to be a well known technical Indicator used by traders to financially analyse the market.
It gives more accurate information when compared to other charts.
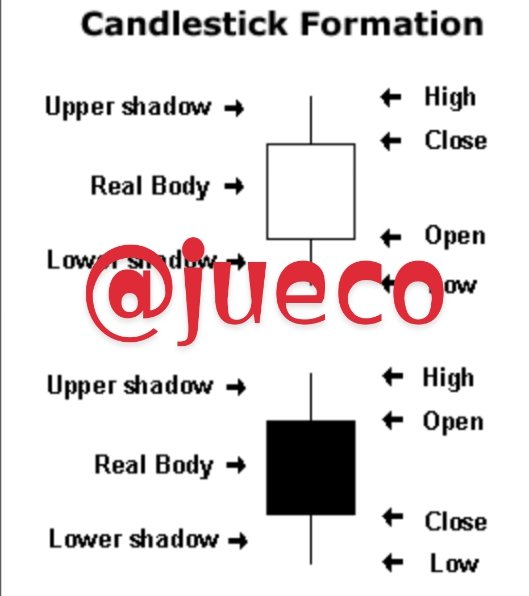
As seen above, each candlestick possess a body which is the central part of the stick that shows the distance between the close and the open of the market.
The space between the high of a trading period and the upper part of the body is known as the upper shadow.
While the lower shadow is the distance between the low of a trading period and the lower part of the body.
The closing price of a market is one factor that can be used to determine the nature of a market.
If the closing price of a commodity is higher than it's opening price, the market is said to be bullish. And a bullish candlestick takes a green colour.
If the closing price of a market happens to be lower than it's opening price, then the market is said to be bearish, and it's take a red colour.
CANDLESTICK PATTERN
There are several Japanese candlestick patterns used by traders when analyzing the price movements of a market, some of them are;
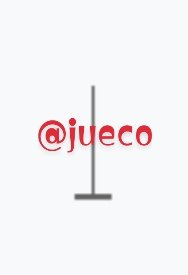
- HAMMER:

The hammer pattern consist of a long lower tail and a negligible upper one.
The appearance of this candlestick indicates a market reversal.
- BULLISH ENGULFING PATTERN:
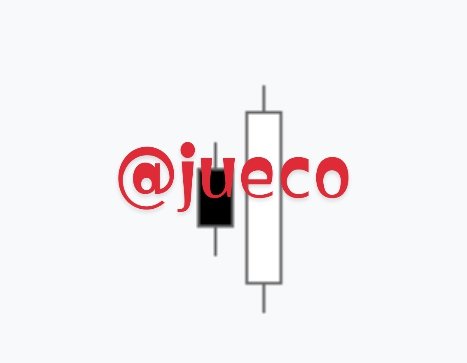
This pattern consist of a smaller candlestick which is the bearish candlestick and a bigger one which is the bullish candlestick.
Here the bearish candlestick is being engulfed by the bullish candlestick, and this pattern appears at the end of a downtrend. This shows that the are in control of the market.
- BEARISH ENGULFING PATTERN:

The bearish engulfing pattern is an opposite of the bullish engulfing pattern.
This pattern appears to show a bearish reversal and in this pattern, the bullish candle is being engulfed by the bearish.
- DOJI:

The doji candlestick is usually created when there's no difference between a closing price and the opening price
- GRAVESTONE DOJI:
As the name implies, so also is the resemblance of the pattern.
This candlestick is formed when the open and close of a commodity occurs at the low of a given period of time of the market.
- DRAGONFLY DOJI:

The dragonfly doji happens to be the opposite of the gravestone doji.
This pattern is created when both the opening and closing of a commodity occurs at the high of a given period of time in a market.
Below is a screenshot of a Japanese candlestick chart
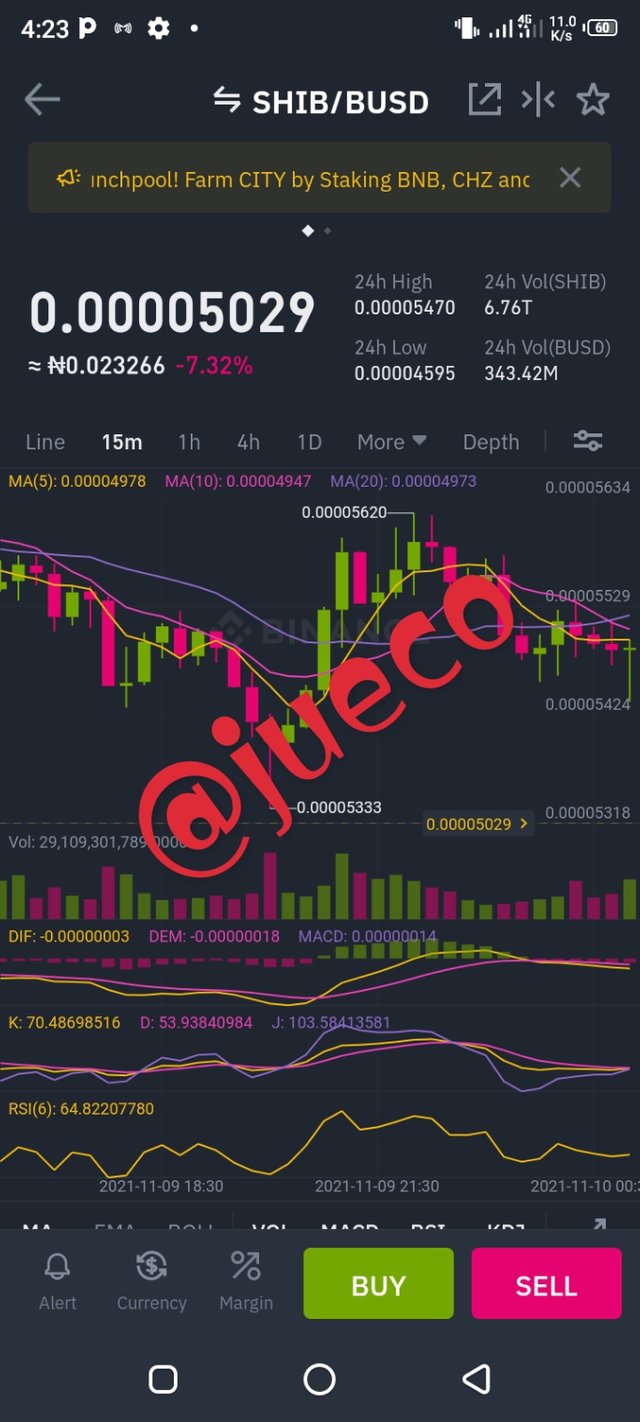
SCREENSHOT FROM BINANCE
The above screenshot is a Japanese candlestick chart of SHIB|BUSD pair.
The candles in red are the bearish candles while the candles in green are the bullish candle.
It is also good to note that the bearish candles can either appear in red or black colors as seen above and the bullish candle can either appear in green or white colors
IN YOUR OWN WORDS, EXPLAIN WHY THE JAPANESE CANDLE STICK CHART IS THE MOST USED IN THE FINANCIAL MARKET
IN YOUR OWN WORDS, EXPLAIN WHY THE JAPANESE CANDLE STICK CHART IS THE MOST USED IN THE FINANCIAL MARKET
Below are the reasons I believe the Japanese is the most used in the financial market.
- ITS CONFIGURATION:
The configuration and setting of the Japanese candlestick makes it attractive and pleasing to users.
It's graphic representation and availability of diverse colours makes a chart easily analyzed. - The Japanese candlestick helps in quick identification of market patterns.
The candlestick specifically displays reversal patterns, (be it bullish or bearish), and this cannot be found on other analysis tools. - Another reason why the Japanese candlestick is the most used in the financial market is that it helps predict the current nature of a market at a glance.
Just by glancing through the Japanese candlestick on a chart, a trader can easily tell if the market is a bullish one or a bearish one.
- The Japanese candlestick also emanates accurate and trusted market data in connection with the current and previous market price
- The compatibility of the Japanese candlestick and other technical Indicators is another reason the Japanese candlestick is preferred to other tools in analyzing the market.
This compatibility allows traders apply Indicators on the chart.
As seen on the screenshot I gave above, I applied the RSI, MACD, MA and KDJ Indicators.
- The Japanese candlestick chart also happens to be the most easily understood chart, it contains all possible tools that aids easy analysis of a market.
DESCRIBE A BULLISH AND A BEARISH CANDLE. ALSO ITS ANATOMY
THE BULLISH CANDLE
SCREENSHOT FROM BINANCE
The bullish candle is a candlestick that informs investors/traders that a market is in a process if becoming an uptrend after a downtrend.
The bullish candle is an indication that the bull are about to take over the market and this inturn results in increase in price of a commodity in the market
A bullish candlestick appears to be green in color and it has its closing price before it's open price in a market.
In some instances the bullish candlestick appears to be white in colour.
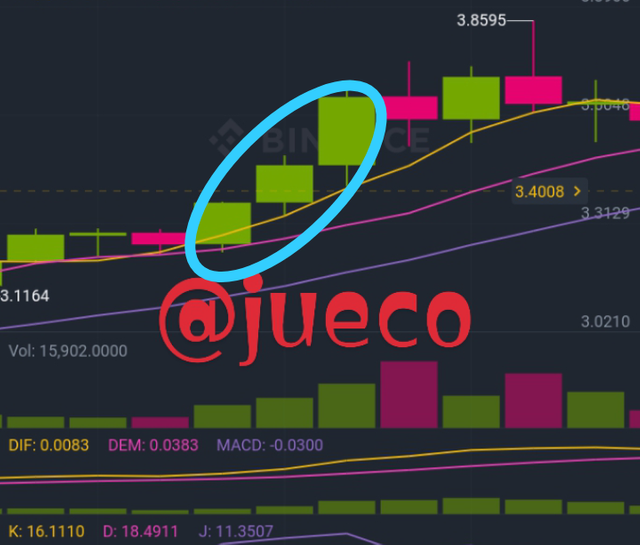
THE ANATOMY OF A BULLISH CANDLE
_1.jpeg)
From the above screenshot, we can clearly see the components of a bullish candle, follow along as I provide explanation;
Upper Wick:
The upper Wick which is sometimes known as "high" is the upper point of a bullish candle and it helps to show the peak price at which a commodity has been traded with over a specified period of time.Closing price:
The closing price in a bullish candle indicates the point whereby a commodity is closed in the market over a specified period of time.Body:
The body on a bullish candle is the middle part of the candlestick which display the gap between the close and open of a commodity.Opening price:
The opening price which is popularly labelled as open is the is a point on the candlestick which shows the opening price of a commodity in the marketLower wick:
The lower wick of a bullish candlestick acts as a commodity lowest traded recorded price over a specified period of time.
A BEARISH CANDLE
SCREENSHOT FROM BINANCE
A bearish candle is the very opposite of a bullish candle.
The bearish candle is one that indicates a downtrend on a chart.
The bearish candle is usually red in colour but in some instances it is illustrated as black.
A bearish candle helps a trader to analyse the market by displaying couples of bearish candles to indicate the strength of a downtrend in a market.
The formation of a bearish candle indicates that the bears are about to dominate the market, thus leading to a decrease in price of commodities.
Unlike the bullish candle, where it's open price comes before it's closing price, a bearish candle has its closing price before its opening price.
In a sentence, we can say that bearish candles are chart pattern that give signals of an upcoming downtrend.
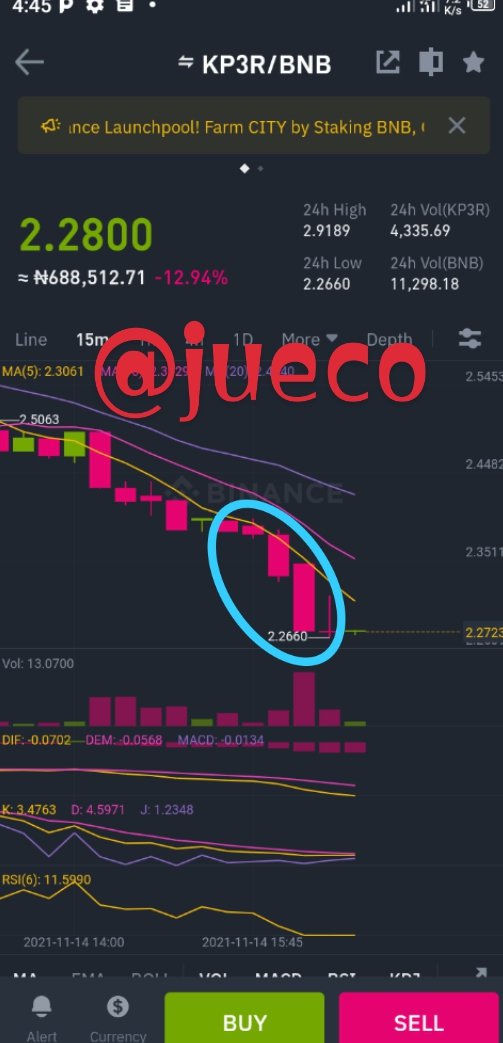
ANATOMY OF A BEARISH CANDLE
_1.jpeg)
Source
As seen above, there are four components that explains the anatomy of a bearish candle, they are;
Upper Wick:
The upper Wick indicates the maximum price at which a particular commodity was exchanged)traded over a specified period of timeOpen:
As seen in the bearish candlestick shown above, the opening price of the candlestick precedes it closing price.
The open indicates the point in which the price of a commodity was initiated.Close:
The closing price of a bearish candlestick, as the name implies is the final price a commodity was traded at over a specified period of timeLower wick:
The lower wick of a bearish candlestick indicates the minimum price at which a commodity was exchanged over a specified time.Body:
The body of a bearish candle is the distance between it's opening and closing price.
CONCLUSION
CONCLUSION
Indeed the development of the Japanese candlestick has really been of great help to traders as it helps us analyse the market easily.
It gives us insight over the nature of a market by just giving it a mere look.
I appreciate Munehisa Homma for the development of the Japanese candlestick.
I also thank Prof @reminiscence01 for his lecture.
My comment box is open to all who have additional questions or comments to make , please feel free.
CC
@dilchamo