Basics to trade cryptocurrencies correctly| part2- cryptoacademy/s6w3- Homework post for nane15

Hello Crypto friends,
With joy of heart, I warmly welcome you to my assignment post for week 6 of Season6 of the steemit crypto academy.
This week, we shall continue from where we stopped on the basics to trade cryptocurrencies correctly.
Join me as we dive fully into this adventure.
Explain your understanding of charts, candlesticks, and time frames. (Use your own words and put screenshots)
Explain your understanding of charts, candlesticks, and time frames. (Use your own words and put screenshots)
CHART
From my understanding, a chart in the cryptomarket market can be explained to be a graphical display of the activities between the buyers and sellers in the market.
A chart helps us as traders to better understand the condition and happenings of the market.
It helps to inform us when the bulls are taking over the market with the weakness of the bear and when the bears are taking over the market.
Although, there are different kinds of chart and in different fields of study, but when it comes to the cryptomarket, chart consists of mainly two candles, the bullish candle which is green in colour and the bearish candle which is red in colour.
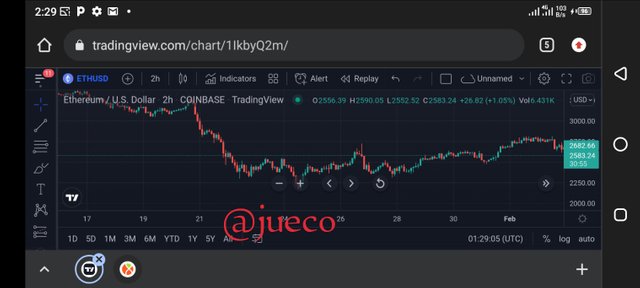
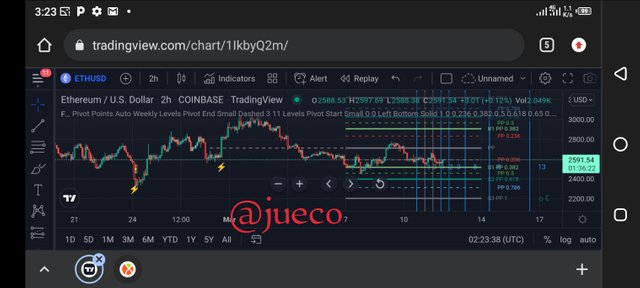
SCREENSHOT FROM TRADING VIEW
The screenshot above is one that shows a crypto chart of the pair ETHUSD.
CANDLESTICK CHART
A Candlestick chart also known as the Japanese candlestick chart can be explained as a type of price chart that is mostly used in technical analysis.
It is a price chart that consist of two candles, the bullish candle which is green in color and the bearish candle which is red in colour.
Each candle of the Japanese candlestick displays four major features;
- The high which is the highest point the price attained
- The low which is the lowest point of the candle.
- The opening price which is the price at which the market was opened
- The closing price which is the price at which the market closes.
Also in a situation where there's a formation of multiple green candles, the market is indicating an uptrend, just as seen below
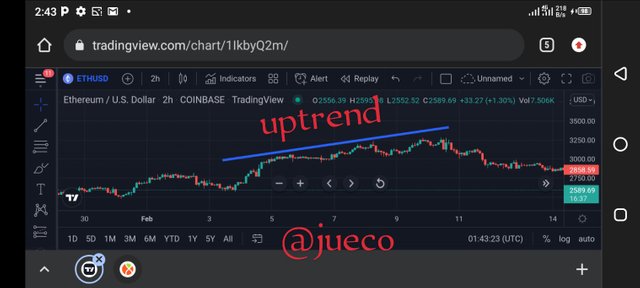
SCREENSHOT FROM TRADING VIEW
And when there's multiple formation of red candles, the market is indicating a downtrend, just as illustrated below
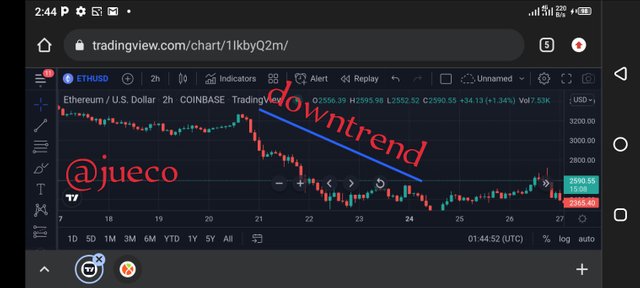
SCREENSHOT FROM TRADING VIEW
TIME FRAME
A time frame can be explained as the duration or time period an activity took place in the market.
A time frame can also be said to be the duration it takes for the formation of a candlestick.
For example, if a price chart is set in a time frame of 15mins, this means that each candle on that time chart was formed within the range of 15mins.
The use of time frame in trading is very important as it feeds traders with different information from the market.
The information a high time frame will give will be different from that a smaller time frame will give, because the lower time frame gives specific information within those little period of time.
Below is an example of a price chart on a 15mins time frame
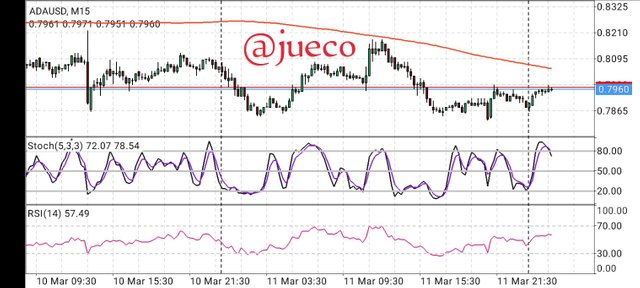
Screenshot from mt4
Every candle as seen above was formed each within the range of 15 minutes.
Below is an example of a price chart on a 4 hour time frame.
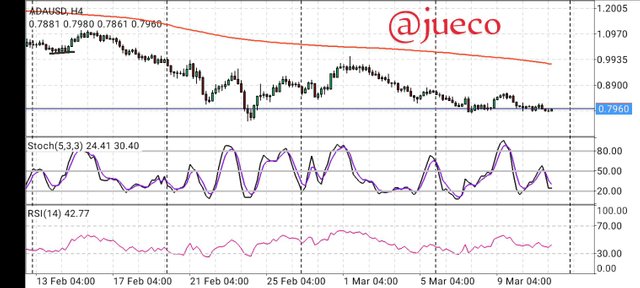
Screenshot from mt4
Every candle as seen above was formed within the range of 4 hours each.
Explains how to identify support and resistance levels. (Give examples with at least 2 different graphs)
Explains how to identify support and resistance levels. (Give examples with at least 2 different graphs)
Support and resistance levels can be said to be regions in the market where there is usually a pause in the activities of the market.
The importance of support and resistance levels cannot be overemphasized as they help to identify the trend of the market, they help to spot trend reversals areas and help traders discern when to enter and exit the market.
The support levels are regions beneath the price of a commodity where the market has fallen to but is having difficulty to break below.
The concept of the support level is that whenever the price falls to the support level, it is most times rejected, thus moving in the upward direction.
And this is because the the price of the market becomes cheaper as the market approaches the support level, and this inturn attracts buyers to the market, which will then prevent the price from falling further.
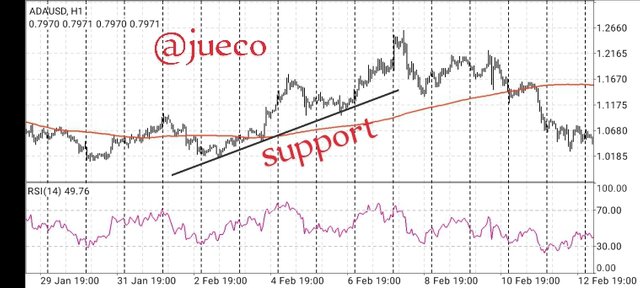
Screenshot from mt4
The screenshot above is that of ADAUSD, indicating the formation of a diagonal support level.
As seen above, the support level is formed by connecting the lows of the prices in the market.
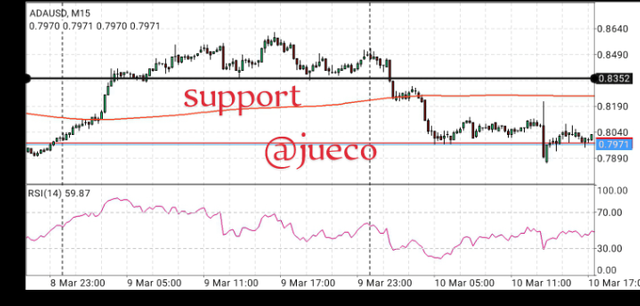
Screenshot from mt4
The above is a screenshot indicating the horizontal support level of the pair ADAUSD.
Resistance levels on the other hand are regions above the price where the price of a commodity has risen to but is finding it difficult to break above.
Usually, whenever a price hits a strong resistance line, it is usually rejected, thus indicating a downtrend.
And this is because, the price of the commodity gets more expensive as it gets to to it's resistance line, and the sellers in the market see this as a great selling opportunity to make profit, thus preventing the price from increasing any further.
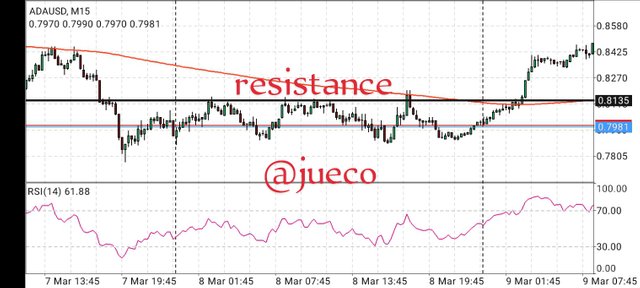
Screenshot from mt4
The above is a screenshot indicating the horizontal resistance level of the chart ADAUSD.
The horizontal resistance line is formed by connecting the highs of the price together.
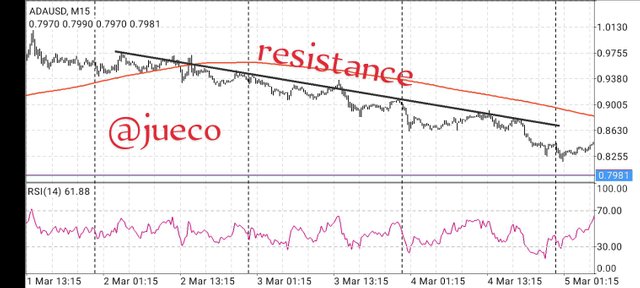
Screenshot from mt4
The screenshot above is one indicating the diagonal formation of the resistance line.
Identifies and flags Fibonacci retracements, round numbers, high volume, and accumulation and distribution zones. (Each one in a different graph.)
Identifies and flags Fibonacci retracements, round numbers, high volume, and accumulation and distribution zones. (Each one in a different graph.)
FIBONACCI RETRACEMENT
Fibonacci retracement can be explained to be a technical analysis tool that helps traders to detect the point of price retracement/reversal in the market.
The Fibonacci retracement can also be said to be retracement levels that emerged from Fibonacci sequence, that is, they are horizontal lines that detect valid support and resistance zones.
The levels of Fibonacci retracement are 23.6%, 38.2%, 61.8% and 78.6%.
This Indicators is mainly used because it helps to create reversal levels when drawn between two price point.
Screenshot from trading view
The screenshot above is a price chart that shows the application of Fibonacci retracement.
ROUND NUMBERS
Round number is yet another effective trading strategy used by technical analyst in detecting the zones of price reversal in the market.
This Indicator most times psychologically function as the major support and resistance levels in the cryptomarket as it is believed by traders that price tend to reverse at round numbers.
Many traders makes effective use of this Indicator, by using it as a guide to set their stop loss and take profit positions, they do so at round numbers like 30.0, 53.0, 65.0 etc.

Screenshot from trading view
The screenshot above shows the graphical application of a round number Indicator in a price chart.
ACCUMULATION
Accumulation phase also known as a ranging market can be explained as a market condition in which the market is in a pause, that is, there is indecision between the buyers and the sellers.
It is a phase where neither the bulls nor the bears are in control of the market.
The accumulation phase in a price chart usually occur after a long bearish move of the market.
The formation of the accumulation zone, acts as the resting period for the bears, where they gather more momentum to continue their Bearish move, thus indicating a trend continuation.
It also signals the weakness of the bears to continue dominating the market, and in some instances the strength of the bulls comes in, thus indicating a trend reversal.
In a sentence, we can say that the formation of the accumulation zone can signal both a trend continuation or a trend reversal.
The accumulation zone is usually formed beneath the price chart, just as seen below.
Screenshot from mt4
The above screenshot as seen is that of the accumulation zone acting as a trend reversal signal.
As seen, the price failed to break it's support by forming new lows but instead broke it's resistance, thus signaling an uptrend.
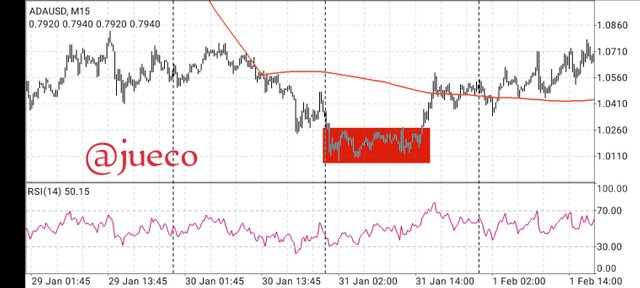
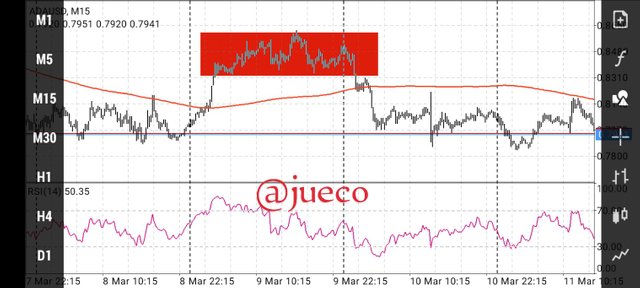
The below screenshot is also the accumulation zone, but this time acting as a trend continuation signal.
As seen below, the price, despite it's weakness, gathered momentum and continued in a bearish move
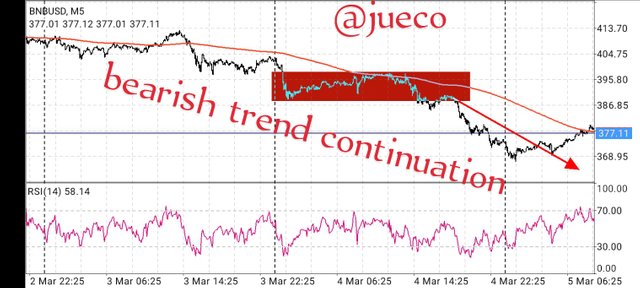
Screenshot from mt4
As seen above, the price broke it's resistance level, then retraced to retest it's broken resistance level, thus signaling a downtrend
DISTRIBUTION ZONE
Distribution zone on the other hand is similar to accumulation zone, in that, it is a condition of pause in the market.
The distribution zone is usually formed after a long bullish move in the market.
The distribution zone helps to signal either a trend continuation or a trend reversal, depending on the the strength of the bulls and bears.
Screenshot from mt4
As seen above, the price failed to continue forming new high after it's consolidation,, instead, it broke below the support line, thus indicating a trend reversal.
The below screenshot is one that shows the distribution zone acting as a trend continuation signal
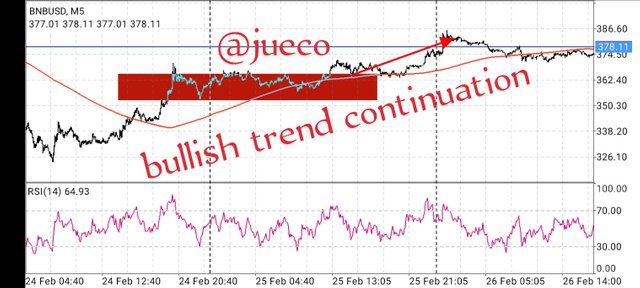
Screenshot from mt4
As seen above, the distribution zone acted as a trend continuation signal, after it's consolidation, it's formed new highs and broke it's resistance line, then it retraced to retest the broken resistance line, thus indicating a bullish trend continuation.
It explains how to correctly identify a bounce and a breakout. (Screenshots required.)
It explains how to correctly identify a bounce and a breakout. (Screenshots required.)
A bounce of price can be explained as the change in direction of a price in a price chart whenever it hits a strong support/resistance line.
For example, if the market is in a bullish move and it hits a strong resistance which it fails to break, it's price is going to be rejected, thus moving in the downward direction.
The rejection or the reversal of the price is what we know as a bounce.
The phenomenon of a price bounce is what led to the formation of higher highs and higher lows in a bullish trend of the cryptomarket, and traders used this as a good opportunity to place buy and sell order.
For example, in a bullish trend, consisting of higher highs and higher lows, every low tend to serve as a good entry to place a buy order and every high serve as a good entry to place a sell order.
Whereas, in a downtrend, consisting of lower lows and lower highs, every high serve as a good entry to place a sell order and every low serves as a good entry to place a buy order
A breakout, on the other hand can be explained as a situation where the price of the market has been able to successfully cross through its resistance/support zone.
A breakout on the resistance line most often occurs in a bullish move, thus signal that the bulls are in control of the market.
A breakout on the support zone indicates that there are more sellers than buyers in the market.
A breakout is usually of two types;
- Successful breakout
- False breakout
A successful breakout can be classified into two: an aggressive successful breakout and a mild successful breakout.
An aggressive successful breakout is one that occurs with a high volume and without a retrace to it's broken zone
While a mild successful breakout is one that always retraced back to retest it's broken level.
Below is a clear graphical demonstration of a bounce and a breakout
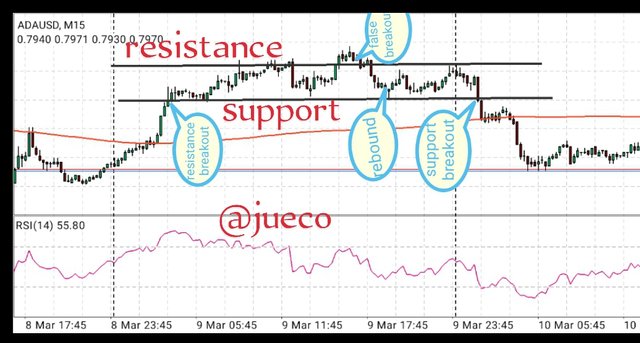
Screenshot from mt4
Explain that it is a false breakout. (Screenshots required.)
Explain that it is a false breakout. (Screenshots required.)
When it comes to trading using resistance and support levels, the key movements traders watch out for to make trading decision is the breakout, bounce and retest of broken region.
And this strategy has proven effective over the decades, but with some limitations, one of which is the formation of false breakout and this is due to the high volatility of the market.
A false breakout can be explained as a phenomenal whereby the price breaks it's resistance/support line but fails to continue in the direction of the breakout.
This means that if a false breakout occurs in the resistance level, the price will end up continuing in a downtrend and if a false breakout occurs in the support level, the price will end up continuing in an uptrend.
Below is a graphical representation of a false breakout on the price chart.
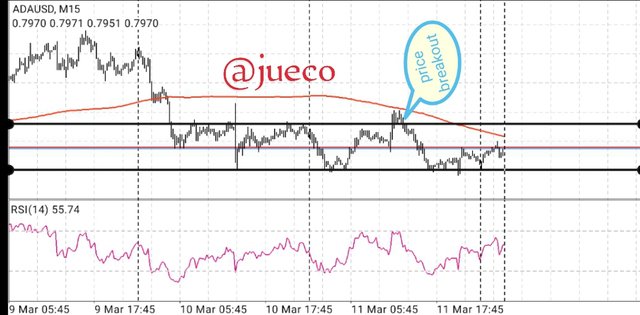
Screenshot from mt4
As shown above, the false breakout was seen on the resistance level but the price ended going on a bearish move.
Explain your understanding of trend trading following the laws of supply and demand. It also explains how to place entry and exit orders following the laws of supply and demand. (Use at least one of the methods explained.)(Screenshots required.)
Explain your understanding of trend trading following the laws of supply and demand. It also explains how to place entry and exit orders following the laws of supply and demand. (Use at least one of the methods explained.)(Screenshots required.)
Before diving into the answers to this question, I will love us to understand first, what demand and supply is.
The law of demand states that, all things being equal, the higher the price of a commodity, the lower the quantity that would be requested for and the lower the price of a commodity, the higher the quantity that would be requested for.
This means that in the cryptomarket, whenever there's a fall in the price of the commodity, there will be more buyers in the market, that is, the lower the price gets, the more attractive it will be to the buyers, thus changing the trend of the market from bearish to bullish.
Little wonders, price most times find it difficult to break it's support line, because as it approaches it's support line, the more buyers it attracts to push the price forward.
The law of Supply on the other hand states that the higher the price of a commodity, the higher the quantity that will be supplied and the lower the price the lower the quantity of goods supplied.
This means that in the cryptomarket, whenever there's an increase in price of the market, the more sellers we will have in the market.
Little wonder price fails to break above it's support line, because the closer it gets to the support line, the more sellers it attracts, thus preventing the price from increasing any further.
From the above explained, it is clear that the law of demand and supply have a great impact on the trend of the market.
Whenever the market is in an uptrend, it is an indication that there are more buyers than sellers in the market and whenever the market is in a downtrend, it indicates that there are more supplies than demand in the market.
In an uptrend, the market consists of higher highs and higher lows.
And at every high, experience traders see an opportunity to place a sell order and at every low, they see opportunity to place a buy order.
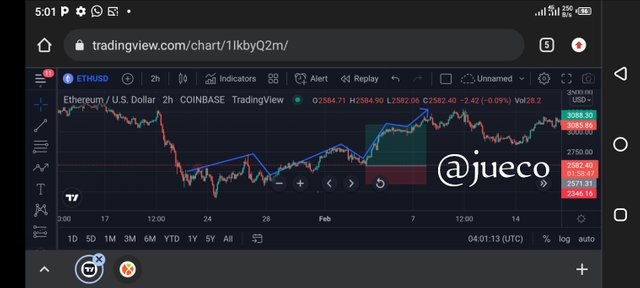
Screenshot from trading view
The screenshot above is that if the pair ETHUSD and as seen above, every low act as a good opportunity to place a buy order
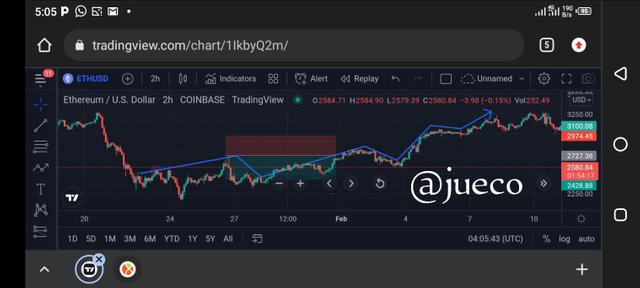
SCREENSHOT FROM TRADING VIEW
The screenshot above depicts a good selling opportunity in an uptrend.
As earlier said, every high serve as a good opportunity to place a sell order.
In a bearish trend, which is driven by Supply, the market consists of lower lows and lower highs.
At every high, a good trader sees a good selling opportunity and at every low, a trader sees a good buying opportunity.
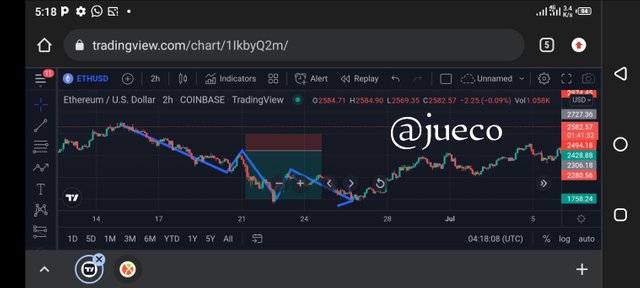
Screenshot from trading view
The above screenshot is that of the pair ETHUSD, and as seen above, the market comprised of lower lows and lower highs, and I took one of the highs as a good opportunity to enter the market and place a sell order
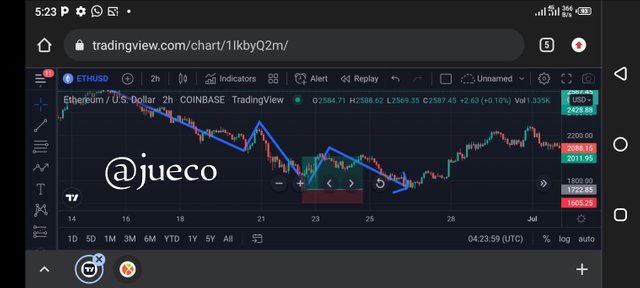
Screenshot from trading view
The above screenshot shows how I used one of the lows of the bearish trend as a good buy entry position.
Open a real trade where you use at least one of the methods explained in the class. (Screenshots of the verified account are required.)
Open a real trade where you use at least one of the methods explained in the class. (Screenshots of the verified account are required.)
In this section of my assignment, I am required to perform a live trading, using any of the analysis I learnt from this lecture.
Screenshot from mt4
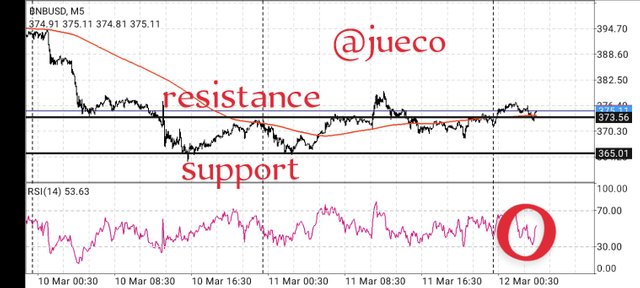
I visited my MT4 app and decided to analyze the pair BNBUSD on a 5minute frame.
The first thing I did was to identify the condition and trend of the market which enabled me to sat a valid resistance and support line.
As I checked, I noticed that the market was in an accumulation zone, that is, it was neither in an uptrend nor a downtrend.
Then I watched and noticed it breaking it's resistance line, which is a signal for a bullish move and which can also be a false breakout.
I then watched and noticed that it was retracing to retest it's broken resistance level which is now acting as a strong support, after it retraced to it's support line, the price was rejected, it experienced a bounce, which is a confirmation signal for me to enter a buy order.
I then decided to confirm this buy signal using my RSI Indicator, when I checked my RSI Indicator, it was in an oversold region of 30, thus indicating a bullish trend reversal.
I then took this as a confirmation to place my buy order
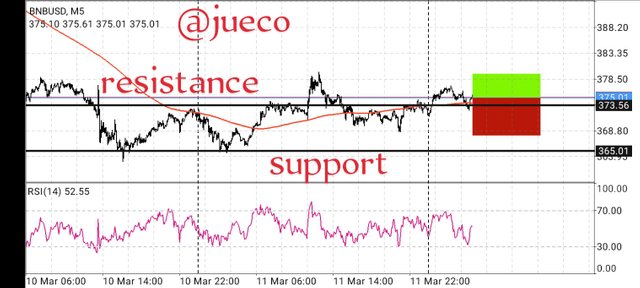
Screenshot from mt4
I then visited my binance and placed a buy order at 375 and I placed my stop loss below the nearest support and my take profit, close to the resistance line.
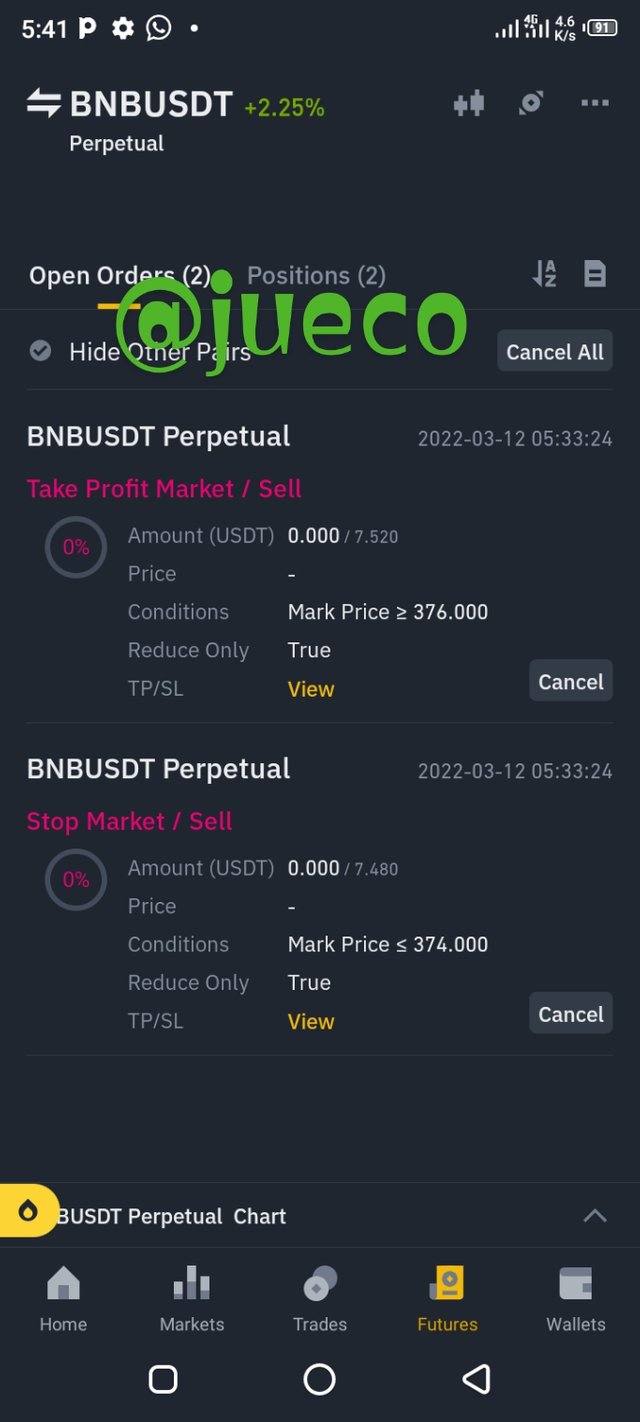
Screenshot from binance
The above is a proof that I carried out this transaction on my binance account.
After some time, I decided to visit my mt4 to check the progress of my order, and I noticed that the market was playing out in my favour,ans it hit my take profit position.
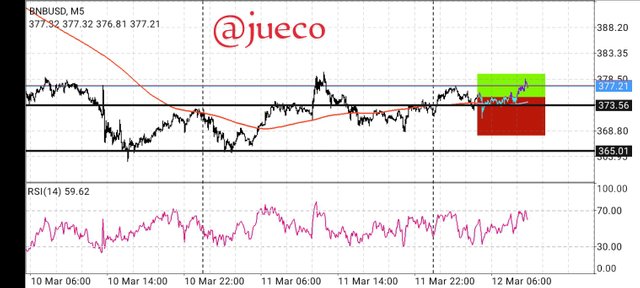
Here's a proof of my completed order
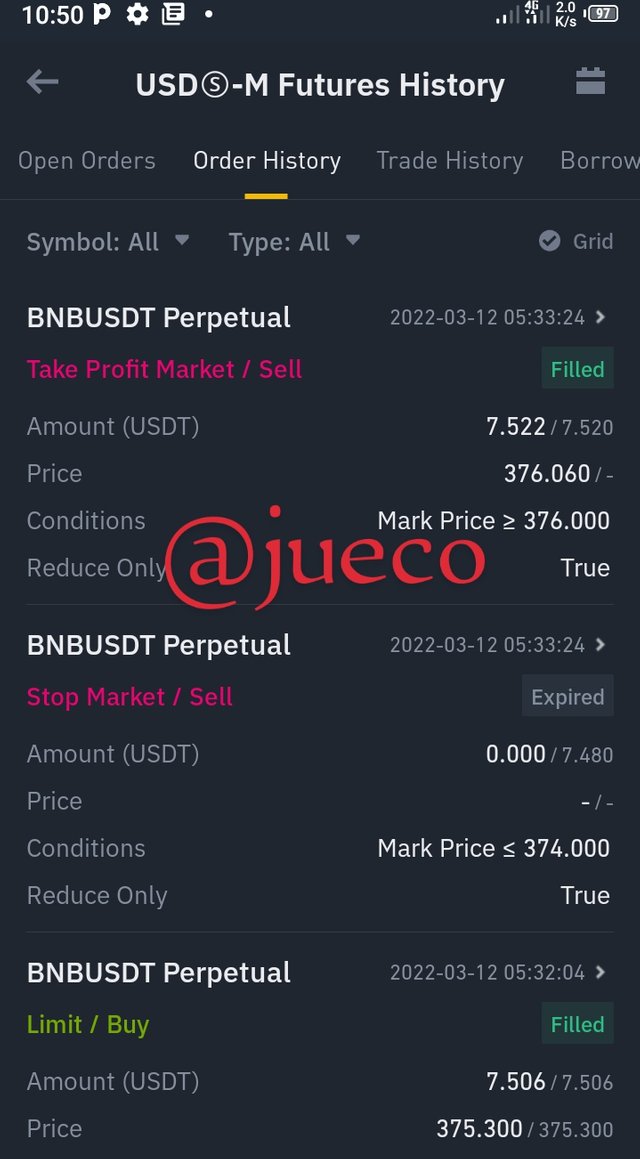
SCREENSHOT FROM BINANCE
Here's the verification proof from my binance
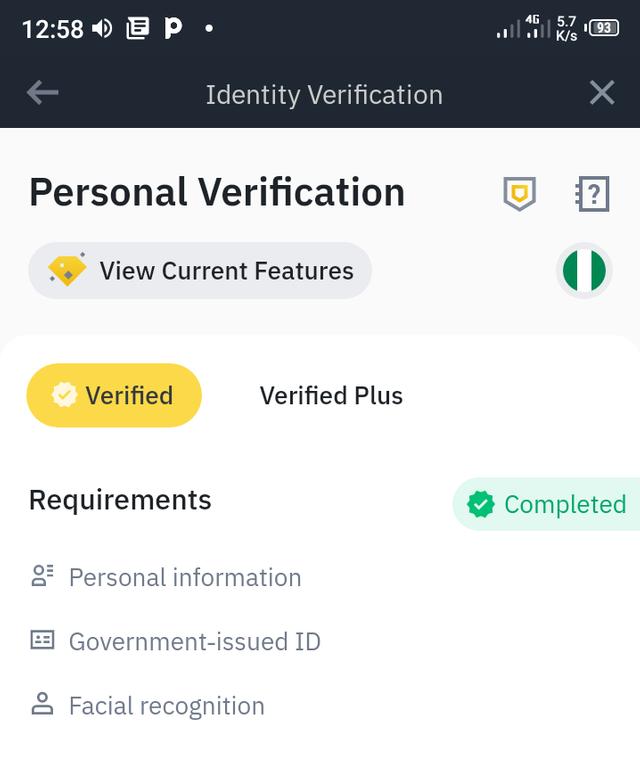
Screenshot from binance
CONCLUSION
CONCLUSION
The support and resistance strategy is a very effective trading strategy in technical analysis as it helps in trend Identification and also helps traders discern when and how to enter the market and place their stoploss and take profit positions.
Greetings @jueco, thank you very much for being a part of SteemitCryptoAcademy this sixth season.
Your grade on this assignment is as follows:
Remarks:
You should have explained time interval, not time frame, however the explanation was similar.
I can't take your false breakout for granted, you should have used the volume indicator instead of the RSI, plus the move should have been violent in the opposite direction.
Your final operation was not at all similar to what I explained in the class, you must have operated according to one of the three final methods that I explained. You should have used the volume indicator as this is what I asked for.
You should read the class calmly before doing the task.
Thank you @jueco for your effort in carrying out this publication, I hope to continue reviewing your future tasks.