Steemit Crypto Academy | Season 3 Week 8 | Homework for @yohan2on | Risk Management in Trading by:@juanjo09
Greetings to all my friends, colleagues and crypto teachers of the #cryptoacademy I hope today you are again energetic to learn new things in this last week of the #cryptoacademy. This time we will learn about risk management in trading, this to manage ourselves strategically and responsibly in the world of exchange operations so that we will learn about some useful concepts to evaluate and operate with responsible risks.
In this we will learn about:
- Types of Orders
- Buy Stop
- Sell Stop
- Buy Limit
- Sell Limit
Trailing Stop Loss
Margin Call
Risk management in Trading.
Let us begin.
Types of Orders
What is Buy Stop?
The Buy Stop is a buy order, this consists of placing the order at a price higher than the current price, it is usually used to put a limit on the losses of a sale (use in short operation) or to buy at a price higher than what is expected with certainty that the price will continue to rise (use in long operation) for example:
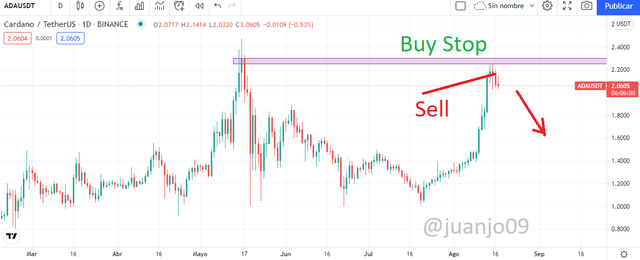
In this graph of the ADA / USDT pair assuming that we operate short, that is, we buy where indicated, at a price of $ 2.2 the ideal intention is for the price to fall and follow the direction of the red arrow in the image, an ideal situation is place a Buy Stop (purple square) at a price of $ 2.25 or $ 2.35 as a stop loss for the short trade.
Similarly, without having executed any order in case of ambiguity, placing a Buy stop in the same area would be ideal since the price could continue to rise.
What is Sell Stop?
The Sell Stop is a sell order with the opposite intention to the Buy Stop order, this sell operation is used with the intention of selling in case the price continues to fall (short operation) or with the intention of setting loss limits on a purchase (long trade). For instance:
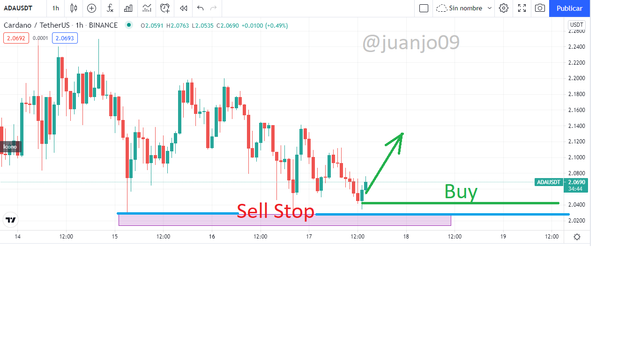
Let's see the same graph but in a smaller period, suppose we are certain that the price will rise, we can buy and place a Sell Stop order, slightly below the support (Blue line) this as a stop loss to limit the purchase losses .
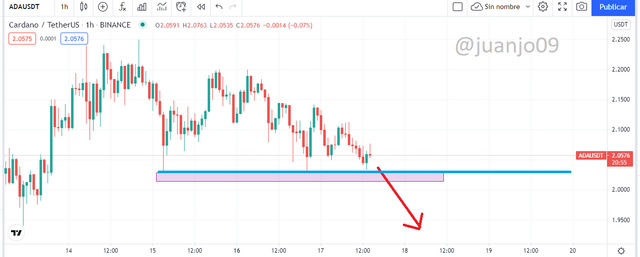
Another example (image below) of Sell Stop application is in the case that we have the opposite view, that is to say that the price falls, breaks that Blue Line support and the price goes down even more, place a Sell Limit order to operate short it would be ideal.
What is Buy Limit?
Buy Limit is a buy order this consists of buying below the current price, so that like the orders previously exposed, this has two main uses, either to buy at a desirable price for a price turn (operation in long) or to close a sale at a defined price (short operation). For instance:
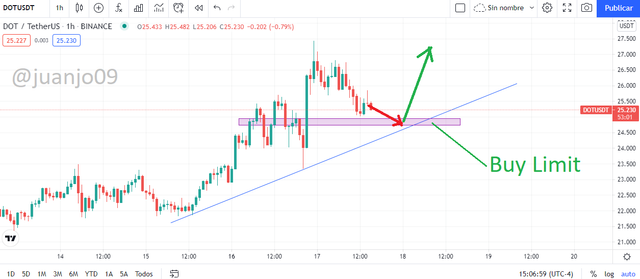
This graph corresponds to DOT / USDT we see an uptrend denoted by the blue line, a Buy Limit order would be used to buy after the correction (Red arrow) to follow its uptrend (green arrow), We would be trading long, so that we would buy at the lowest desired price and then sell after the price increase.
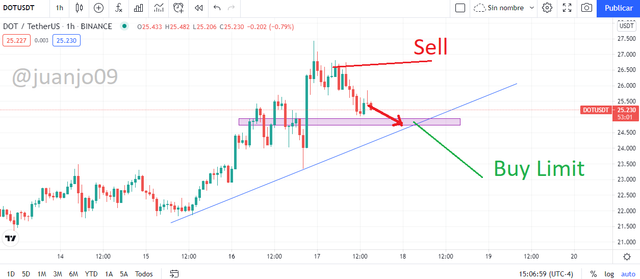
Another example would be that we have executed a short operation, sell at $ 26.5 (where indicated) and place a Buy Limit order to close our sell operation.
What is Sell Limit?
In a similar but opposite way to the Buy Limit order, this order executes a sale above the current price, this either to sell at a fixed price to close the buy position (long operation) or to sell at a desired price with certainty of a price shift (short trade). for instance:
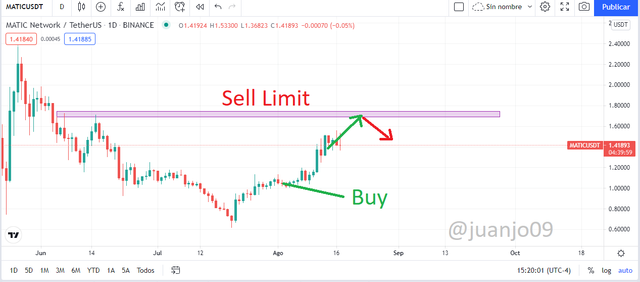
This graph corresponds to the MATIC / USDT pair, let's assume the following scenario, suppose that I buy at a price of $ 1.08 a Sell Limit order placed at that point (purple box) that I assume as resistance would be ideal since it would close my buy position at a top price.
Another example is simply being certain that this level is a support for a price turn, you would open a short trade with that Sell Limit order.
Trailing Stop Loss
The Trailing Stop Loss in summary is a strategy that consists of a variation of stop loss orders in the direction of the desired trend, for example, in an uptrend at the price, breaking early resistance would drag the stop loss to one level at a time. higher. This way of working is something dynamic in addition to the fact that the operator does not control to what extent to exit the position, this is decided by the market since you do not expect a particular goal or speculate a specific resistance and / or support, so that you only leave that the market takes you out of position. Let's see an example:
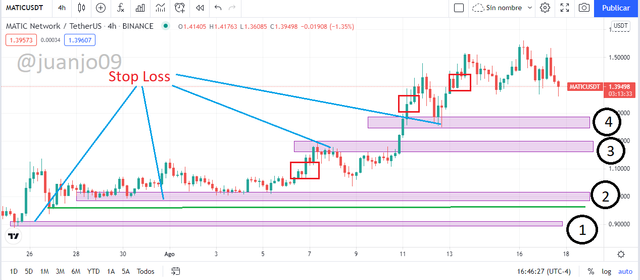
This same pair MATIC / USDT suppose the following scenario, I decide to make a purchase of the token on the green line of the image on July 27 and place my first stop loss (1) as the price advances until August 7 ( first red square) the first Stop Loss is eliminated and a new one is placed, the second Stop Loss (2), as time passes the price rises and when August 12 arrives, the second Stop Loss is eliminated and a new one is placed. Stop Loss (3) and for August 14 the price is quoted at ~ $ 1.39 here the third Stop Loss is eliminated dragging it again to a higher position (4) and so on until the market touches my Stop Loss and takes me out of my long position.
What is Margin Call?
When we operate with assets, generally in a broker or in a margin market, we can leverage our position, depending on whether this leverage gives us a margin of capital necessary to cover said operation, so that when the operation is not successful and you already have a Negative index, if this exceeds the margin assigned by the leverage the broker makes a Margin Call this with the intention of telling the operator to recharge his account (enter more money) to cover what is consumed by the excess loss in the leveraged position, I will give a good tools to avoid this later this later.
Risk management
Risk is always present in trading and cryptocurrencies, the management of these risks become essential since we must control our loss and profit. Keeping track of your assets and operations based on risks ensures the possibility of obtaining good profitability in your operations.
There are many tools to calculate our operations, whether they are profits or losses, Binance and its great ecosystem offers a calculator for the operations carried out whose return values are PNL and RoE, let's observe how it is and in which cases it would be used.
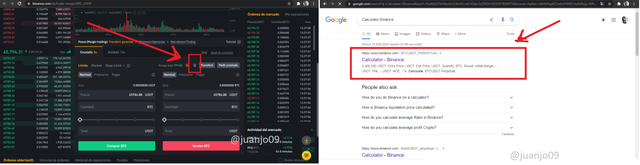
Let's see, in any graph or in the trading windows of any pair in Binance, whether Margin or futures, we can see a small icon of a calculator, or simply by searching for "Binance calculator" in google or entering this link https://www.binance.com/en/futures/LTC_USDT/calculator
In this calculator we see the following ...
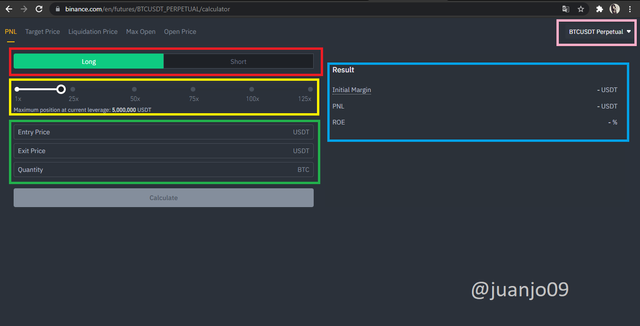
Where we identify the following (with colored squares):
We can designate the operation performed, either short or long (red square)
The multiplier times the leverage we use (yellow square)
the values to enter, entry price, exit price and quantity of the coin (green square)
The pair or perpetual symbol to choose (pink square)
Results, among these the initial Margin, the PNL and the RoE (blue square)
Let's look at an example of its use for a leveraged trade.
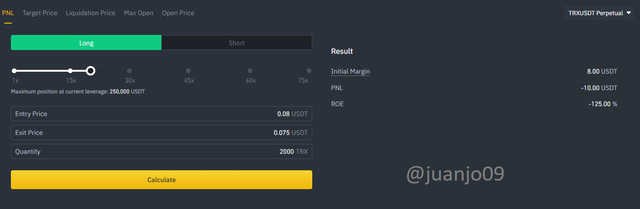
Suppose I make a long trade with the TRX / USDT pair, I decide to leverage for 20x at 2000TRX and enter a price of $ 0.08 assuming that my position was wrong and the price took a turn activating my stop loss taking me out of operation at a price of $ 0.075 we can see then that my initial margin is $ 8 and for this lost operation I had a RoE of 125% loss that is to say I lost $ 10.
We noticed then that this calculator allows us to quickly calculate the hypothetical losses or gains in some leveraged or not operation, since it allows us to place a leverage of 1x.
Now suppose a real operation where we must manage and take risk, we have the following scenario, I have $ 500 to trade on Binance for example, and I want to do it with the TRX / USDT pair, let's see its graph.
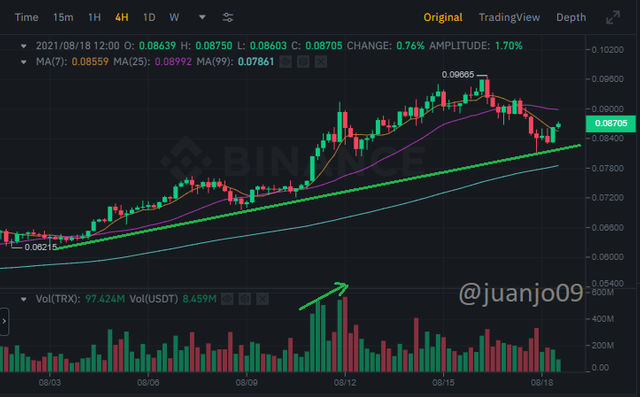
We can see that the current price is ~ $ 0.087, by performing a light technical analysis of its graph we can identify that it is in an uptrend (marked by the green line, in addition to the candles, located above the MA (99) confirming the trend, we can also see a great interest from the market for the price to rise due to its large volume and demand a few days ago, on the other hand we can imagine a next cross between the MA (7) and the MA (25). Intuition and analysis is that the price continues to rise and reaches the price of ~ $ 0.096 again then, I can already figure a trade, recognizing a slight support in the trend it would be good to place a Stop Loss (Sell Stop Order) at prices of ~ $ 0.08 and my target price is ~ $ 0.096.
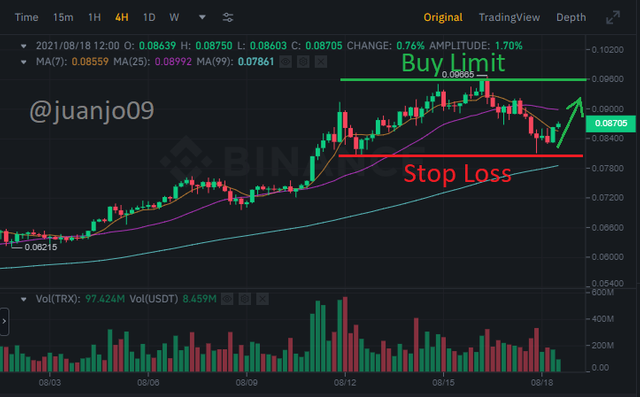
But how much would he earn, and how much could he lose, how much money should he leverage? Here we can use the calculator shown above.
Note that my capital is $ 500 dollars, my risk management is only risking 1% of my capital so I am willing to lose $ 5 dollars in this operation, let's see the calculator.
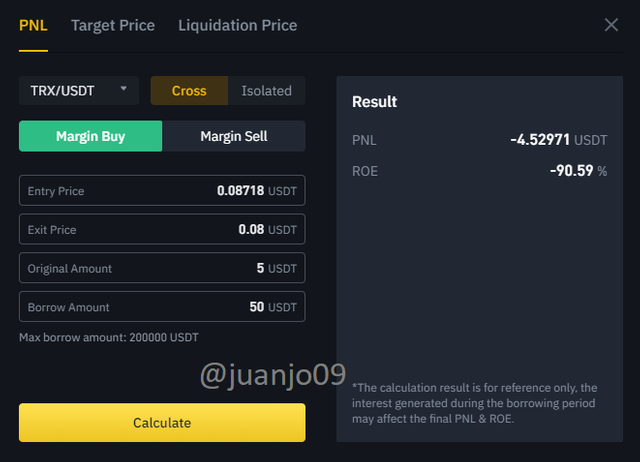
Assuming that I leverage 10x according to the location where I want to place my Stop Loss, the ideal would be to bet only $ 5, in case of losing the operation (my Sell Stop order is activated) I would be losing exactly $ 4.54 dollars, that is, less than 1% of my capital so okay. In case the price touches my target price (my Buy Limit order is activated) we can see the following.
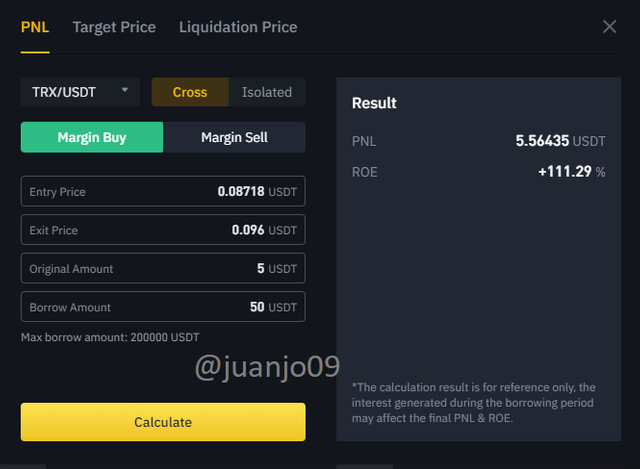
We can see then that it is good risk management, I would be risking less than 1% of my capital and if the operation is successful I would be earning 111.29% of the investment, that is, I would obtain a profit of $ 5.56.
Conclusion
Risk management is important when it comes to our pocket, especially in stock market operations, where we can lose a large part or even all of our capital if we do not manage risks, so that managing certain criteria and principles for operations always gives us possibility of seeing great profitability when trading.
I hope that the operation and examples given here have been a great contribution to the risk management of all those who venture into stock operations.
This is all my delivery, a big hug to all.
Hi @juanjo09
Thanks for participating in the Steemit Crypto Academy
Feedback
This is good content. Well done with your practical study on Risk management.
Thank you very much teacher