Crypto Academy Week 12 - Homework Post for @kouba01 | Marcador RSI ES/EN
Un gran saludo a todos los docentes y alumnos de la #cryptoacademy, en esta oportunidad nos toca aprender sobre RSI una herramienta muy util para el trading, esto gracias a la iniciativa y asignatura de @kouba01. sin mas que decir, empecemos y tratemos las preguntas dadas en la conferencia de @kouba01
A big greeting to all the teachers and students of the #cryptoacademy, this time we have to learn about RSI, a very useful tool for trading, thanks to the initiative and subject of @ kouba01. without more to say, let's get started and address the questions given in @kouba01's lecture.
Que es RSI
What is RSI
RSI por sus siglas en ingles significa "indice de fuerza relativa" (Relative Strength Index) y es una herramienta que nos ayuda en el trading, pues, se utiliza para estipular la velocidad de cambios de precios y tambien los posibles niveles de sobre compra o sobre venta.
RSI for its acronym in English means "Relative Strength Index" and it is a tool that helps us in trading, because it is used to stipulate the speed of price changes and also the possible levels of overbought or on sale.
Podemos encontrar el origen del indicador RSI en el libro New Concepts in Technical Trading Systems publicado en 1978 por J Welles Wilder. a pesar de ser algo antecuado es un concepto que hoy se utiliza inclusive en las plataformas de trading para divisas criptograficas
We can find the origin of the RSI indicator in the book New Concepts in Technical Trading Systems published in 1978 by J Welles Wilder. Despite being somewhat old, it is a concept that is used today even in trading platforms for crypto currencies.
¿Como se calcula el RSI?
How is the RSI calculated?
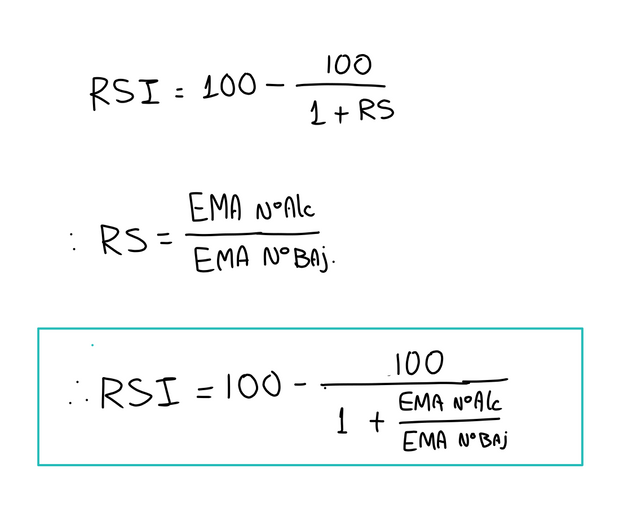
La definicion mas simple del RSI es la siguiente:
The simplest definition of RSI is the following:
RSI = 100 - 100/(1+RS)
pero ahora, ¿como calculamos RS? la fuerza relativa o RS es un cociente entre la ganancia promedio y la perdida promedio, sin embargo, recordemos que al trabajar graficamente debemos tomar en cuenta los periodos a calcular para asi conocer esa ganancia y perdida promedio, para esto podemos usar los conceptos de EMA (Media Movil Exponencial) (puede verse mas informacion sobre el EMA aquí. Entonces, con esto podemos decir que la fuerza relativa RS se define:
but now, how do we calculate RS? The relative strength or RS is a quotient between the average gain and the average loss, however, remember that when working graphically we must take into account the periods to be calculated in order to know that average gain and loss, for this we can use the EMA concepts (Exponential Mobile Media) (more information about the EMA can be seen here So, with this we can say that the relative strength RS is defined:
RS = EMA de 'N' períodos alcistas / |EMA de 'N' períodos bajistas|
Donde las barras verticales nos indica valor absoluto. Con esto podemos entonces obtener una definicion directa del RSI si sustituimos:
Where the vertical bars indicate absolute value. With this we can then obtain a direct definition of the RSI if we substitute:
RSI = 100 - 100/(1+ [RS = EMA de 'N' períodos alcistas / |EMA de 'N' períodos bajistas]|)
para facilitar esta deficinicion visualmente la escribimos asi:
to facilitate this definition visually we write it like this:
¿Podemos confiar en el RSI en el comercio de criptomonedas y por qué?
Can we trust the RSI in cryptocurrency trading and why?
Sabemos bien que el RSI es solo una herramienta, un indicador que nos revela parte de información para estipular la orientación del mercado, sin embargo, no es una ciencia cierta, de modo que solo con RSI no podríamos orientarnos totalmente en el mercado cryptografico, sin embargo, podríamos complementarlo con otras herramientas de análisis y técnicas de trading para ayudarnos en nuestras inversiones.
We know well that the RSI is just a tool, an indicator that reveals some information to us to stipulate the market orientation, however, it is not a certain science, so that only with RSI we could not fully orient ourselves in the cryptographic market, without However, we may supplement it with other analysis tools and trading techniques to assist us in our investments.
en conclusión, el RSI es solo un indicador matemático, que nos ayuda y nos da un panorama técnico a la hora de hacer trading en el mercado, por tanto, tiene la misma relevancia que otros indicadores.
In conclusion, the RSI is just a mathematical indicator, which helps us and gives us a technical overview when trading in the market, therefore, it has the same relevance as other indicators.
¿Cómo se configura el indicador RSI en el gráfico y qué significa el parámetro de longitud?
How is the RSI indicator set on the chart and what does the length parameter mean?
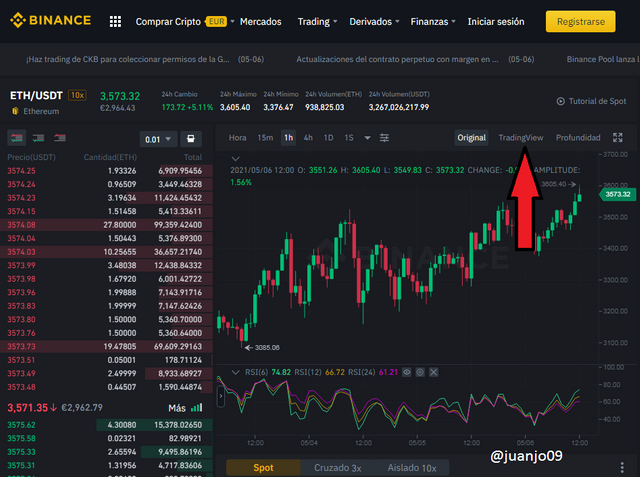
Para configurar el indicador RSI en cualquier exhange o visualizador de trading, debemos primero escoger un par de nuestra preferencia, como ejemplo usare el Exchange de Binance y usare el par ETH/USDT
To configure the RSI indicator in any exhange or trading viewer, we must first choose a pair of our preference, as an example I will use the Binance Exchange and I will use the ETH / USDT pair
aquí nos dirigimos a la sección de "trading view".
here we go to the "trading view" section.
luego seleccionamos en este icono para buscar los marcadores técnicos
then we select on this icon to look for the technical markers

y buscamos el que deseamos en este caso el RSI
and we look for the one we want in this case the RSI

una vez seleccionado nos aparece en pantalla y podemos configurarlo a nuestro antojo en el siguiente boton
Once selected, it appears on the screen and we can configure it to our liking in the following button


Pero ¿que es el parámetro longitud? Pues no es mas que la medida que nos vincula directamente con el tiempo y manifiesta los cambios de longitud según sea su formato de tiempo, es decir, una longitud de 6 en una hora nos mostrara el RSI y su cambio en 6 horas.
But what is the length parameter? Well, it is nothing more than the measure that directly links us with time and shows the changes in length according to its time format, that is, a length of 6 in an hour will show us the RSI and its change in 6 hours.
Podemos ver que en Binance las longitudes son 6, 12 y 24. Sin embargo, en muchos coin market vemos que el estandar es 14, esto porque el creador del RSI, nos menciona que es una medida ni regular, ya que no es ni tan corta para mal interpretar las falsas señales ni tan larga como pasar por alto los cambios.
We can see that in Binance the lengths are 6, 12 and 24. However, in many coin market we see that the standard is 14, this because the creator of the RSI mentions that it is a measure or regular, since it is not even so short to misinterpret false signals or as long as to ignore changes.
¿Podemos configurar o cambiar la longitud?
Can we configure or change the length?
Así es, en la mayoría de los tradingview se puede cambiar, por ejemplo en Binance podemos modificar Ia longitud marcada que nos aparece en su marcador técnico, pero recuerda, si lo pones de poca longitud, puedes mal interpretar algunas señales del RSI y si lo pones muy largo te perderás de muchas cosas.
That's right, in most trading views it can be changed, for example in Binance we can modify the marked length that appears in its technical marker, but remember, if you make it short, you can misinterpret some RSI signals and if it does you put too long you will miss many things.
Quiero mostrarles que pasa si colocamos el indica RSI con longitud 1
I want to show you what happens if we place the indicates RSI with length 1
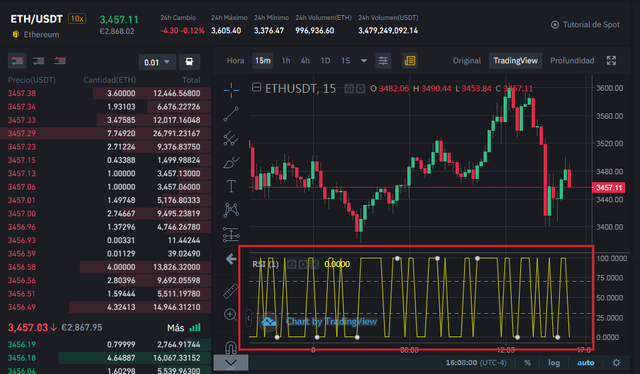
puede verse que no puede analizarse nada de ahí, pues solo termina mostrándonos picos en funcion de su creciente o decreciente estado y a continuación podemos ver que pasa si colocamos una longitud muy grande, y es que la linea se suele ver casi horizontal, sin embargo, algunos suelen utilizar grandes longitudes para traducir algunosn datos del indicador.
It can be seen that nothing can be analyzed from there, because it only ends up showing us peaks based on their increasing or decreasing state and then we can see what happens if we place a very large length, and that is that the line is usually seen almost horizontal, however, some tend to use long lengths to translate some of the indicator data.

¿Cómo interpreta las señales de sobrecompra y sobreventa cuando opera con criptomonedas?
How do you interpret overbought and oversold signals when trading cryptocurrencies?
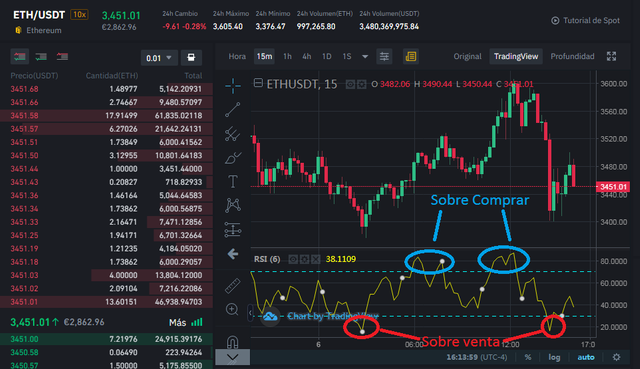
El indicador RSI se mueve en un intervalo de 0 a 100 por tanto se delimita una barra maxima (70) y una barra minima (30) cualquier señal que este por encima de 70 es una sobre compra y si baja de 30 es una sobreventa. veamos un ejemplo con el par ETH/USDT.
The RSI indicator moves in an interval from 0 to 100, therefore a maximum bar (70) and a minimum bar (30) are delimited. Any signal that is above 70 is an overbought and if it falls below 30 it is an oversold. Let's look at an example with the ETH / USDT pair.
¿Cómo filtramos las señales RSI para distinguir y reconocer señales verdaderas de señales falsas?
How do we filter RSI signals to distinguish and recognize true signals from false signals?
Para filtrar una señal RSI debemos conocer que existen distintos tipos de divergencia RSI, estas divergencias entre el precio y el indicador RSI nos puede brindar información sobre un movimiento correctivo del precio de la divisa o un giro en cuanto a su precio. Debemos saber que hay distintos tipos de divergencias entre ellos varían en función de si se produce un cambio de tendencia o no y en función de la dirección de la tendencia, con estos grandes grupos podemos hacer una subclasificación, existen la divergencia RSI estándar o clásica, la divergencia RSI oculta, La divergencia RSI alcista y La divergencia RSI bajista. veamos un ejemplo con la gráfica.
To filter an RSI signal we must know that there are different types of RSI divergence, these divergences between the price and the RSI indicator can provide us with information about a corrective movement in the price of the currency or a turn in its price. We must know that there are different types of divergences between them, they vary depending on whether there is a change in trend or not and depending on the direction of the trend, with these large groups we can do a sub-classification, there are ** the standard RSI divergence or classic **, ** hidden RSI divergence **, ** bullish RSI divergence ** and ** bearish RSI divergence **. Let's see an example with the graph.

Para dar un análisis de si existe o no una divergencia, debemos observar que congruencia tiene el gráfico RSI con la gráfica del mercado. observemos lo siguiente...
To give an analysis of whether or not there is a divergence, we must observe how congruent the RSI chart has with the market chart. Let's look at the following ...
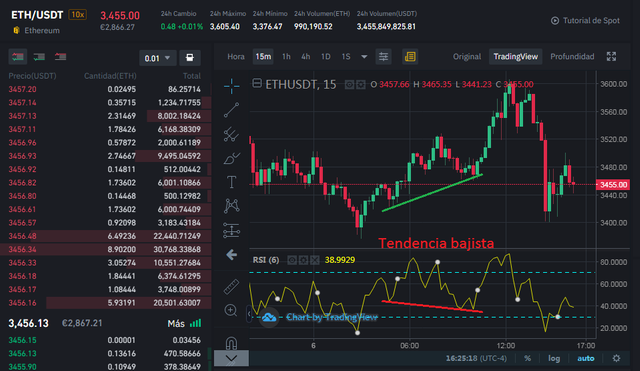
Podemos observar que en el grafico RSI este tiene una tendencia a bajar al medir de pico a pico pero justo en ese momento en la grafica subio. podemos entonces decir que en mercado es tentativo a bajar, esto pues al momento en el que se está produciendo una tendencia alcista en la grafica de precios, el indicador RSI marca una tendencia bajista. Es por esto que se produce una divergencia bajista, es decir esta incongruencia nos revela un cambio de tendencia una posibilidad a bajar el precio.
We can see that in the RSI chart this has a tendency to go down when measuring from peak to peak but just at that moment in the chart it went up. We can then say that the market is tentative to go down, this because at the moment in which there is an upward trend in the price chart, the RSI indicator marks a downward trend. This is why there is a bearish divergence, that is, this incongruity reveals a change in trend and a possibility to lower the price.

Revise el gráfico de cualquier par y presente las diversas señales del RSI.
Check the chart of any pair and present the various RSI signals.
Veamos un ejemplo y apliquemos lo aprendido, hagamos un análisis a partir del indicador RSI. tomemos la grafica del par DOGE/USDT
Let's see an example and apply what we have learned, let's do an analysis from the RSI indicator. Let's take the chart of the DOGE / USDT pair
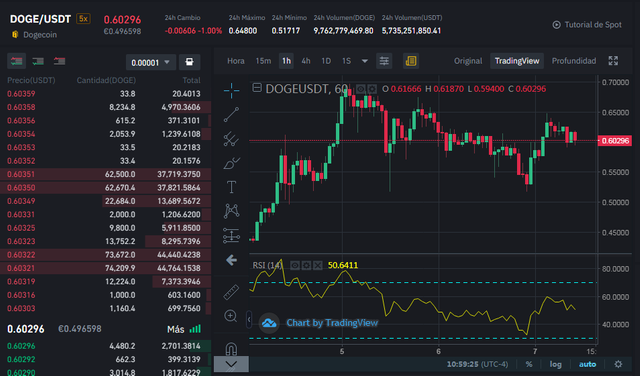
Vemos primeramente cuanto marca el valor del indicador RSI, notamos que la gráfica tiene tendencia bajista, y que el marcador va bajando, al esperar unos cuantos minutos notamos que marca por debajo de 50 esto observando las congruencias póstumas podríamos traducir como que el precio seguirá bajando, lo cual seria buena idea vender.
We first see how much the value of the RSI indicator marks, we note that the graph has a downward trend, and that the marker is going down, when we wait a few minutes we notice that it marks below 50 this observing the posthumous congruences we could translate as that the price will continue to fall , which would be a good idea to sell.
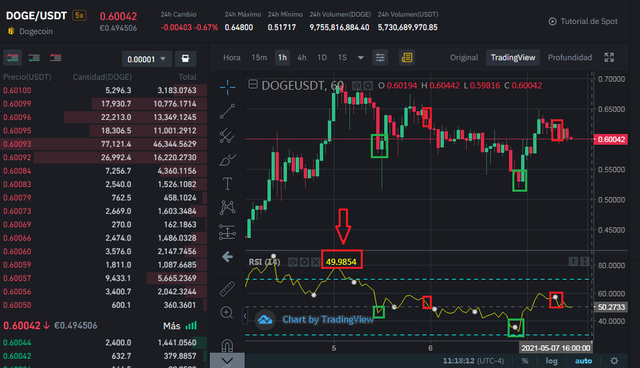
Podemos observar en todo el historial de la grafica que vemos una divergencia, observe.
We can observe throughout the history of the chart that we see a divergence, observe.
Podemos ver que el pico del 04-05-2021 a la 10:00am al pico del 05-05-2021 a las 1:00am observamos que el indicador RSI nos muestra una tendencia bajista sin embargo entre esos el precio subió lo que podemos entender que bajaría y así lo hizo. Ahora podemos encontrar otra divergencia en el parámetro RSI y los precio, observe.
We can see that the peak of 05-04-2021 at 10:00 am to the peak of 05-05-2021 at 1:00 am we observe that the RSI indicator shows us a downtrend, however among those the price rose what we can understand that he would go down and he did. Now we can find another divergence in the RSI parameter and the prices, watch.
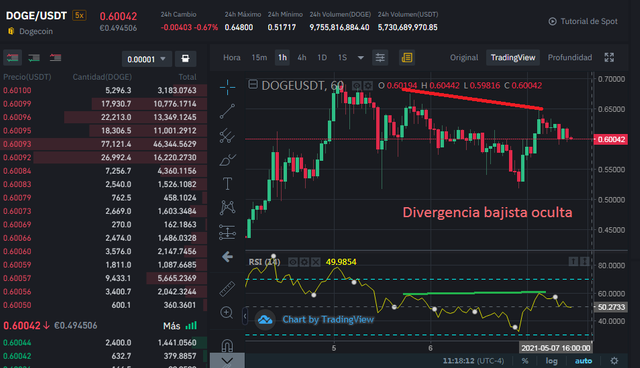
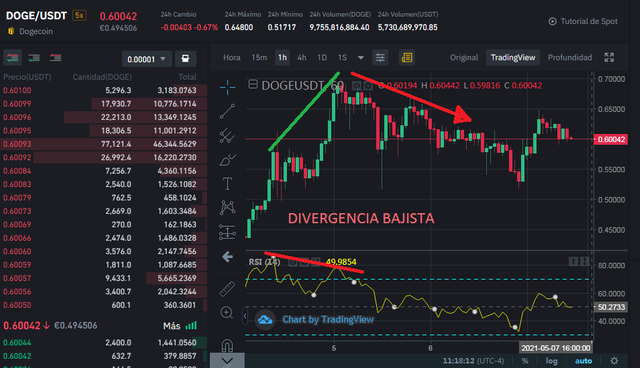
Observe que en los máximos consecutivos del precio bajan mientras que en el indicador RSI nos muestra dos picos máximos consecutivos pero mas alto que el anterior, esto se conoce como "Divergencia Bajista RSI Oculta" lo que nos indica una vez mas que el precio del DOGE tendera a bajar en los próximos días.
Observe that in the consecutive highs of the price they go down while the RSI indicator shows us two consecutive maximum peaks but higher than the previous one, this is known as "Hidden RSI Bearish Divergence" which indicates once again that the price of the DOGE will tend to decline in the next few days.
Conclusión
Conclution
EL RSI es un indicador técnico que nos brinda mucha información a la hora de buscar predecir los precios, de modo que si complementamos esta tecnica junto a otras podemos hacer estrategias de trading exitosas.
RSI is a technical indicator that gives us a lot of information when trying to predict prices, so that if we complement this technique with others we can make successful trading strategies.
por otro lado, no se puede depender únicamente de este indicador, ya que pueden haber cambios o giros que nos tomen de sorpresa, sin embargo, es bue método para agregarlo en nuestro repertorio de análisis. Hoy aplique este método con el DOGE coin, entre otras herramientas de análisis veamos si me resultara, todo por aprender esta interesante disciplina
On the other hand, it is not possible to depend solely on this indicator, since there may be changes or twists that take us by surprise, however, it is a good method to add it to our analysis repertoire. Today I applied this method with the DOGE coin, among other analysis tools, let's see if it will work for me, all for learning this interesting discipline
Hello @juanjo09,
Thank you for participating in the 4th Week Crypto Course in its second season and for your efforts to complete the suggested tasks, you deserve a 9/10 rating, according to the following scale:
My review :
Great content, your answers have a meticulous and clear methodology. On the signal filtering question, it would have expanded further as a reminder to compare RSI with other indicators to confirm or reject the signal.
Thanks again for your effort, and we look forward to reading your next work.
Sincerely,@kouba01
Thank you very much professor for your prompt qualification, I learned a lot with this topic, I plan to put it into practice together with other technical and analysis methods to be successful in trading, thank you again.