Crypto Academy / Season 3 / Week 7 - Homework Post for @yousafharoonkhan | How to create an account on TradingView, how to use indicators,tools, features of tradingview | by: @juanjo09
A big greeting to all my friends and colleagues from the #cryptoacademy and a special greeting to cryptoprofessors, this time we will study a very useful and well-known platform that facilitates the monitoring of the price of many assets, I mean TradingView is the platform of world's most popular online stock market charts.
In this post I will show:
What is TradingView and how to create an account.
Features.
We will know how to configure the graph and some tools.
We will see how to add any indicator.
I will also conclude with a personal opinion about TradingView. Without more to say, let's get started.
What is TradingView and how to create an account?
TradingView is an online stock market charting platform, which collects more than 29 million charts. However, TradingView is not considered just a data collection platform but a social network since it has more than 30 million users, between traders and investors, who chat and negotiate directly with the platform's charts.
TradingView seeks to be the first analysis platform in the world based entirely on browsers and with cloud technology, this further helps the expansion of the project and is that currently TradingView is already used by many companies and retailers, as it offers high analysis technology and tools such as a large number of indicators and an interactive interface in real time that facilitates the professional use of this platform.
TradingView was very popular quickly, as it was created in 2012 by former veterans of the Multicharts charting market and only five years after its creation it already had more than 2.9 million users from all countries of the world.
How to create an account?
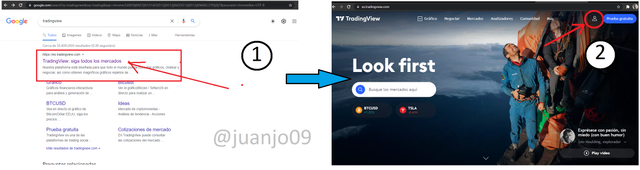
Creating an account is very simple, first we enter the official page of TradingView.com and then go to the icon in the upper left corner of the screen ...
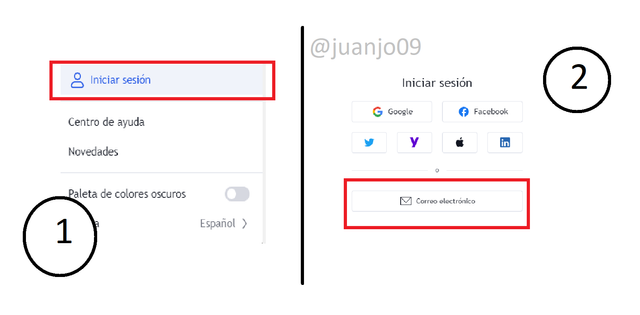
Here a mini window will appear and we will click on start session, as we do not have one, the option to register will appear, we can do it with some social networks or with our Email.
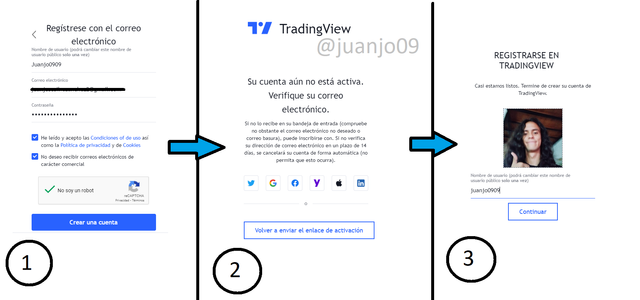
Once we decide with what we want to register, we can advance in the following steps, I register with my Email, so it asks me to arrive a set of requirements, and then validate my account with my email, finally it asks me to upload my profile photo and username.
Once registered, when loading the TradingView page together with our profile, its price monitoring interface, chat, among other multiple functions appears.

With this, we should have our account created, we must remember that this is a free version and we can acquire any of its plans for free for 30 days, let us know these plans and their characteristics.
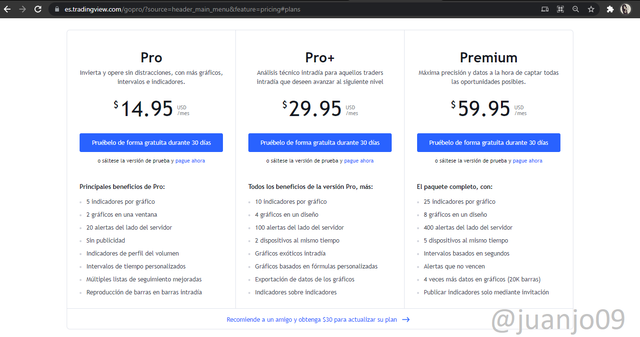
As we can see in the image we have three plans
A PRO plan with a cost of $ 14.95 per month, this plan consists of:
- 5 indicators per chart
- 2 graphics in one window
- 20 server-side alerts
- No advertising
- Volume profile indicators
- Custom time intervals
- Multiple improved watchlists
- Reproduction of bars in intraday bars
A PRO + plan, which costs $ 29.95 per month, this plan offers:
- 10 indicators per chart
- 4 graphics in one layout
- 100 server-side alerts
- 2 devices at the same time
- Exotic intraday charts
- Charts based on custom formulas
- Export data from charts
- Indicators on indicators
And finally a Premium plan of $ 59.95 per month, this great plan offers:
- 25 indicators per chart
- 8 graphics in one layout
- 400 server-side alerts
- 5 devices at the same time
- Intervals based on seconds
- Alerts that do not expire
- 4 times more data in charts (20K bars)
- Publish indicators by invitation only
TradingView features
TradingView has a lot to offer it has a very good and diverse set of features.
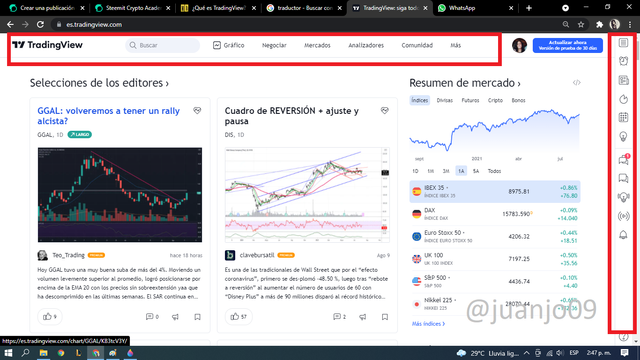
Graphics Section
In the upper part we have first the graphs section where we have the whole set of graphs that we want to look for, be it stocks, Forex, cryptocurrencies, etc. In this section it offers us all the tools and indicators that help us to interpret, analyze or study charts of different markets. I will do a little more emphasis in this section later.
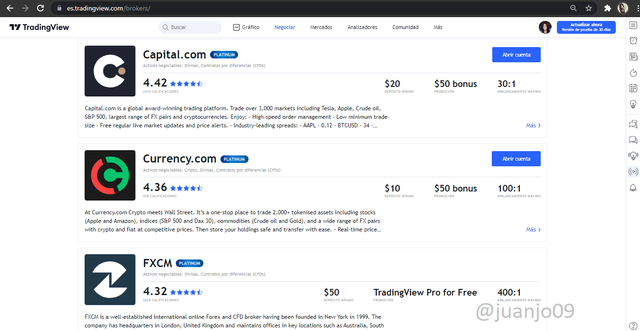
Business Section
It had a Business section where it offers the Brokers recommended by the platform, the main ones are ** Capital.com **, ** Currency.com ** and ** FXCM **
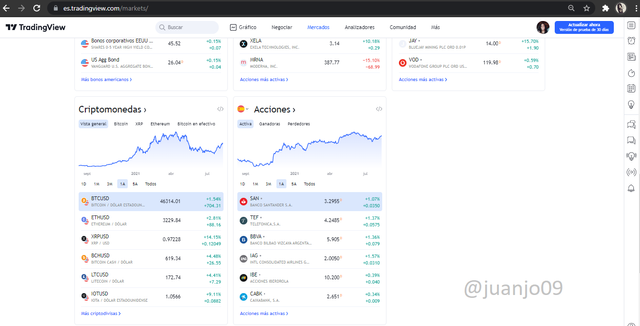
Market Section
It has a Market section, where each and every one of them is framed separately, among these we have the Cryptocurrency market, stocks, index, currencies, futures and bonds.
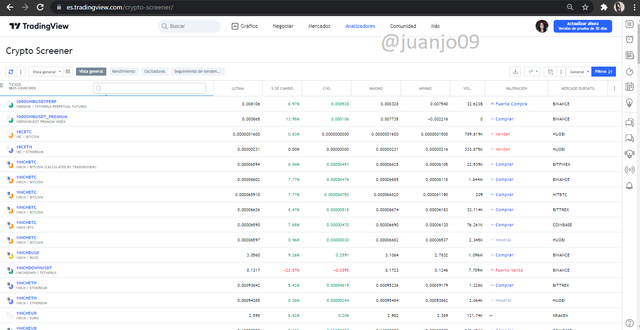
Analyzers Section
Then it has one of my favorite sections that analyzers, here we can find Stock analyzers, Forex Analyzer and Crypto screener, very useful when operating since it analyzes the position or circumstance, favorable or unfavorable of an asset.
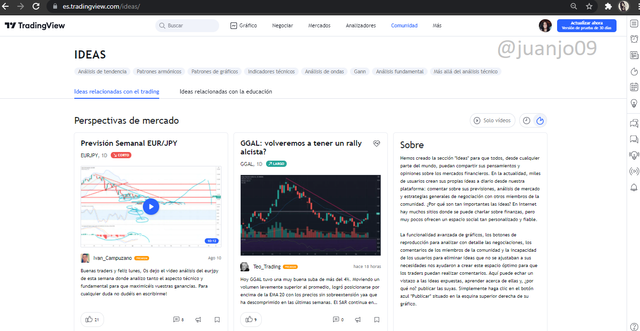
Community Section
And as another of my favorite sections is the community since it is the social part of the platform where you can interact, read opinions and analysis of other traders.
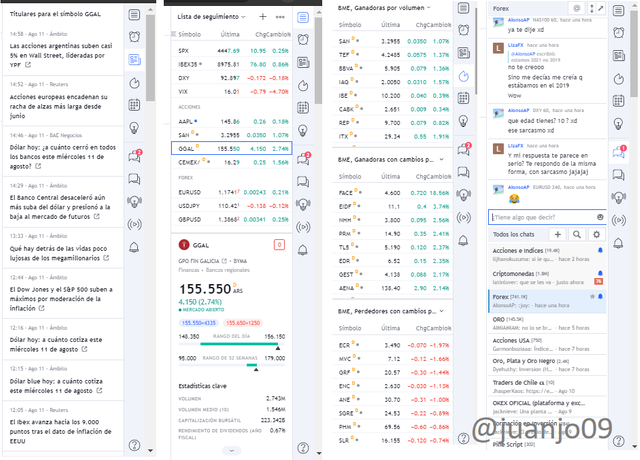
Finally, to the right of the page with our profile, it offers us a very varied set of interactions, showing us a section of alarms, news and general chat, making the TradingView experience more dynamic and comprehensive.
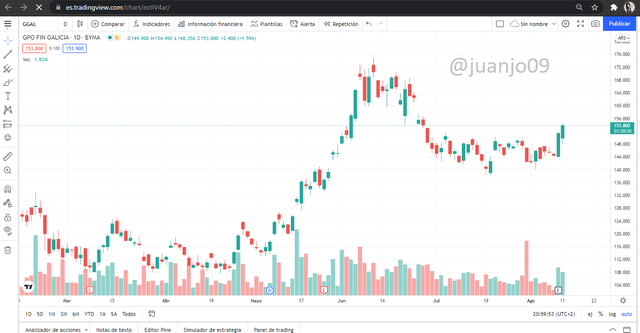
How to set up a chart in TradingView and use two tools to edit it
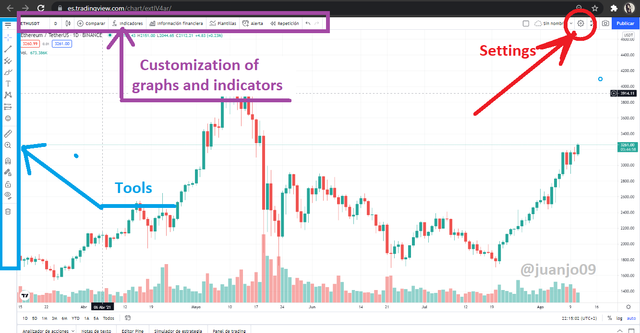
Let's know a little more about the TradingView chart section, the basic interface provides a large set of characters and I divide them as follows: a chart customization section, a tools section and the configuration section, where we can also customize our chart.
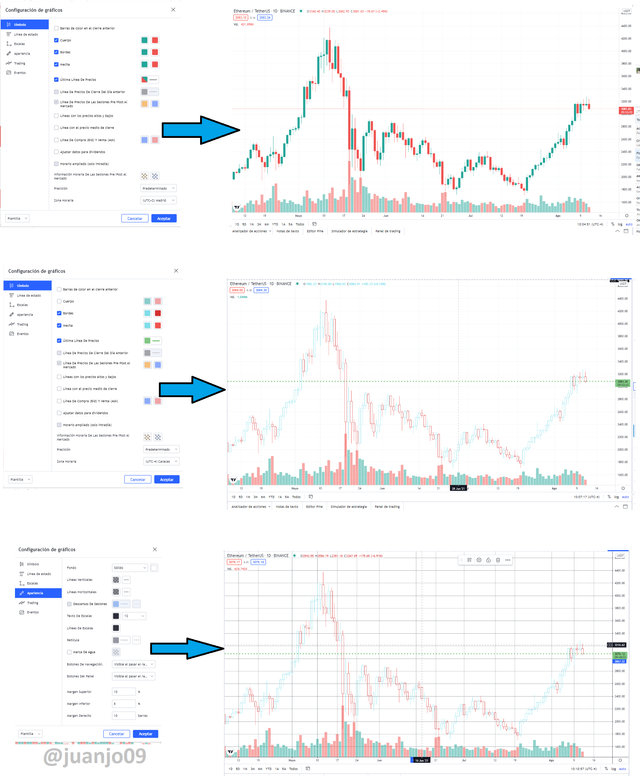
Primero exploremos el botos de configuracion, con este podemos modificar y personalizar distintios aspectos de la grafica como las velas las reticulas e inclusive personalizarlo para que nos muestre nuestras ejecuciones en el mercado e interaccion con la grafica, veamos como podemos editar la grafica a nuestro antojo con el boton de configuracion.
Setting
We can see, from top to bottom, that we can change the colors of the candles, their filling edges and even the wick, in addition to being able to change the text on the screen, darken or edit the opacity of the background grids up to the current price line, since we have a set of 6 windows to edit the graph, let's explore each of these in more detail.
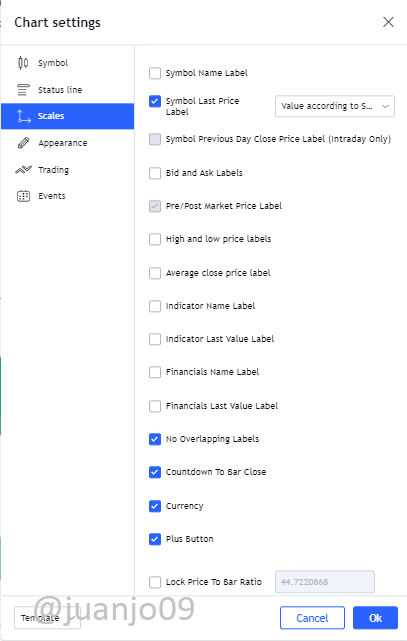
Edition of symbols: in this window we can edit the candles or the price symbols, customizing their color in general, in addition to editing price closing lines and last price, being able to change their color, thickness or opacity.
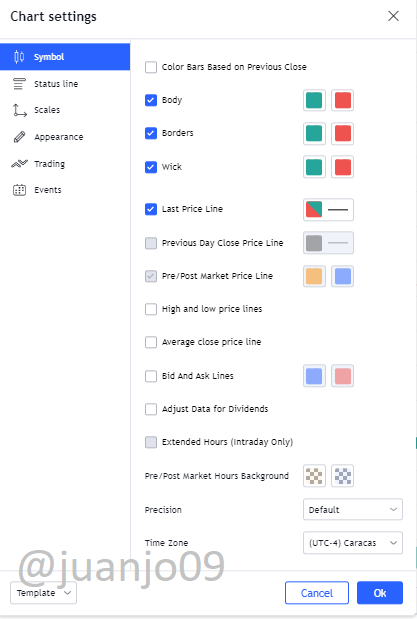
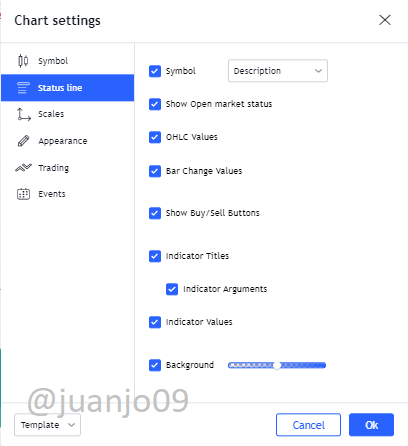
Editing Status Lines: Here we can edit the text that is displayed on the screen, such as the symbol of the chosen pair, the OHLC values and others. We can change their color, opacity or size.
Scale Edition: We can edit the high or low price tags, we can include or remove the Bid and Ask prices among others.
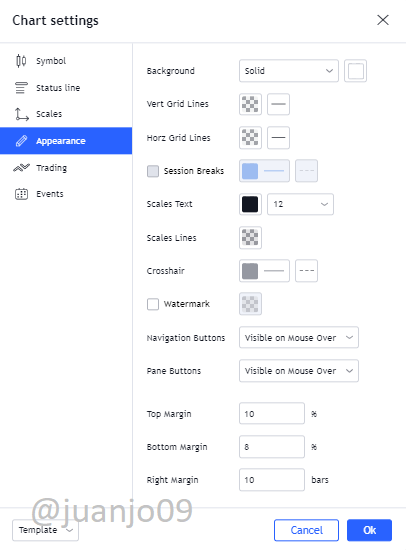
Appearance Edition: Here we can edit the appearance of our graph, change the background color, the grids, visible navigation buttons, margins and others.
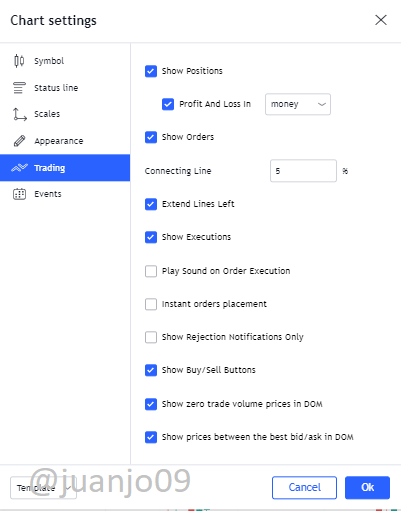
Trading Edition: Here we can configure the execution sampling of our positions or executions, facilitating a follow-up of our interaction with the market.
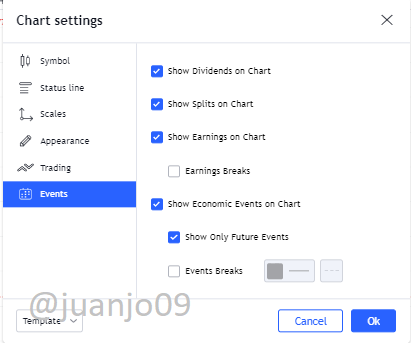
Event Edition: Here we can edit the events carried out, for example future events, show profits, dividends and others.
Indicators and events
This stage is found at the top of the chart, here we can find a very varied set of indicators and tools, as well as events to better manage and interpret any desired chart. Let's explore this section in detail.
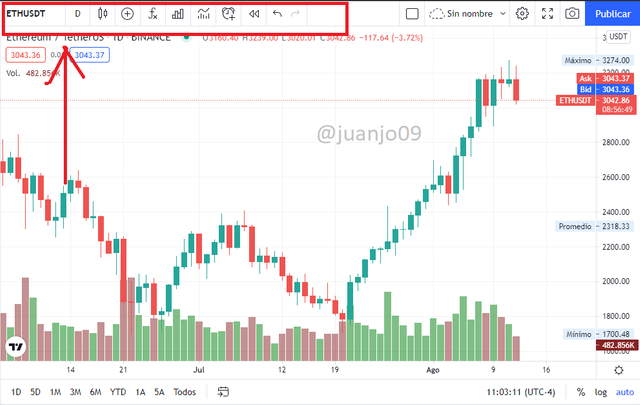
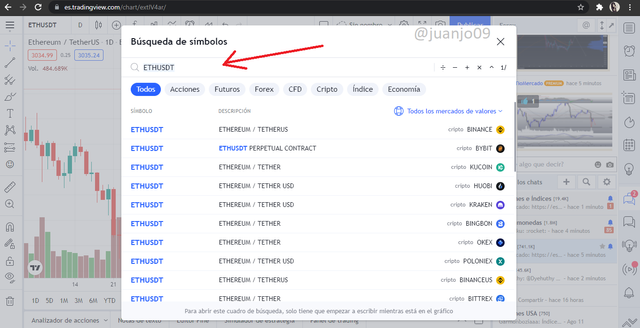
We can see a set of buttons with multiple functions as the first button we have the symbol or pair search engine. Here we can search for any desired pair, be it cryptocurrencies, stocks, currencies, among others. Remember that there are more than 29 million graphics!
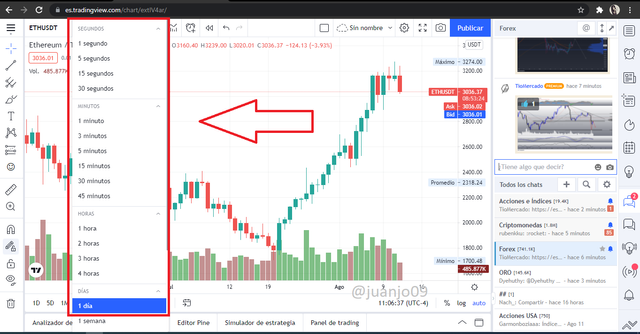
From left to right after the pairs button, we can configure the time of the chart, either 1m, 1h, 1D, 1S or more, since TradingView offers us a large number of periods.
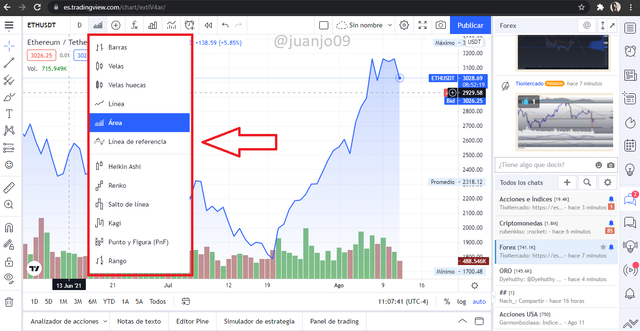
As a third button we have the price reprecentation configuration, as we can choose Japanese candles, bars, roe candles, Heikin Ashi, PnF, among others.
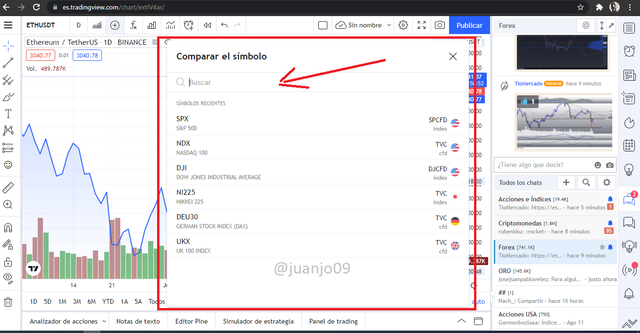
In the fourth button we can add other pairs for the comparison of this with the represented one, this appears to us in a numerical way in the upper left corner of the graph.
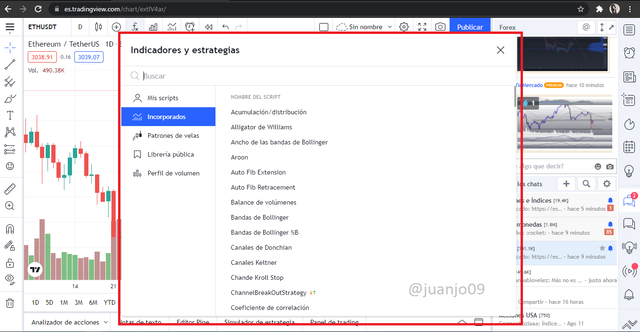
As the fifth button offers a selection window for a large number of technical indicators, all the ones you can imagine are there, just use the window's search engine to find the one you want to show on the chart.
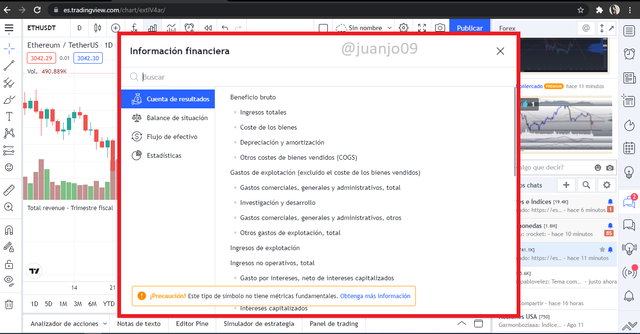
The next button is the financial information, a useful tool to operate, however not with all the assets it gives us this information, but it has a large number of symbols to show us the financial information of the asset.
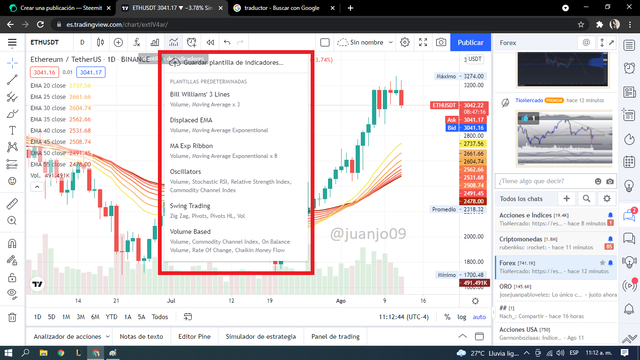
The next button is the templates button, it already offers a set of templates with more common indicators used together for different strategies, some well known and others more unique.
As the second to last button is the alarm button, where we can locate different alarms so that at the price reaching that mark will alert us immediately.
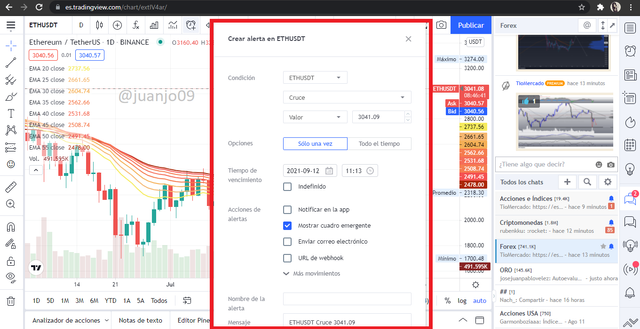
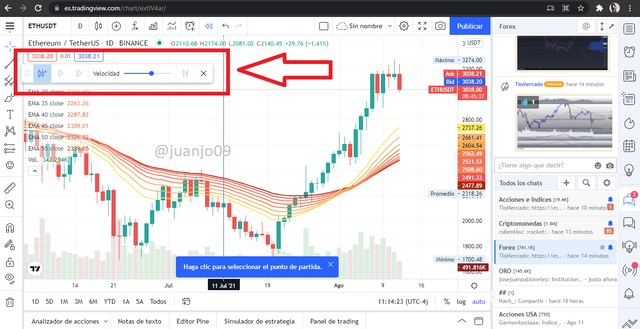
Finally, it has the reproduction of bars, which is a useful tool to be able to study the behavior of the bars at a certain moment and to be able to reproduce it at different speeds.
Tools
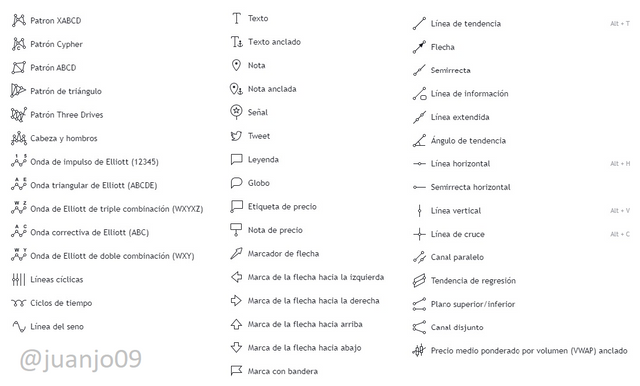
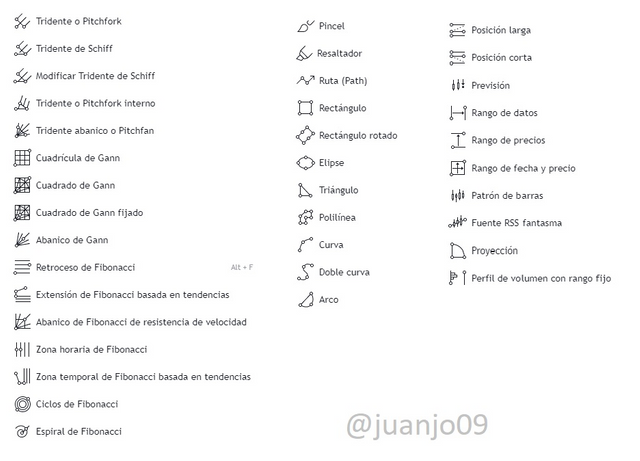
A la izquierda del grafico, TradingView nos ofrece un gran numero de herramientas de edicion y dibujo sobre el grafico, actualmente cuenta con mas de 70 herramientas de dibujo y diseño, entre estos
Herramientas de linea de tendencia
Herramientas Gann y Fibonacci
Formas geometricas
Herramientas de anotación
Patrones
Herramientas de prediccion y medida
Iconos y mas...
How to add Technical Indicators?
We already knew each of the tools and characteristics that the TradeView chart offers us, now we know how to place indicators, let's see, their placement is very simple since we only need to look for them and click.
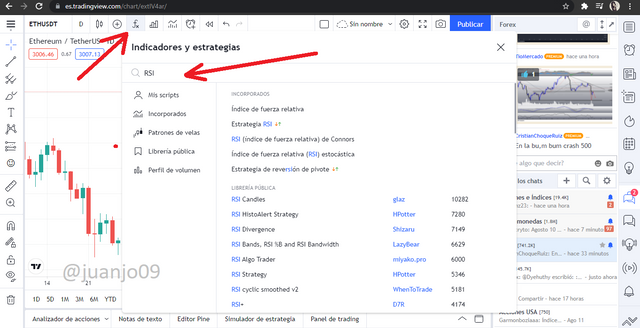
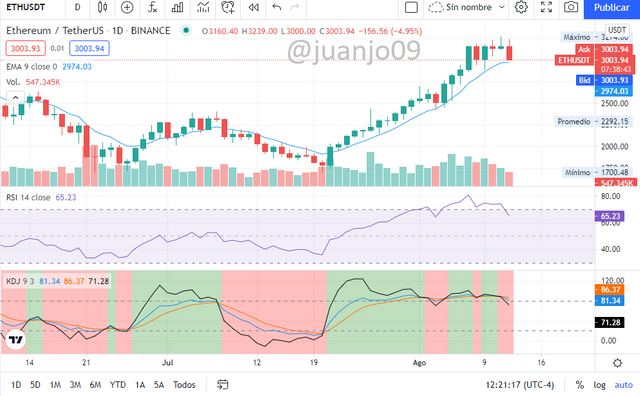
First, in the button of technical indicators that is located in the upper left part of the graph, when pressing it, as we saw before; It opens the window to search for any desired indicator, in this case I will add two of my favorites. First I will add the RSI which is an indicator of trend strength, for this you just have to write its name in the search engine and select it.
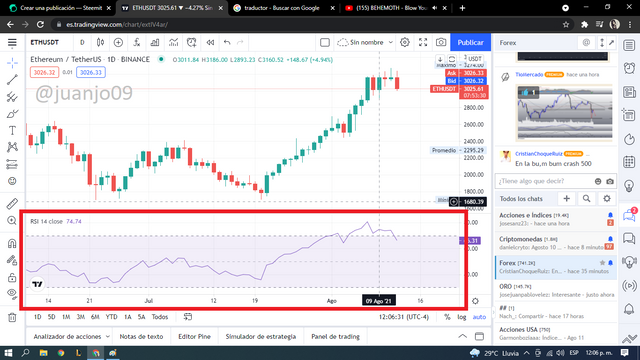
Once we have our technical indicator in view, we will only click on it and it will automatically be added to the chart, as you can see in the following image.
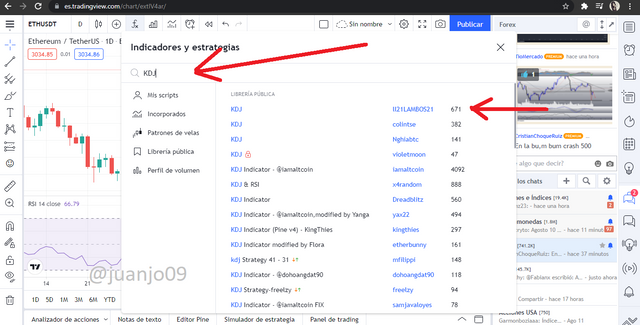
in a similar way I will add another of the indicators, in this case I will look for the KDJ indicator, others of my favorites, when typing its name, no official one appears but one programmed and added to the public library by some user.
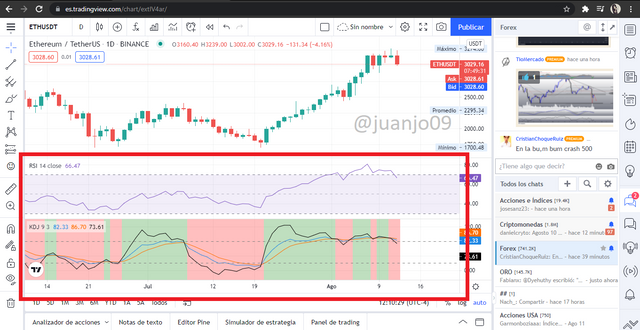
As you can see I can have these two indicators at the same time, and I can add more, however I have a limit due to my free registration, however if I pay for the Premium plan I can add more than 25 indicators to the same chart.
My opinion on TradingView and cryptocurrencies.
TradingView is a very useful platform for cryptocurrencies and those who operate with them, whether to trade or not, having a large set of indicator tools and charts of many different pairs in one place, gives us a unique facility, I personally , I see TradingView as essential, since it frames a lot in its platform, making it easy for us to constantly monitor our favorite projects.
It is true, in TradingView we cannot buy cryptocurrencies, and we cannot directly read and investigate a project, but we can see the price history with a set of tools that can help us know where and how the project we are following is oriented.
Conclusion
The objective of this post was not to show TradingView as the best platform in the world, but to expose it in its entirety, in addition to learning about its management and everything it has to offer, since without a doubt it is a platform that has facilitated and helped to a large number of retailers.
TradingView is a platform that fascinates with its breadth and scope, in this modern world with the great growth of cryptocurrencies, TradingView has helped us to know the vast world of trading and operations, its great community, expands us to share with a community new and wide from all over the world.
This has been my entire post, I hope it has been as useful to you as it was for me to do it, a greeting to crypto teachers, especially @yousafharoonkhan and the entire great set of #cryptoacademy.
All images except where otherwise stated are screenshots of the [TradingView.com] platform (https://www.tradingview.com/)
Respected first thank you very much for taking interest in SteemitCryptoAcademy
Season 3 | intermediate course class week 7
you explained well and thank you very much for taking interest in this class
Thank very much teacher.