Crypto Academy / Season 3 / Week 2 - Homework Post for @yohan2on by @juanjo09 / Trading with the Fibonacci Retracement levels
A big greeting to all my friends, colleagues and teachers of the #cryptoacademy and this time we will talk a little about how the mathematician Leonardo Fibonacci and trading are related, we know a little about the concept of Fibonacci Retracement levels and how it can be a good tool for trading and increase your security to perform this type of work.
This research is carried out thanks to the initiative of the teacher @yohan2on where, in his lecture, he teaches us and offers us a very good opening to the subject, in addition, how it is applied in practice, therefore, this post is oriented to respond to your questions given in your lecture (see here).
In this post we will know the basic concepts in addition to seeing how this would be applied in a real price graph, therefore, I will show, screenshots and give details so that we can fully understand this topic, without more to say, let's start

Image made by me
What are Fibonacci Retracement levels?
Fibonacci retracement levels are a tool to provide information on which values could be support for retracements or corrections, so that, when the trend is very marked, it facilitates the trader to identify some range values between the trend movement of the price but How are these values built?
Simple, it is based on a maximum and a minimum taken arbitrarily or by price history, so that the minimum is 0% and the maximum 100%, from this range it is divided between the Fibonacci portions, these are: 23.6%, 38.2%, 50%, 61.8%

Image made by me
See the image, these lines drawn horizontally mark price points on the graph, it can provide information proportional to the corrections that prices could have in a trend, This is very important when acting according to our intention. With this information we could place good stop losses or simply know when it would be a good opportunity to get out of the position.
How these values are built
The fibonacci sequence is easily constructed as it is a sequence where each term, after the first two, is the sum of the two previous terms. for example
1 + 1 = 2
1 + 2 = 3
2 + 3 = 5
3 + 5 = 8
5 + 8 = 13 and so on
If we go a little deeper we can notice that these numbers are separated in a similar proportion, that is, each number is approximately 1.61803 ... times the previous one to be exact is:

Image made by me
This ratio is known as ** the golden ratio ** and it is denoted as the Phi number and it is a transcendental number, but even so, where do the percentages given in the Fibonacci retracement levels come from? Well, the proportion of 61.8% is found by dividing a number in the series by its next. For example, 21 divided by 34 equals 0.6176 or 55 divided by 89 equals 0.6179. Similarly, the consequent percentage that is 38.2% is found by dividing a number in the series by the number that is two places to the right. For example, 55 divided by 144 equals 0.3819, and the 23.6% ratio is found by dividing a number in the series by the number that is three places above it. for example, 8 divided by 34 equals 0.2352. These decimals when multiplied by 100 gives you the percentage numerical value of this indicator.

Image made by me
How we apply the Fibonacci Retracement levels
Let's choose any pair in any Tradeview, in my case I will use the one offered by Binance, and the pair I chose is BNB / USDT

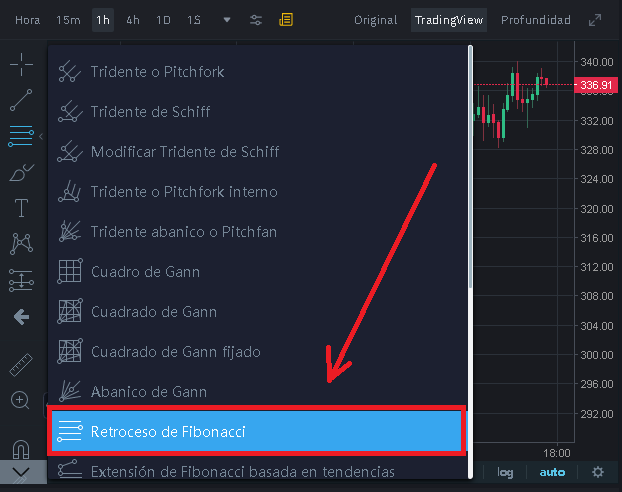
The gratifying thing is that most of the Tradeview already have a tool to draw Fibonacci retracement levels, in the case of Binance we find it on the left side of the chart.

There we will see a lot of tools to mark the graph, here we find and select the one we want.
Now once we select the indicator we can illustrate it on the screen, in the case of BNB / USDT we see a very marked uptrend, so it will be a very good example, let's see, if we choose a maximum and minimum since the trend began we see the following.
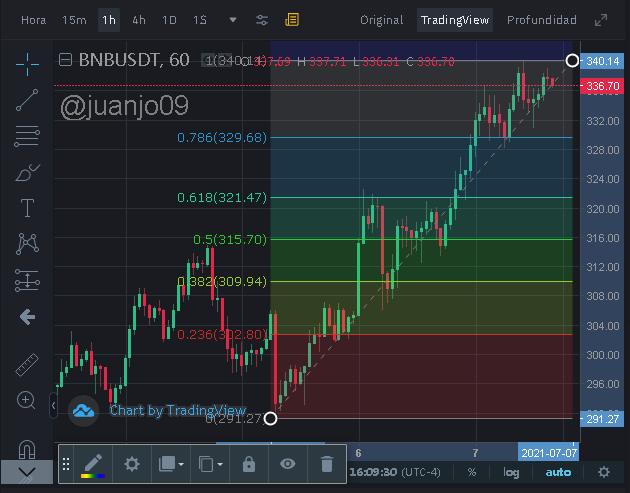
Here we can see that prices are moving upwards, however, we see some corrections and setbacks, one of the uses that we can give to Fibonacci is to be able to put Stoploss, to avoid substantial losses in a case of price reversal, we can see then, rise and in conjunction with the retracement levels, stipulate Stop Loss in these.

For example, in that first ascent, a good Stop Loss would be 23.6% above the price at the start of the trend. It can be seen then that the price has a correction, however, it is only this, it does not touch our stop loss, making us stay still within to take advantage of the trend.
See then, that if this strategy is repeated, we could continue to take advantage of the rise without being scared or disoriented if a price decrease is a correction or a price turn.

Although it can be a very good tool, it does not provide us with enough information on when prices could turn around, we would have a good support, to know when to exit our long position in this case, however, it would be vital to use other indicators, together to be able to have a correct strategy and with a greater probability of success. Let's see what we could do in this case of the pair shown.
If we use other indicators, for example the MACD and the RSI together we could have a better notion of the future price movement

If we see the graph currently and with the help of the indicators, we could see that the indicator still does not mark above 70, however, we could deduce that it has strength for a decrease, on the other hand, in the MACD histogram we observe a decrease in volumes, and an increase in prices, that is, a divergence.
This information can tell me that prices are about to fall and there may be a change in trend, however, the wisest thing would be to continue in my long position, and leave a stop loss at the closest level, in the case that it offers us. Binance could be 78.6% of the price between the marked range.
Conclution
This indicator is usually a good tool to guide and calm down when trading, since it gives us clear support levels to be able to operate calmly, however, I personally recommend complementing it with other indicators.
For me and many it is really mysterious and magical because prices tend to respect these values almost perfectly and it is impossible to know why the golden ratio is usually present in many things of our day to day, therefore, doing this activity me It seemed exciting.
Once again a greeting to the teachers of this task and a big hug to all my colleagues and friends, I hope you have enjoyed my delivery.
Until next time
Hi @juanjo09
Thanks for participating in the Steemit Crypto Academy
Feedback
This is under average content. You wrongly plotted the Fibonacci retracement levels. In the uptrend, the 0 level has to be up so that the tool can aid you in identifying the different retracement levels downwards from its normal upward movement.
This is how it was meant to be
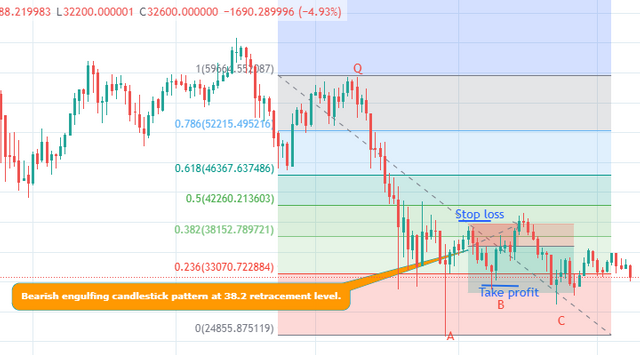
In a downtrend, you notice that it is plotted on 2 points, the previous high price point(Q) and the most recent bottom price(Point A). If I want to determine the retracement at point B, I would simply drag the 0 level to point A and watch price action at the different retracement levels as the markets pull back. I will do so in order to have a good sell entry since a strong bear market.
Homework task
3
I see, you are very right, I overlooked him. Thank you very much teacher.