Crypto Academy Week 16 - Homework Post for [@fendit]..The Wyckoff Method
INTRODUCTION
Hello my good friends, How are you doing today. And how is your loves ones doing too. I welcome you to this week home post that was given by professor @fendit on the topic: "The Wyckoff Method" I most say that her lesson so extremely wonderful which is the reason why I have discussed my homework task. Please cheer up as you read through......
(1) Share your understanding on "Composite Man" and the fundamental laws. What's your point of view on them?
My understanding on "Composite Man" and the fundamental laws is that Wyckoff believe that if traders should study the market before going into the buying and selling of assets. I understand that based on the experience of Wyckoff in the market activities of large operators he was prone to executes a campaigns that will attract traders to buy an assets in which he has being accummulating. He believed was that since he has understand the behavior of the market Composite man, traders can possibly understand much about the trading opportunities that he will benefit from them.
Another understanding here is that, investors must study each assets chart with the aim of judging the behavior of the assets, to ascertain why the asset is dominate by a large operators in the market. He feel that with the study and practice, investors/traders can be able to explain the reason why a chart always portrayed. It was this taught about investors that prompt Wyckoff to believed that if an investors can understand the behavior of the market Composite man, they could come up with different trading and Investment opportunities that will earn him enough profit from them.
My understanding on the fundamental laws:
Looking at the "Price direction is determined by supply and demand". My understanding in this fundamental laws is that when demand is greater (>) than supply, prices will become rise, and then when the supply is greater (>) than demand, prices will fall. The reasons for this law is to make us to understand the effects of the supply and demand patters, that will help us practice the market movement.
The law of cause and effect:
What I understand on this law is that the law is to helps investors in setting price by measuring the potential trend of trading. The make used of figure chart, point count and horizontal point in accumulating trade.
The law of effort versus result:
What I understand here is that price is being change in volume that is shown in the signal.
What's your point of view on them?
My view on them is that since the first fundamental laws means that too much demand over supply will make prices to rise due to the fact that many investors would be buying rather than selling. After studying both laws my view is that we should study the Wyckoff law in other to understand the relationship of the demand and supply before moving into the market.
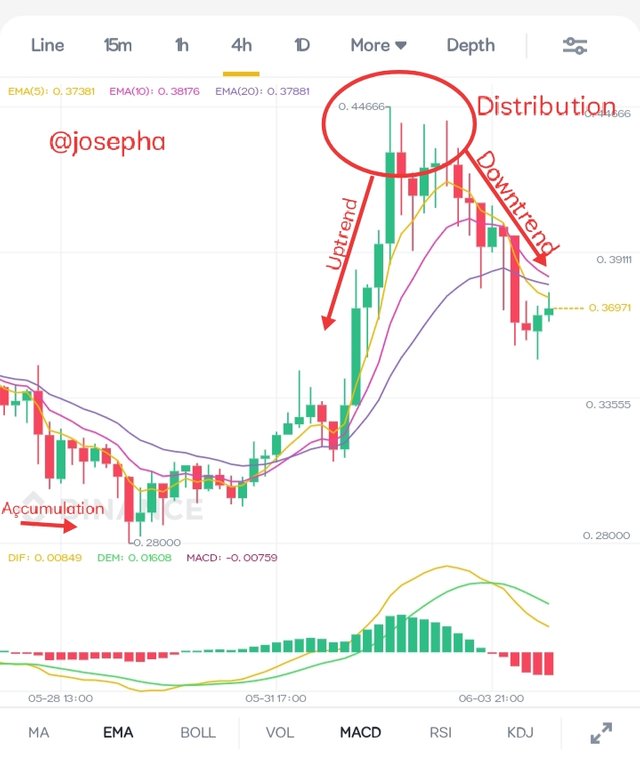
(2) Share a chart of any cryptocurrency of your choice (BTC or ETH won't be taken into account for this work) and analyze it by applying this method. Show clearly the different phases, how the volume changes and give detail of what you're seeing.
The image above is a chart of DOGE/BUSD pair chart of 4H timeframe gotten from Binance Exchange. From the chart you can see that I have marked the different phases of the Wyckoff cycle to show how the volume changes.
Accumulation: At this point the price of DOGE/USDT starts slowing down due to decrease in demand, this is as a result of low volume in the market. And from what am seeing the supply will pop up in no distance time.
Uptrend: At this point the price of DOGE/USDT has advance on increasing spread with a relatively higher volume. This usually occur in any chart when the market is in a stage bullish.
Distribution: At this point the price of DOGE/USDT has increase in volume where most investors will start selling their USDT to those that are entering the market. You can see that from the chart above there is a slideways movement that holds demand.
Downtrend: From the above chart you can see that the price of DOGE/USDT is falling to the downside as a result of those that are done selling DOGE Coin.
##Thank you for your wonderful time here......

Your chart is a bit confusing to me, please check. Thanks!
Thank you @chentanpadliya I have change the chart you can look at it now. Thanks
Thank you for being part of my lecture and completing the task!
My comments:
Nicely done! Explanations were good, but a bit too brief.
When it comes to the chart, very well done! You showed really good the phases, but I wish you had developed a bit more your analysis.
Overall score:
6/10