Crypto Academy Week 14 | Homework Post for [@fendit]...Elliott Wave Theory - Teoría de las Ondas de Elliott
INTRODUCTION
Greetings to you friends,
I'm so Glade to be here today to discussed about my homework task that was given by professor @fendit on the topic: Elliott Wave Theory - Teoría de las Ondas de Elliott. After reading and understanding the lesson be I'm to Present my homework.....
1. What's the application of this theory?
The application of this theory is to improve analytical trade and skills timing for appropriate in and out when trading in the market. The Elliott Wave Theory elaborate the waves in price movement that allow one to zoom into or out of a chart to see bigger or smaller event of Elliott Waves. The Waves intend to explain the how price is being move in two ways such as; Trend and Impulse. consolidation or corrective waves. The chart or a trade define the wave cycle that is underway, the recent waves happened, and if the wave have been noticed and the waves that is likely to happens next. The chart below shown how this waves usually partten occur.
At this point the impulse wave, will be made up of smaller waves trending in the same point, which can be show up on 1 minute charts.
2. What are impulse and corrective waves? How can you easily spot the different waves?
Impulse Wave
Impulse Wave are made up of smaller waves that are moving in the same direction. They can be in a 1 minute charts or span in decades.In a nutshell impulse waves give a better chance of making a large profit when compared to corrective Waves reasons because trader that get into an impulse wave will likely be held longer, because this type of waves move with the market trend that are represented by waves 1 - 5 as shown from the image below.
As we can see from the image above the waves (1), (3) and (5) really affect the directional movement. Whereas waves (2) and (4) are countertrend interruptions.
Wave 1: Display the starting point of the market, which indicates that traders are buying at a lower price.
Wave 2: Is the smallest point of regression in the when traders sell and take profit.
Wave 3: Is the longest wave in the point of regression where traders start purchasing asset before the price rise up.
Wave 4: At this point trader will pause for a while and take out their profit due to fear.
Wave 5: This is the final waves, when trade become bullish in such a way that traders will begin to buy at overpriced.
Corrective waves
Corrective Waves are waves that are made up of the smaller waves due to how they occur in and out of a border trend. The corrective are usually used to get into a trend trade,as a means to trap the next bigger impulse wave. This can be seen like for instance, If a trader is hoping that the market price will rises, the trader should make it possible to time their buys as the corrective wave is ending, so that the trader will be able to get into the impulse wave since the price is higher than corrective wave. The corrective waves are group according to the chart structure they create such as;
Zigzag: in Zigzag the price goes up small, and as well sometimes it's hard to go against the trend at first. This is usually occur when B is shorter than A and C.
Flat: in a Flat a wave can be easy to spot and the waves will also have some length in it. Simple complex most complex can apply to flats sometimes.
Triangle: In Traingle the chart formation is difficult to spot. In this formation there is usually a decrease in volume and volatility.
3. What are your thought on this theory? Why?
My thought on this theory, is that the Elliott Waves theory is a good theory that all traders need to study before going deep into trading as the theory emphasize on a rational system of market analysis. And also traders should make use of the Elliott wave theory as is tells when to get out of asset that was previously purchased, so as not to lose all the profit, but instead get some profit. Looking at the Waves 3 it requires someone to wait for a very long time as it can become deception.
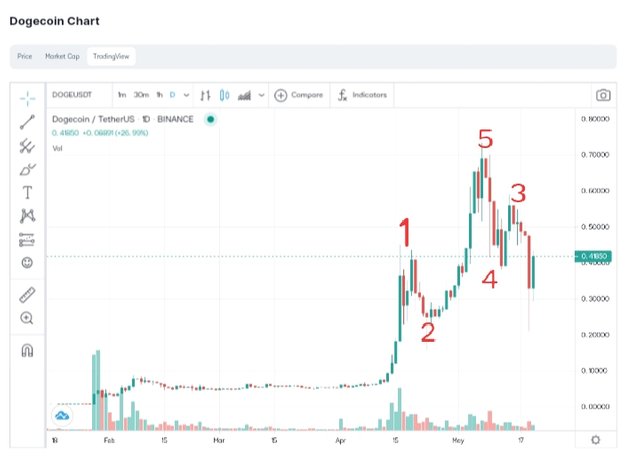
B. choose a Coinchart in which you were able to spot all impulse and correct waves and explain in detail what you see

Screenshot from Coinmarketcap
Above is a chart of Dogecoin from Coinmarketcap daily chart. The wave 5 top had a wave 3 that is higher than the wave 3 higher near 0.7000 level. The C wave wave high is an extended wave 5 pattern as shown in the image. Wave 2 of this impulse is sharp why wave 4 moves sideways, the both wave have two corrections.
.png)
.png)
Disregarded as it contains plagiarized content
https://www.thebalance.com/elliott-wave-tricks-to-improve-trading-4153295
Sorry to say this professor @fendit there aren't the same word.
Please look into my work very well it's free from plagiarism. Thank you