Support and Resistance Breakout - Steemit Crypto Academy - S6W3 - Homework post for pelon53

Hi guys
I welcome us all specially back to the lessons in the steemit crypto academy, for the past two weeks we have been putting into practice what we have learnt in the academy and to be frank with you all, I have even learnt more. Today I will be attempting the homework task given by professor @pelon53 after attending his lecture on the topic titled Support and Resistance Breakout. Let's get started.
I welcome us all specially back to the lessons in the steemit crypto academy, for the past two weeks we have been putting into practice what we have learnt in the academy and to be frank with you all, I have even learnt more. Today I will be attempting the homework task given by professor @pelon53 after attending his lecture on the topic titled Support and Resistance Breakout. Let's get started.
1.- Explain in detail the advantages of locating support and resistance on a chart before trading.
In technical analysis, the zones of support and resistance are really very important zones as it help a trader to know the strength at which the market is carrying. This are zones where there are high probability of trend reversing to the opposite direction. If the price of an asset is moving in an upward direction, the point of resistance is the point where the price tends to reverse and move downward. Similarly, if the price of an asset is moving in a downward direction, the point of support is the point where the price tends to reverse and move upward.
Aside the fact that the points of support and resistance are points of trend reversal, the points also serve as a point where traders make their entry and exit as well. A good support and resistance point is a point where traders take their profit and also stop their losses. Once a trader is able to identify this important zone very well and then uses it correctly then the tendency of making a good trade is certain.
The areas of support and resistance also gives us a clear information about the demand and supply in the market at any point in time. The support level is a level of accumulation I.e at this level the demand for the asset is usually very high and hence more traders buy the asset at this zone and that leads to the upward movement of price. On the other hand, the resistance level is the level of distribution I.e at this level the supply for the asset is usually very high and hence more traders sell their asset here and that leads to the downward movement of price.
In summary, the support level is an area or a zone where the price which has been going downward stops and then reverse to the opposite direction whereas, resistance level is an area or a zone where the price which has been going upward stops and then reverse to the opposite direction.
2.- Explain in your own words the breakout of support and resistance, show screenshots for the breakout of a resistance, use another indicator as a filter.
When we talk about the breakout of support and resistance we are referring to a scenario where the price action which has been in a range movement or has been in either upward or downward movement continues it movement without stopping at the usual support or resistance point. Let's carefully look at the resistance breakout in a more detail manner using screenshot to illustrate.
Resistance breakout can be of two ways I.e once the resistance is broken, the price may retest the broken resistance before the movement continues in an upward direction or sometimes, once the resistance is broken the price does not retest the broken resistance instead it just moves in an upward direction. Let's consider the screenshot below as it shows clearly a broken resistance that retest and the a broken resistance that does not retest.

Now, to filter the breakout of resistance zone, I will be making use of the RSI indicator on my chart. Considering the screenshot below, you will notice the RSI indicator broke the upper threshold. The upper threshold which serve as overbought region is the region of resistance and from the chart below, there is a continuous movement of the RSI indicator above the 70 threshold which signifies that the level of resistance has been broken at that point.

3.- Show and explain support breakout, use additional indicator as filter, show screenshots.
Support breakout is a type of breakout that happens at the support zone. When the price of the asset continues to move downward without stopping at the initial support level, we say that the level of that support has been broken.
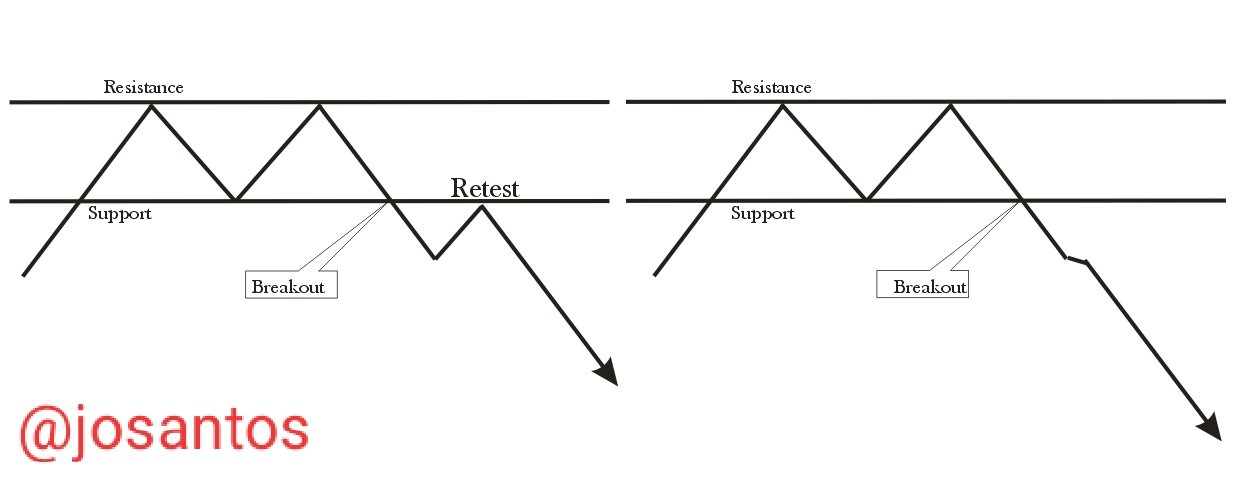
Support breakout can be of two ways I.e once the support is broken, the price may retest the broken support before the movement continues in a downward direction or sometimes, once the support is broken the price does not retest the broken support instead it just moves in a continuous downward direction. Let's consider the screenshot below as it shows clearly a broken support that retest and the a broken support that does not retest.
Now, to filter the breakout of support zone, I will be making use of the RSI indicator on my chart. Considering the screenshot below, you will notice the RSI indicator broke the lower threshold. The lower threshold which serve as oversold region is the region of support and from the chart below, there is a continuous movement of the RSI indicator below the 30 threshold which signifies that the level of support has been broken at that point.

4.- Explain what a false breakout is and how to avoid trading at that time. Show screenshots.
False breakout is a type of breakout in which when ever it occurs either in the support or resistance level, it fors not continue moving in the specified direction of the trend instead it will reverse to the opposite direction. A false breakout is normally influenced by the big players to liquidate the little traders of their asset if the enter into the trade at the time of this false breakout.

From the screenshot above, I have been able to mark points of false breakout in the support zone. As you can see, the price broke the support level and move a little downward and after a little move it reverse and went upward again. So traders who took a position at this breakout and expecting that the price will continue going down have actually loss a lot of money. To avoid this loss, traders are adviced to always wait for a clear breakout before making any entry into the trade.
To further avoid false breakout, traders are adviced to use an indicator to determine the correct direction of the trend. More also the volume of the asset should increase when ever a breakout is seen and if that is not done, then traders need to wait and careful look at the breakout after sometimes before entry the market.
5.- On a demo account, execute a trade when there is a resistance breakout, do your analysis. Screenshots are required.
From the screenshot below, a pair of BTCUSDT was traded. I used my RSI indicator and the volume to confirm the breakout. From the screenshot, the trend broke and then retest before continuous movement, at the continuous movement I entered a buy order as you can see below. All risk management strategy was taken into consideration like the stop loss and the take profit. Risk reward of 1:1 is used for this trade.

After a little time the trend continue in an upward direction as I have predicted. The RSI indicator also continued moving in an upward direction and hence a lot of profit was made at the course of the trade. See the result of the trade execution below.

6.- In a demo account, execute a trade when there is a support break, do your analysis. Screenshots are required.
From the screenshot below, a pair of DEGOBTC was traded. I used my RSI indicator and the volume to confirm the breakout. From the screenshot, the trend broke and then continue moving downward. I entered a sell position when I notice the trend moving downward a confirmation of this is seen in the RSI indicator. I took into consideration all risk management strategies by setting my stop loss and take profit.

After a little time the trend continue in a downward direction as I have predicted. The RSI indicator also continued moving in an downward direction and hence a profit is made as I have predicted. See the result of the trade execution below.

Support and Resistance zone are quite very significant zones as far as trading is concern. If any trader tends to make head way in crypto trade he/she must always follow the concept of support and resistance. When we identify this important level and watch out for breakout we can make a lot of profit. Just like the demo trade I carried out above.
I want to appreciate the professor in the person of @pelon53 for such a great lecture, it is really educative and informative. I look forward to learning more from you sir.
Sort: Trending
Loading...
[-]
successgr.with (75) 4 years ago
