Hello guys, welcome to yet another week in the steemit crypto academy. For a while now I have been attending lecture in this level but have not been able to participate due to the requirement. Am so glade that this very week I have the privilege to attend the lecture once again and also carry out my own homework task. For the past few weeks now, our dear professor in the person of
@cryptokraze has really been doing justice to the topics he lectures.
This weeks lecture gives us another insight on how to make good trading decision. So in my homework task today I will be talking about Trading the dynamic support and resistance. The tool we will be using today is called the Exponential moving average (EMA). This tool will be used to make trading decision and manage the trade as well.
For a trader to be able to make any decision in the crypto currency world, the very first things he must put into consideration is the support and resistance level of the trade. So in every crypto chart traders focuses on the support and resistance level to make a better trade decision. Decision of the market are made here because support and resistance area are those areas in the crypto world that we have both demand and supply respectively. Hence in these areas of support and resistance, it either serves as as a reversal point or a continuation of the original trend movement.
It has been noticed that once price of an asset gets to either support or resistance level, it is either rejected and then reversed or it breaks through and then continuous in that trend.
In the case of dynamic support, this is an area on the chart where the price of an asset find support and then reverse and continuous with an uptrend movement. Whereas in the case of dynamic resistance, this is an area on the chart where the price of an asset finds resistance and then reverse and then continuous with a downtrend movement. It is important to mention here that the dynamic support and resistance differs from the horizontal support and resistance on our charts this is because it is static in nature because we draw them once we notice any fluctuation in the price of an asset, whereas the dynamic support and resistance changes as the price of an asset changes.
This task re-upres that we adopt the Exponential moving average (EMA) as our dynamic support and resistance level and then apply it to see how we can make a better decision once it comes to trading and making profits.
When we talked about using the EMA as a dynamic support tool, we said that the price of an asset moves upward when it meets the EMA which represent the dynamic support level. The chart of BTC/USD below shows how the price of an asset finds support on EMA. The price of the asset is rejected as it hits the EMA line.
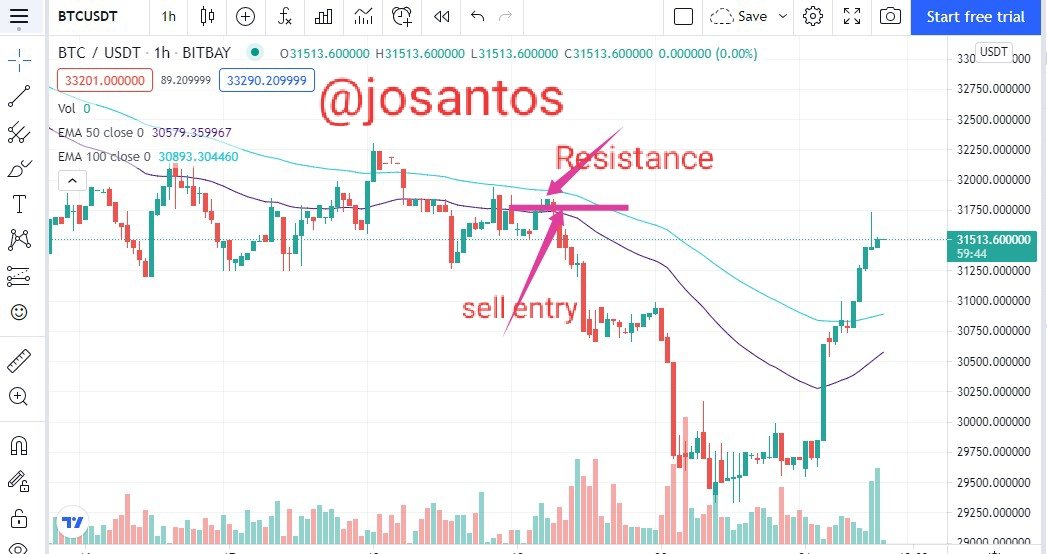
Just as we see dynamic support during an upward movement of price, so also we see resistance during a downtrend movement of price. Here the price always retrace to find resistance on EMA line so as to reverse its movement in a downward direction that is opposite direction of the support level. The chart of BTC/USD below shows how the price reverses anytime it hits the resistance EMA.
Here I will be combining 20 EMA and 50 EMA and show them as support and resistance on my trading chart. First and foremost, I added the two EMA to my Tradingview chart below.
20 and 50 EMA as a Support level
From the lecture delivered by the professor, he clearly explained that the combination of this EMA's enables us to control the price movement and retracement as well. This method also helps us to minimize losses that come as a result of market manipulation and price breakout which are really false signals.
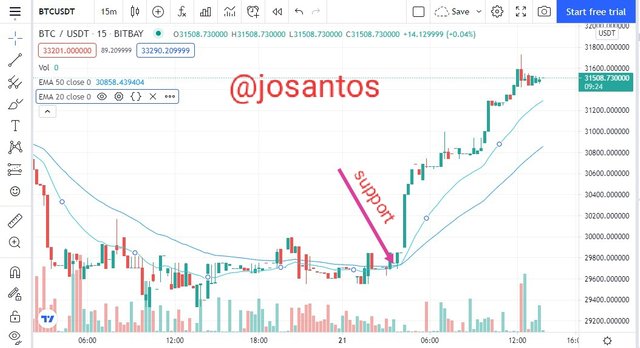
In this chart above, the price respects both the 20 and 50 EMA's and when it touches the line it bounces back. Hence it shows price rejection and a potential reversal to an uptrend.
20 and 50 EMA as Resistance level
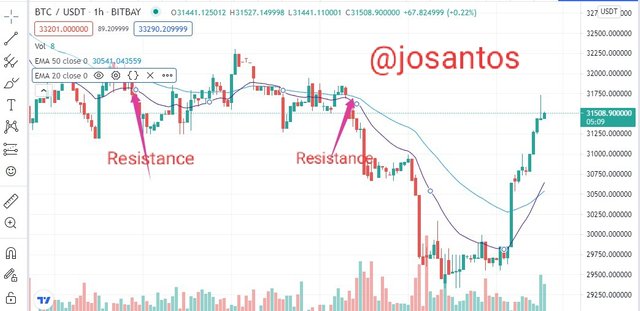
The chart below shows how price is rejected in both the 20 and 50 EMA's. Seeing that the price dosen't go above the 50 EMA indicates a very strong resistance and a price rejection and a potential reversal to a downtrend.
Trade Entry Criteria
Every trade has an entry and exit criteria, in the course of the task I will be explaining the entry criteria for both buying and selling positions. Entry position criteria in every trade is what equips the trader with some confidence to carry out a trade without any fear of risk.
Trade Entry Criteria for a Buy Position
First and foremost, you will need to add two EMA to your chart. A fast EMA and a slower EMA so that you will be able to have an optimal solution or result at the end. Here in my chart the fast EMA I will be using is the 20 EMA and the slower one is the 50 EMA. This is because from the lecture delivered by the professor this has proven to be more effective.
To be sure of a buy setup, the price must be above the exponential moving average (EMA).
The trader who is performing the analysis for the trade should allow the price to touch or cross the 20 EMA before any other action can be taken. This is because of the uncertainty in the price within that time.
Once the price moves above the 20 EMA, the trader who is analysing should still be a bit patient and wait for the price to move upward again so as to be certain of the setup.
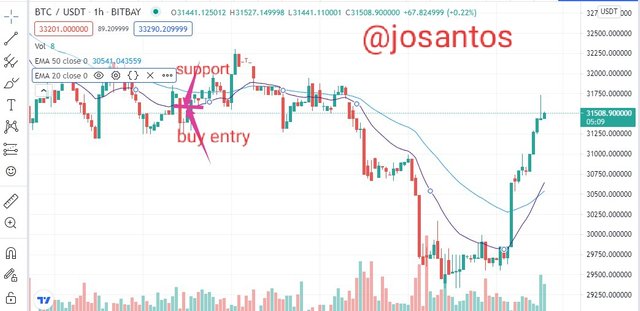
In the case of a buy order, it is expected to be placed once the price moves above the 20 EMA.
The chart below shows a buy entry criteria.
Trade Entry Criteria for a Sell Position
First and foremost, you will need to add two EMA to your chart. A fast EMA and a slower EMA so that you will be able to have an optimal solution or result at the end. Here in my vase the fast EMA I will be using is the 20 EMA and the slower one is the 50 EMA. This is because from the lecture delivered by the professor this has proven to be more effective.
To be sure of a sell setup, the price must be below the exponential moving average (EMA).
The trader who is performing the analysis for the trade should allow the price to touch or cross the 8 EMA before any other action can be taken. This is because of the uncertainty in the price within that time.
Once the price moves above the 20 EMA, the trader who is analysing should still be a bit patient and wait for the price to move downward again so as to be certain of the setup.
In the case of a sell order, it is expected to be placed once the price moves below the 20 EMA.
The chart below shows a sell entry criteria.

Trade Exit Criteria
In any form of trade, you either gain or you loss. But the lost should always be monitored so the we don't get to much wastage and that gave rise to what we call the exit criteria. Now if we are trading and the market is not to our favor it is expected that we exit the market to stop loss.
Below are the trade exit criteria for trading dynamic support and resistance that is buy and sell exit position.
Exit Criteria for a Buy Position
There should always be a stop loss mechanism put in place when it comes to trading.
Always place your stop loss below the slower EMA. In my case the slower is 100 EMA, hence my stop loss will be placed below this.
Once the price of the asset crosses the stop loss level it is expected that the trade should exit and hence the set up for that trade is not recommended. If we use it we will loss lots of funds.
Profit level should be set at the ratio of 1:1 RR ( Risk:Reward ) to be in a safer side.
Once the price of the trade hits the profit level, it is recommended that the trade be exited. And another setup be made for a new trade.
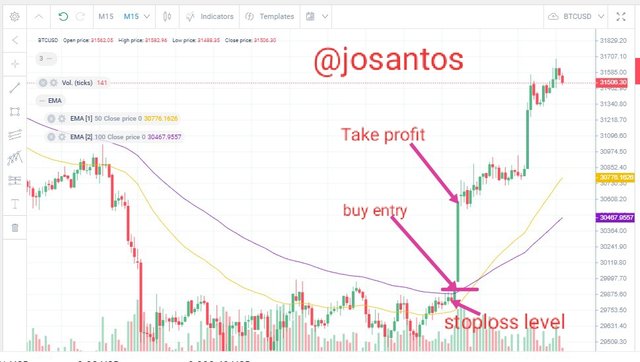
The chart below shows a buy exit criteria.
Exit Criteria for a Sell Position
There should always be a stop loss mechanism put in place when it comes to trading.
Always place your stop loss above the slower EMA. In my case the slower is 100 EMA, hence my stop loss will be placed above this.
Once the price of the asset crosses the stop loss level it is expected that the trade should exit and hence the set up for that trade is not recommended. If we use it we will loss lots of funds.
Profit level should be set at the ratio of 1:1 RR ( Risk:Reward ) to be in a safer side.
Once the price of the trade hits the profit level, it is recommended that the trade be exited. And another setup be made for a new trade.
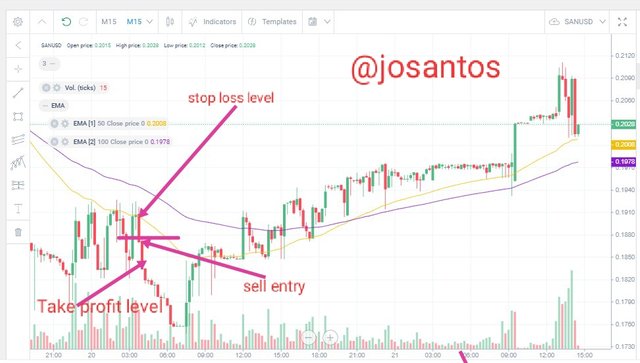
The chart below shows a sell exit criteria.
Demo Trades on Crypto Assets
Here, I will carried out a demo trade using dynamic support and resistance. The analysis and markup will be carried out on Tradingview chart whereas the execution is carried out on liteforex demo account.
SAN/USD 15 Minutes Chart
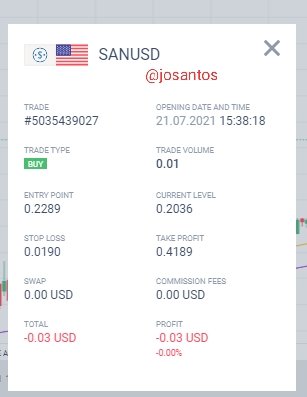
On SAN/USD Chart, I observed that price was initially in almost a balance state cause it goes up and down with out much fluctuation. When the price eventual moved upward above the 50 EMA, I opened a buy possition. The chart below shows it.
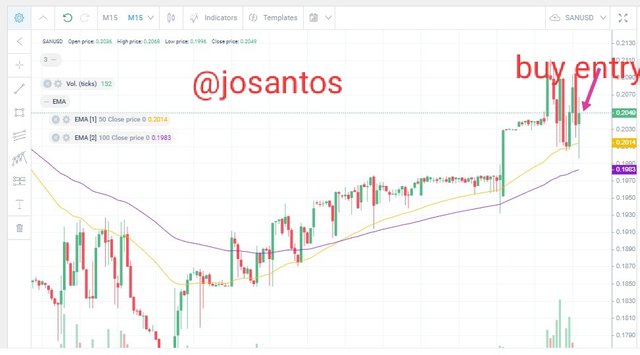
SAN/USD Chart
This trade was executed on liteforex demo account and the order is seen in the screenshot below.

BTC/USD 15 Minutes Chart
On the BTC/USD 15 minutes chart, I observed that at initial stage the price was moving in an uptrend and is above the 50 EMA but at some point it reverse and started moving downward then I placed a sell otherr in that position. The chart below shows it.
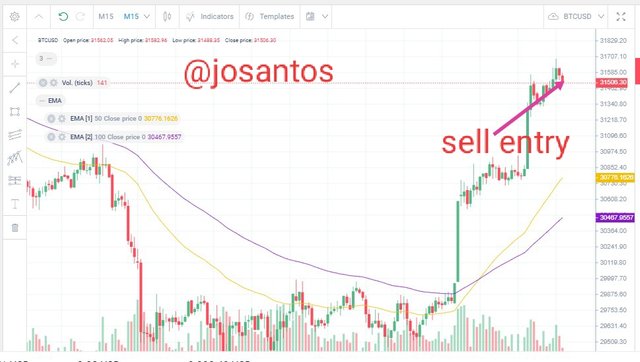
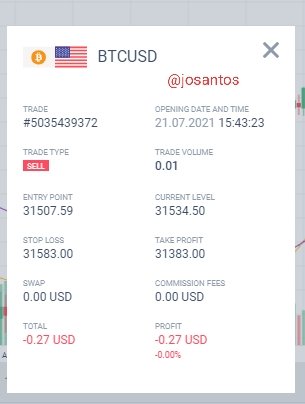
BTC/USD Chart
This trade was executed on liteforex demo account and the order is seen in the screenshot below.
Conclusion
In summary, I want to say that this strategy of dynamic support and resistance is indeed a very wonderful strategy to be used by traders to attain an optimal solution. Because of the stopless and take profit factor, it will be difficult for traders to actually lost their resources. I want to thank professor
@cryptokraze for such a wonderful delivery. I have really learnt a whole lot at the cause of making research for this very task. I look forward to do more of your assignment soon.