Steemit Crypto Academy Season 4 Beginner's Course - Task 10: Candlestick Patterns. By professor @reminiscence01 by @jollybake
Homework Tasks
1a) Explain the Japanese candlestick chart? (Original screenshot required).b) In your own words, explain why the Japanese Candlestick chart is the most used in the financial market.c) Describe a bullish and a bearish candle. Also, explain its anatomy. (Original screenshot required)
OR
2 a) In your own words, explain the candlestick patterns and their importance in carrying out effective technical analysis.b) In your own words, explain the psychology behind the formation of the following candlestick patterns.Bullish engulfing Candlestick pattern- Doji Candlestick pattern. The Hammer candlestick pattern.The morning and evening Star candlestick pattern.The Harami Candlestick pattern.
OR
3 a) Identify these candlestick patterns listed in question 2b on any cryptocurrency pair chart and explain how price reacted after the formation. (Original Screenshot of your chart required for this exercise).b) Explain the measures taking by the trader before trading candlestick patterns.c) Using a demo account, open a position (buy or sell) on two crypto assets using any candlestick pattern and explain your reason for taking the trade. You can perform this operation using lower timeframes. (Show screenshots of your position and also your chart.

Hello steemit crypto community, a very bright and fruitful day to you.
I'm beyond excited to participate in this fixed class.
I want to appreciate our very own professor @reminiscence01 for the time and effort he put to ensure we have proper understanding of the topic.

Explain the Japanese candlestick chart? (Original screenshot required)
Japanese Candlestick is a structural representation of the market price (rise in price or fall of price) using a Candlestick instead of using bar chart or line charts.
As the name implies Japanese Candlestick is originated in Japan far back in 1700s by a rice trader called Munehisa Homma.
Base on my understanding, Munehisa Homma must have tried to calculate and understand the reason why demand is less at a particular time and supply is more or why supply is more with less demand or why the amount of price determines the supply or demand of his asset (rice)and then he coined Japanese Candlestick chart for easy interpretation and understanding of price movement which in turn leads to more demand or more supply and vise versa of his asset (rice)
Each candle in the Japanese Candlestick give detail information about the price of the asset in the market at a particular point in time say 24hours,1 week, 1 month etc that is, it helps the traders understand potential market point showing when to buy and when to wait like for example, if a dogi Candlestick pattern appears in the chart a trader knows that the market price at this time is indecisive, so he or she has to wait for the next candlestick chart to appear before making purchase or selling in the market.Japanese Candlestick helps the traders understand the future movement of price.
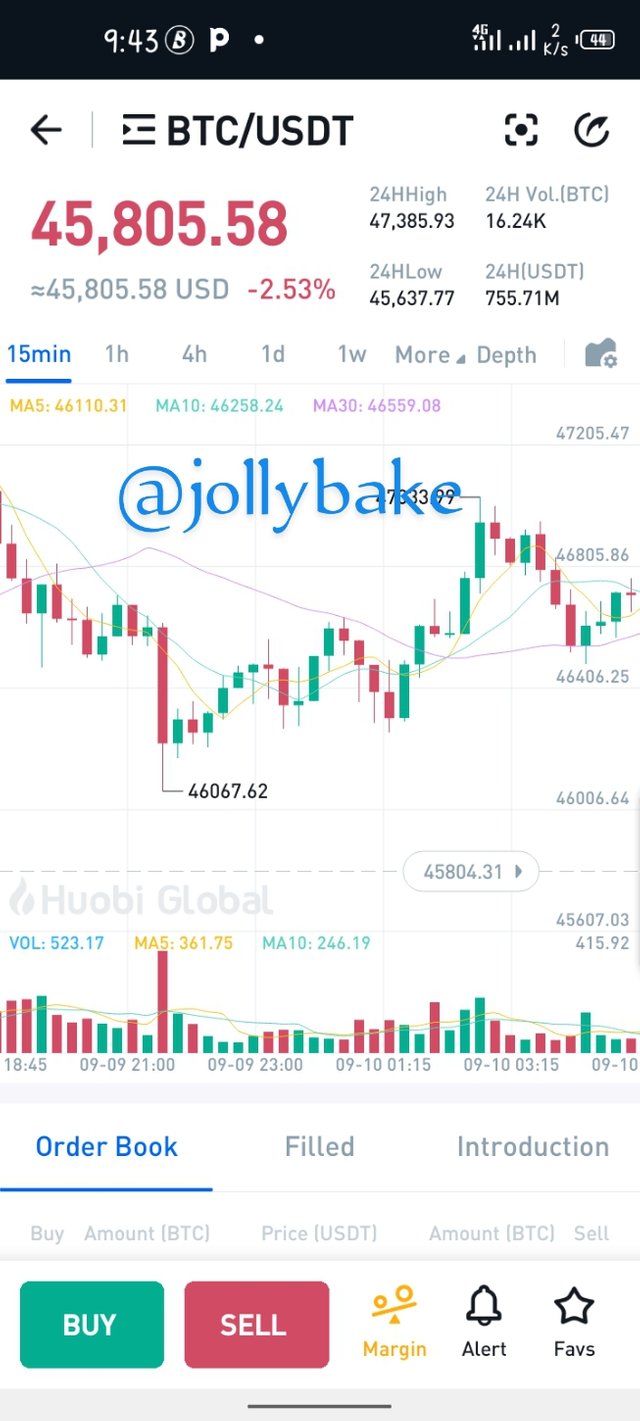
[source](screenshot from huobi global)
In Japanese Candlestick pattern, the movement of price in the candle is diffrentiated with colour, the bullish Candlestick which is green and the bearish Candlestick which is red.
The Japanese Candlestick pattern shows the relationship between the buyers and sellers in crypto currency market, the influence the buyer has in the market is also showcased with the Japanese Candlestick.
In your own words, explain why the Japanese Candlestick chart is the most used in the financial market.
In a market environment,every trader wants to engage in something they know is feasible and without stress, since the Japanese Candlestick is easy to interpret and understand even without professionalism,any trader who profit is his or her concern will go for Japanese Candlestick pattern.
Price direction and movement is conveyed simply by bullish and bearish Japanese Candlestick so the reason for it being mostly used.
Describe a bullish and a bearish candle. Also, explain its anatomy. (Original screenshot required)
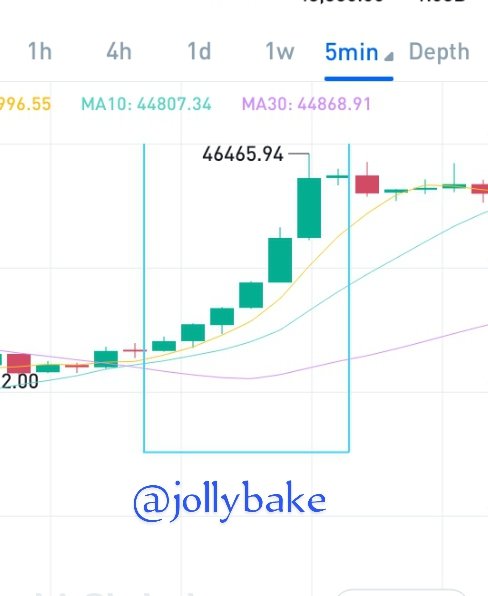
[source](screenshot from huobi global)
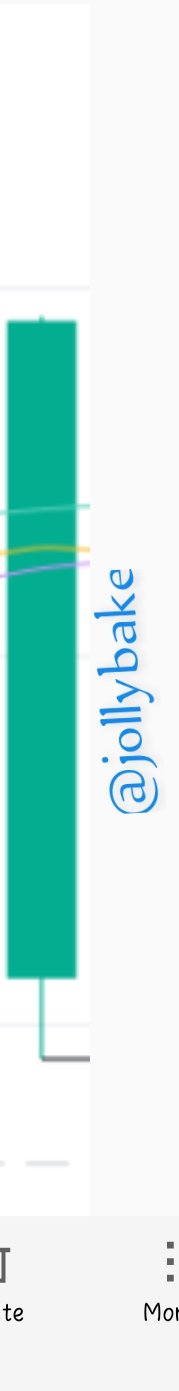
Bullish candlestick is usually green or white and it means that there is going to be an increase in price,here bullish traders buy because they believe base on their understanding of the market chart that there is going to be an increase in price.
when the open is greater than the close, it means that there is an increase in price which means that it is a bullish Candlestick
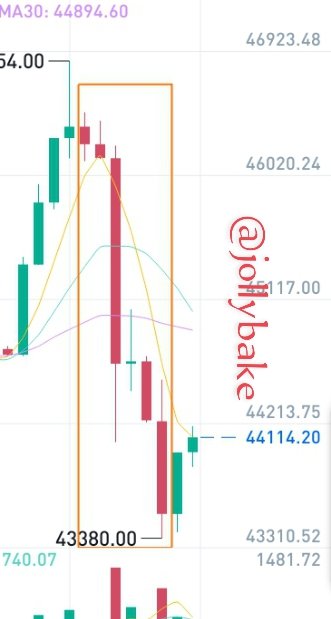
[source](screenshot from huobi global)
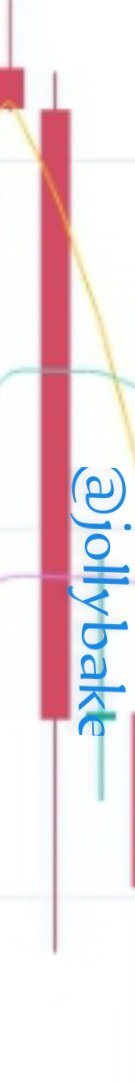
Bearish candlestick pattern shows a decrease in price and here a bearish traders buy asset to sell them when there is an increase in the market.
when the open is less than the close it means that there is a decrease in price which means it's a a bearish candlestick pattern.
[source](screenshot from huobi global)
[source](screenshot from huobi global)
A bullish candlestick and a bearish candlestick pattern comprises of parts which includes; the body and the shadow or wick.
The body of the candlestick can be green for a bullish candlestick and red for a bearish candlestick. The body shows when price opens and when it closes for example in a bullish candlestick pattern the open price is below the close price as compared to the bearish candlestick pattern which the open price is above the close price.
The shadow or wick shows the highest price of the asset or the lowest price of the asset in the market at a particular point in time.
Conclusion
Japanese Candlestick pattern is easy to interpret and understand.
Thanks for reading 💕💕