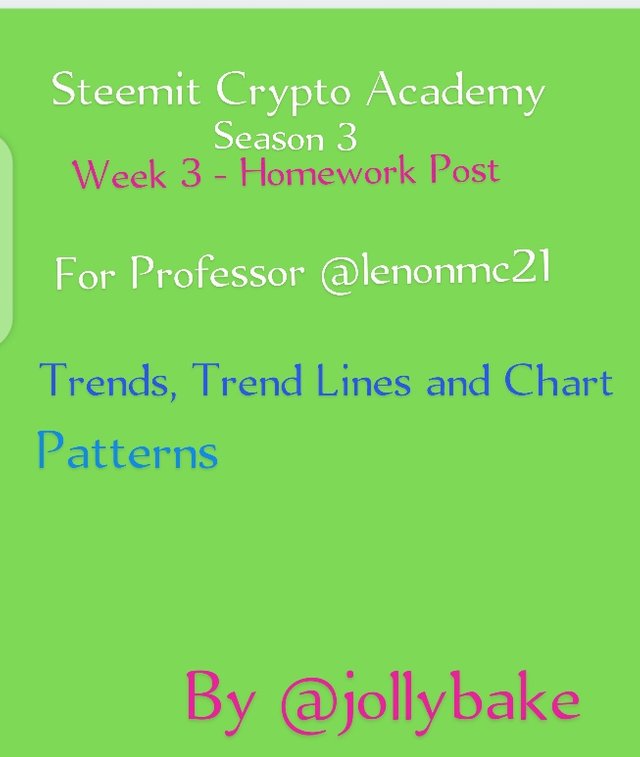
Crypto Academy / Season 3 / Week 3 - Homework Post for Professor @lenonmc21 | Trends, Trend Lines and Chart Patterns | by @jollybake

in SteemitCryptoAcademy3 years ago
Hello, steemians how are you doing and how is today? I'm excited to be part of this class and I want to say a big thank you to @lenonmc21 for the supperb lecture given.

Screenshot_20210717-094004_2.png

45GhBmKYa8LQ7FKvbgfn8zqd6W2YEX34pMmaoxBszxVcFZxVom1ueqEqJNng7wby7Ah9gZF4maTBUPujZMDF8pACCbc5cqNmHJQgougiYhK2SLRK5hJWjQVLvBWvRg...sv6hQf5RabPkgHeRHD6BNkWaY42m55ywdkEiVhTJhHKtFUmwyW1G57Bowkzqt1jzg2UfZBoyGbu9Uf8F1TsvWXbkGrLBsu8SshXXDp5tbmaPHQBM3SDQ7E2Aar.png

Introduction

B1uMkP6d9YBFJqD9fH9yvXtvuVwVQPWrqRwT23Ybk4MPrYzggGcjtSBqVjQAHgvPg1mXjvXtV6KW4Bh7RYV21QC2uXrE33uZQQdPJDXGDYEJGUJXERNAF5DCJBTrM6...qfpRV8gmbocAYYCLBEfEMNtKRYHJ9XbrhCboNzrGYr9EENu7R84SyMm8QJqVtrkioY23CYFd47YygxPvX8EDFyvo9LbXFXmQUgXFYbSwc7ycyxYhRjYgaCCJS.jpeg

For a trader to make a turning point in cryptocurrency trading ie always gaining or profiting, he or she must have a certain degree of knowledge on charts
These charts patterns houses trends that shows a trader when to buy and when not to, in order to make profit in Cryptocurrency market trading.

A chart is a representation of price over time, it can be candlestick, bar chart or line chart.

Within these chart, a successive movement occurs which can be bullish or bearish and this movement over time is termed trend.

45GhBmKYa8LQ7FKvbgfn8zqd6W2YEX34pMmaoxBszxVcFZxVom1ueqEqJNng7wby7Ah9gZF4maTBUPujZMDF8pACCbc5cqNmHJQgougiYhK2SLRK5hJWjQVLvBWvRg...sv6hQf5RabPkgHeRHD6BNkWaY42m55ywdkEiVhTJhHKtFUmwyW1G57Bowkzqt1jzg2UfZBoyGbu9Uf8F1TsvWXbkGrLBsu8SshXXDp5tbmaPHQBM3SDQ7E2Aar.png

Define in your own words what is a "Trend" and trend lines and what is their role in charts?

B1uMkP6d9YBFJqD9fH9yvXtvuVwVQPWrqRwT23Ybk4MPrYzggGcjtSBqVjQAHgvPg1mXjvXtV6KW4Bh7RYV21QC2uXrE33uZQQdPJDXGDYEJGUJXERNAF5DCJBTrM6...qfpRV8gmbocAYYCLBEfEMNtKRYHJ9XbrhCboNzrGYr9EENu7R84SyMm8QJqVtrkioY23CYFd47YygxPvX8EDFyvo9LbXFXmQUgXFYbSwc7ycyxYhRjYgaCCJS.jpeg

The steady movement of price in a particular direction over time say 1 hour, 1 week, 1 month is called TREND

These movements can be a long term movement, short-term movement, upward movement, downward movement or even side ways.

All these movements in price is better understood for effective trading and profit making.

7YHZyBadGPMGPpmSAvnvPWhbR1Eo9nKWN6xzUJNzgxziWYbA6pEQcn6ZKcDXwY27JzkykasSmDqsZaJk9zSWq6uvfhJGKikn15g24YrjpCCTv1vhWFcuKcv2odhFcS...yQtFXtadHnJ38CfoLq6PHZDrP7Uw16zaznquDF3zwf4nZWCfvLnH2oGWvxQTGojLt6SRWYDSZrB7VWnYhG3z1DCxf4S4BcEvtkQspPLXcSep5iN46TJdrvMcuc.png

Trend lines

7YHZyBadGPMGPpmSAvnvPWhbR1Eo9nKWN6xzUJNzgxziWYbA6pEQcn6ZKcDXwY27JzkykasSmDqsZaJk9zSWq6uvfhJGKikn15g24YrjpCCTv1vhWFcuKcv2odhFcS...yQtFXtadHnJ38CfoLq6PHZDrP7Uw16zaznquDF3zwf4nZWCfvLnH2oGWvxQTGojLt6SRWYDSZrB7VWnYhG3z1DCxf4S4BcEvtkQspPLXcSep5iN46TJdrvMcuc.png

Trend line is a line drawn on the price movement either upward or downwards connecting the significant lows and highs in the price movement.

7YHZyBadGPMGPpmSAvnvPWhbR1Eo9nKWN6xzUJNzgxziWYbA6pEQcn6ZKcDXwY27JzkykasSmDqsZaJk9zSWq6uvfhJGKikn15g24YrjpCCTv1vhWFcuKcv2odhFcS...yQtFXtadHnJ38CfoLq6PHZDrP7Uw16zaznquDF3zwf4nZWCfvLnH2oGWvxQTGojLt6SRWYDSZrB7VWnYhG3z1DCxf4S4BcEvtkQspPLXcSep5iN46TJdrvMcuc.png

what is their role in charts?

7YHZyBadGPMGPpmSAvnvPWhbR1Eo9nKWN6xzUJNzgxziWYbA6pEQcn6ZKcDXwY27JzkykasSmDqsZaJk9zSWq6uvfhJGKikn15g24YrjpCCTv1vhWFcuKcv2odhFcS...yQtFXtadHnJ38CfoLq6PHZDrP7Uw16zaznquDF3zwf4nZWCfvLnH2oGWvxQTGojLt6SRWYDSZrB7VWnYhG3z1DCxf4S4BcEvtkQspPLXcSep5iN46TJdrvMcuc.png

Trend line helps the trader to understand and determine the current direction of price and it often determines the specific direction on which the direction will change say from bullish to bearish or from bearish to bullish.

45GhBmKYa8LQ7FKvbgfn8zqd6W2YEX34pMmaoxBszxVcFZxVom1ueqEqJNng7wby7Ah9gZF4maTBUPujZMDF8pACCbc5cqNmHJQgougiYhK2SLRK5hJWjQVLvBWvRg...sv6hQf5RabPkgHeRHD6BNkWaY42m55ywdkEiVhTJhHKtFUmwyW1G57Bowkzqt1jzg2UfZBoyGbu9Uf8F1TsvWXbkGrLBsu8SshXXDp5tbmaPHQBM3SDQ7E2Aar.png

Explain how to draw an uptrend line and a downtrend line (Show a screenshot of each)

B1uMkP6d9YBFJqD9fH9yvXtvuVwVQPWrqRwT23Ybk4MPrYzggGcjtSBqVjQAHgvPg1mXjvXtV6KW4Bh7RYV21QC2uXrE33uZQQdPJDXGDYEJGUJXERNAF5DCJBTrM6...qfpRV8gmbocAYYCLBEfEMNtKRYHJ9XbrhCboNzrGYr9EENu7R84SyMm8QJqVtrkioY23CYFd47YygxPvX8EDFyvo9LbXFXmQUgXFYbSwc7ycyxYhRjYgaCCJS.jpeg

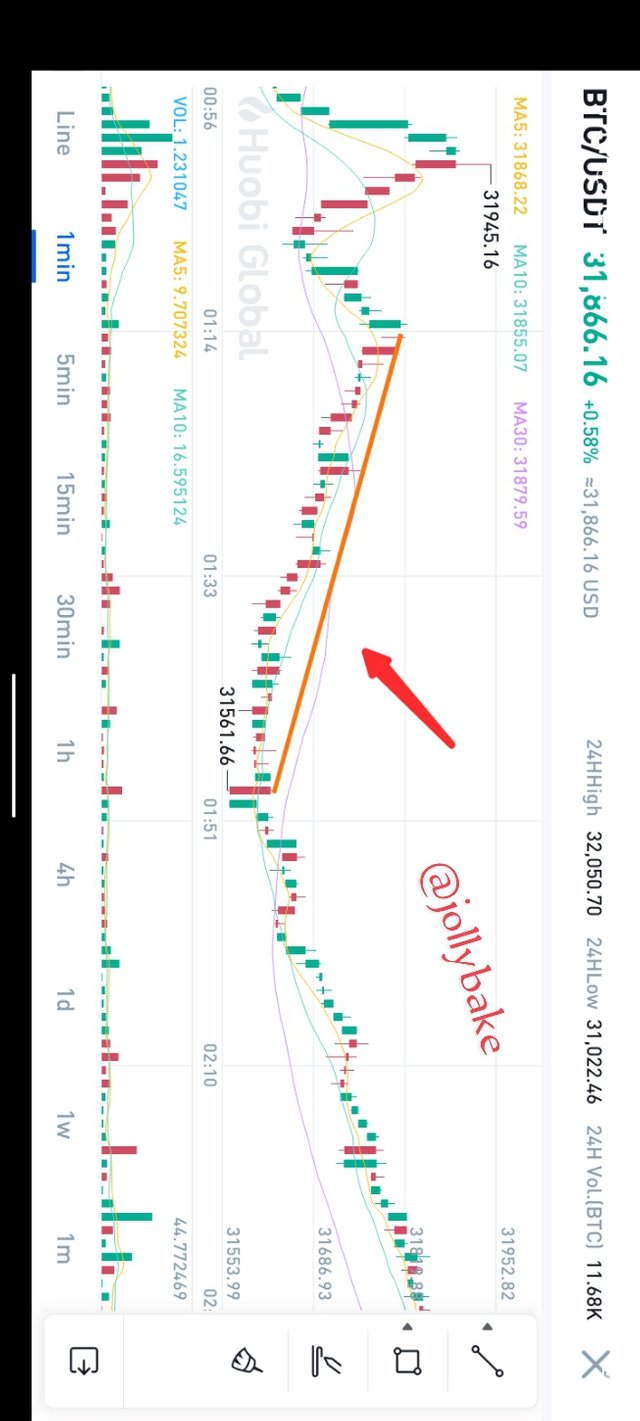
An uptrend is formed when the price in the market is moving in the higher high and higher low direction.

Screenshot_20210716-161036_1.png

Therefore, in drawing an uptrend the lows are considered I.e we connect the major troughs in an upward movement of price showing a bullish movement of price.

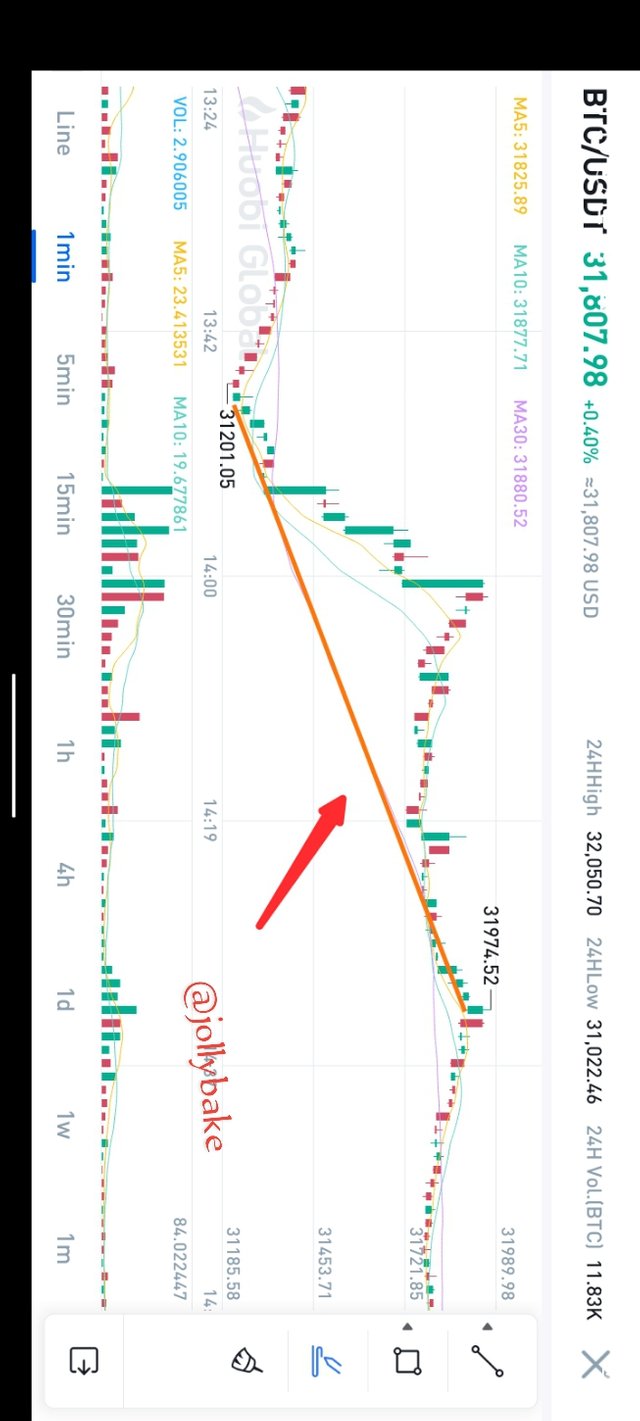
A downtrend is formed when the market price makes a successive lower high and lower low.

Screenshot_20210716-161445_1.png

So, we draw a downtrend by connecting the peaks of the price movement in a downward movement of price which shows a bearish movement of price

45GhBmKYa8LQ7FKvbgfn8zqd6W2YEX34pMmaoxBszxVcFZxVom1ueqEqJNng7wby7Ah9gZF4maTBUPujZMDF8pACCbc5cqNmHJQgougiYhK2SLRK5hJWjQVLvBWvRg...sv6hQf5RabPkgHeRHD6BNkWaY42m55ywdkEiVhTJhHKtFUmwyW1G57Bowkzqt1jzg2UfZBoyGbu9Uf8F1TsvWXbkGrLBsu8SshXXDp5tbmaPHQBM3SDQ7E2Aar.png

Define in your own words what "Supports and Resistances are and how we can identify both zones (Show a screenshot of each one).
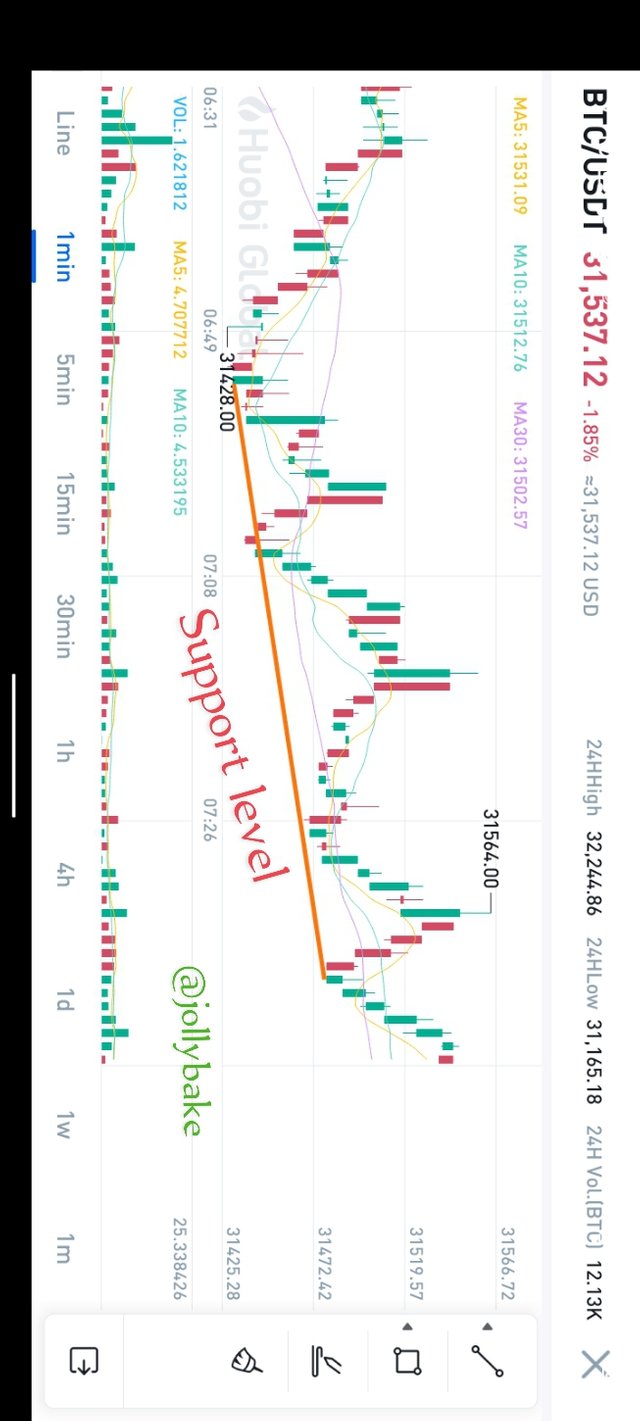
B1uMkP6d9YBFJqD9fH9yvXtvuVwVQPWrqRwT23Ybk4MPrYzggGcjtSBqVjQAHgvPg1mXjvXtV6KW4Bh7RYV21QC2uXrE33uZQQdPJDXGDYEJGUJXERNAF5DCJBTrM6...qfpRV8gmbocAYYCLBEfEMNtKRYHJ9XbrhCboNzrGYr9EENu7R84SyMm8QJqVtrkioY23CYFd47YygxPvX8EDFyvo9LbXFXmQUgXFYbSwc7ycyxYhRjYgaCCJS.jpeg

7YHZyBadGPMGPpmSAvnvPWhbR1Eo9nKWN6xzUJNzgxziWYbA6pEQcn6ZKcDXwY27JzkykasSmDqsZaJk9zSWq6uvfhJGKikn15g24YrjpCCTv1vhWFcuKcv2odhFcS...yQtFXtadHnJ38CfoLq6PHZDrP7Uw16zaznquDF3zwf4nZWCfvLnH2oGWvxQTGojLt6SRWYDSZrB7VWnYhG3z1DCxf4S4BcEvtkQspPLXcSep5iN46TJdrvMcuc.png

Support

7YHZyBadGPMGPpmSAvnvPWhbR1Eo9nKWN6xzUJNzgxziWYbA6pEQcn6ZKcDXwY27JzkykasSmDqsZaJk9zSWq6uvfhJGKikn15g24YrjpCCTv1vhWFcuKcv2odhFcS...yQtFXtadHnJ38CfoLq6PHZDrP7Uw16zaznquDF3zwf4nZWCfvLnH2oGWvxQTGojLt6SRWYDSZrB7VWnYhG3z1DCxf4S4BcEvtkQspPLXcSep5iN46TJdrvMcuc.png

Support is a price movement level where a large number of buyers enters the market to stop the downtrending of price in the market thereby overpowering the number of sellers in the market.

Screenshot_20210717-074341_1.png

For instance, in Nigeria right now there is a short supply of vegetables like onions, tomatoes, pepper, cabbage, carrots etc. Which make the prices of these goods to increase drastically. But supposedly there is a new supply of these vegetables in large quantities suppressing the initial supply then there will be a turnaround in price especially if the buyers remain constant.

7YHZyBadGPMGPpmSAvnvPWhbR1Eo9nKWN6xzUJNzgxziWYbA6pEQcn6ZKcDXwY27JzkykasSmDqsZaJk9zSWq6uvfhJGKikn15g24YrjpCCTv1vhWFcuKcv2odhFcS...yQtFXtadHnJ38CfoLq6PHZDrP7Uw16zaznquDF3zwf4nZWCfvLnH2oGWvxQTGojLt6SRWYDSZrB7VWnYhG3z1DCxf4S4BcEvtkQspPLXcSep5iN46TJdrvMcuc.png

Resistance

7YHZyBadGPMGPpmSAvnvPWhbR1Eo9nKWN6xzUJNzgxziWYbA6pEQcn6ZKcDXwY27JzkykasSmDqsZaJk9zSWq6uvfhJGKikn15g24YrjpCCTv1vhWFcuKcv2odhFcS...yQtFXtadHnJ38CfoLq6PHZDrP7Uw16zaznquDF3zwf4nZWCfvLnH2oGWvxQTGojLt6SRWYDSZrB7VWnYhG3z1DCxf4S4BcEvtkQspPLXcSep5iN46TJdrvMcuc.png

If the number of buyers overpowers the number of supply of vegetables in Nigeria it shows a resistance level.

Screenshot_20210717-075017_1.png

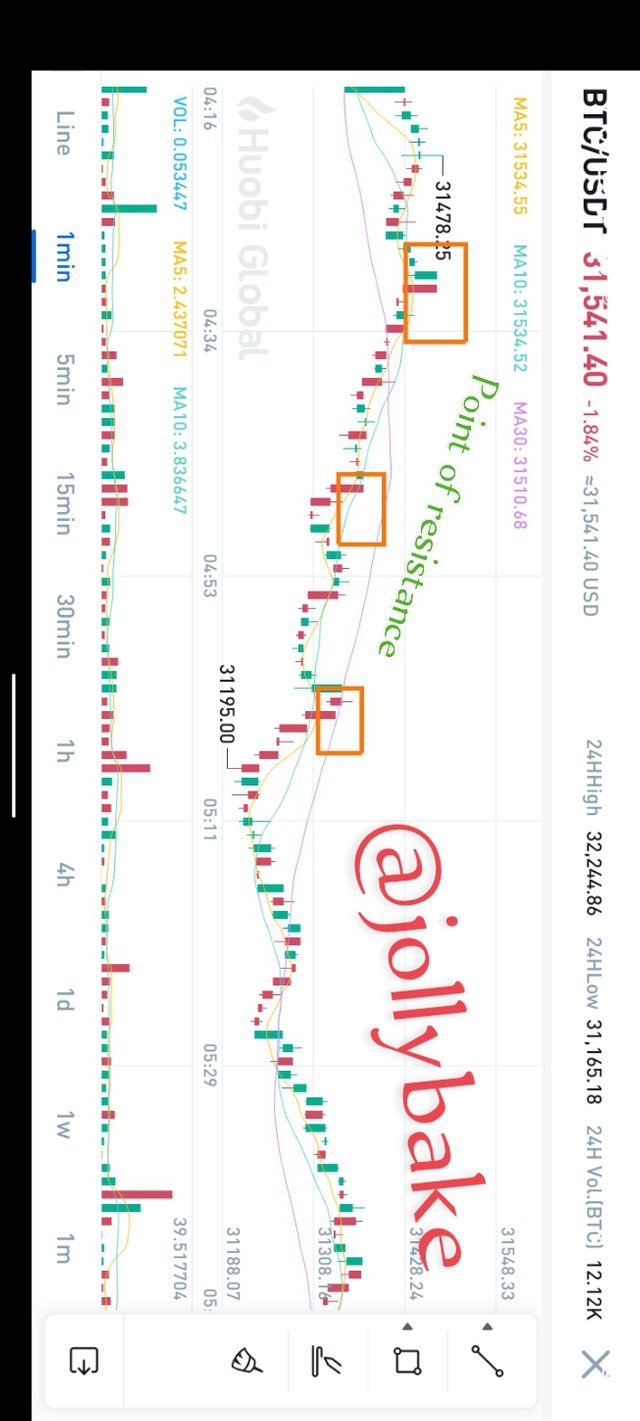
It follows that resistance level is a point in price market where a relatively increase in price meets a turnaround point due an emergence of growing number of sellers who which to sell at a price different and lower than the current price of the market.

Resistance levels can be short-lived if new information comes to light that changes the overall market’s attitude toward the asset, or they can be long-lasting.

45GhBmKYa8LQ7FKvbgfn8zqd6W2YEX34pMmaoxBszxVcFZxVom1ueqEqJNng7wby7Ah9gZF4maTBUPujZMDF8pACCbc5cqNmHJQgougiYhK2SLRK5hJWjQVLvBWvRg...sv6hQf5RabPkgHeRHD6BNkWaY42m55ywdkEiVhTJhHKtFUmwyW1G57Bowkzqt1jzg2UfZBoyGbu9Uf8F1TsvWXbkGrLBsu8SshXXDp5tbmaPHQBM3SDQ7E2Aar.png

Explain in your own words at least 2 simple chart patterns with screenshots

B1uMkP6d9YBFJqD9fH9yvXtvuVwVQPWrqRwT23Ybk4MPrYzggGcjtSBqVjQAHgvPg1mXjvXtV6KW4Bh7RYV21QC2uXrE33uZQQdPJDXGDYEJGUJXERNAF5DCJBTrM6...qfpRV8gmbocAYYCLBEfEMNtKRYHJ9XbrhCboNzrGYr9EENu7R84SyMm8QJqVtrkioY23CYFd47YygxPvX8EDFyvo9LbXFXmQUgXFYbSwc7ycyxYhRjYgaCCJS.jpeg

7YHZyBadGPMGPpmSAvnvPWhbR1Eo9nKWN6xzUJNzgxziWYbA6pEQcn6ZKcDXwY27JzkykasSmDqsZaJk9zSWq6uvfhJGKikn15g24YrjpCCTv1vhWFcuKcv2odhFcS...yQtFXtadHnJ38CfoLq6PHZDrP7Uw16zaznquDF3zwf4nZWCfvLnH2oGWvxQTGojLt6SRWYDSZrB7VWnYhG3z1DCxf4S4BcEvtkQspPLXcSep5iN46TJdrvMcuc.png

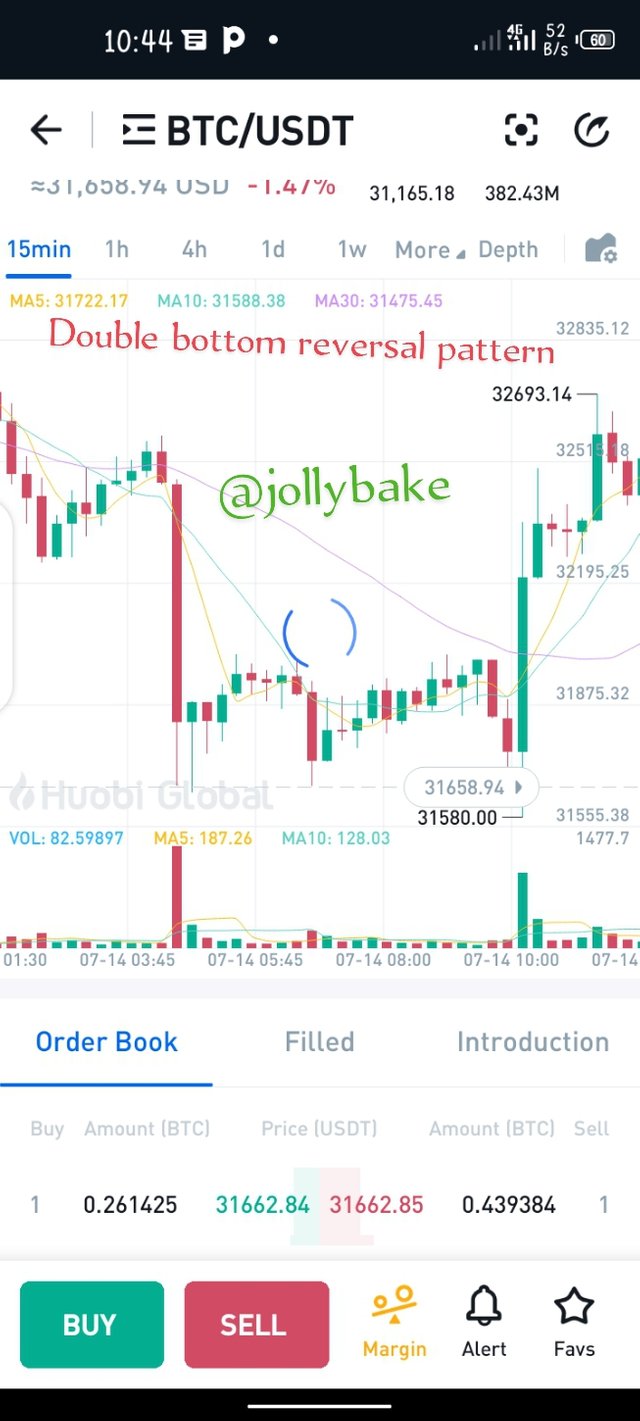
Reversal chart patterns

7YHZyBadGPMGPpmSAvnvPWhbR1Eo9nKWN6xzUJNzgxziWYbA6pEQcn6ZKcDXwY27JzkykasSmDqsZaJk9zSWq6uvfhJGKikn15g24YrjpCCTv1vhWFcuKcv2odhFcS...yQtFXtadHnJ38CfoLq6PHZDrP7Uw16zaznquDF3zwf4nZWCfvLnH2oGWvxQTGojLt6SRWYDSZrB7VWnYhG3z1DCxf4S4BcEvtkQspPLXcSep5iN46TJdrvMcuc.png

A reversal in price pattern occurs when there is a change in the trend movement to a new price direction.

Screenshot_20210717-104448_1.png

7YHZyBadGPMGPpmSAvnvPWhbR1Eo9nKWN6xzUJNzgxziWYbA6pEQcn6ZKcDXwY27JzkykasSmDqsZaJk9zSWq6uvfhJGKikn15g24YrjpCCTv1vhWFcuKcv2odhFcS...yQtFXtadHnJ38CfoLq6PHZDrP7Uw16zaznquDF3zwf4nZWCfvLnH2oGWvxQTGojLt6SRWYDSZrB7VWnYhG3z1DCxf4S4BcEvtkQspPLXcSep5iN46TJdrvMcuc.png

Continuation Patterns

7YHZyBadGPMGPpmSAvnvPWhbR1Eo9nKWN6xzUJNzgxziWYbA6pEQcn6ZKcDXwY27JzkykasSmDqsZaJk9zSWq6uvfhJGKikn15g24YrjpCCTv1vhWFcuKcv2odhFcS...yQtFXtadHnJ38CfoLq6PHZDrP7Uw16zaznquDF3zwf4nZWCfvLnH2oGWvxQTGojLt6SRWYDSZrB7VWnYhG3z1DCxf4S4BcEvtkQspPLXcSep5iN46TJdrvMcuc.png

Continuation patterns can be a bullish or bearish pattern, it occurs mid price chart and it continues to move in the same direction until the pattern is complete.

Screenshot_20210717-091015_1.png

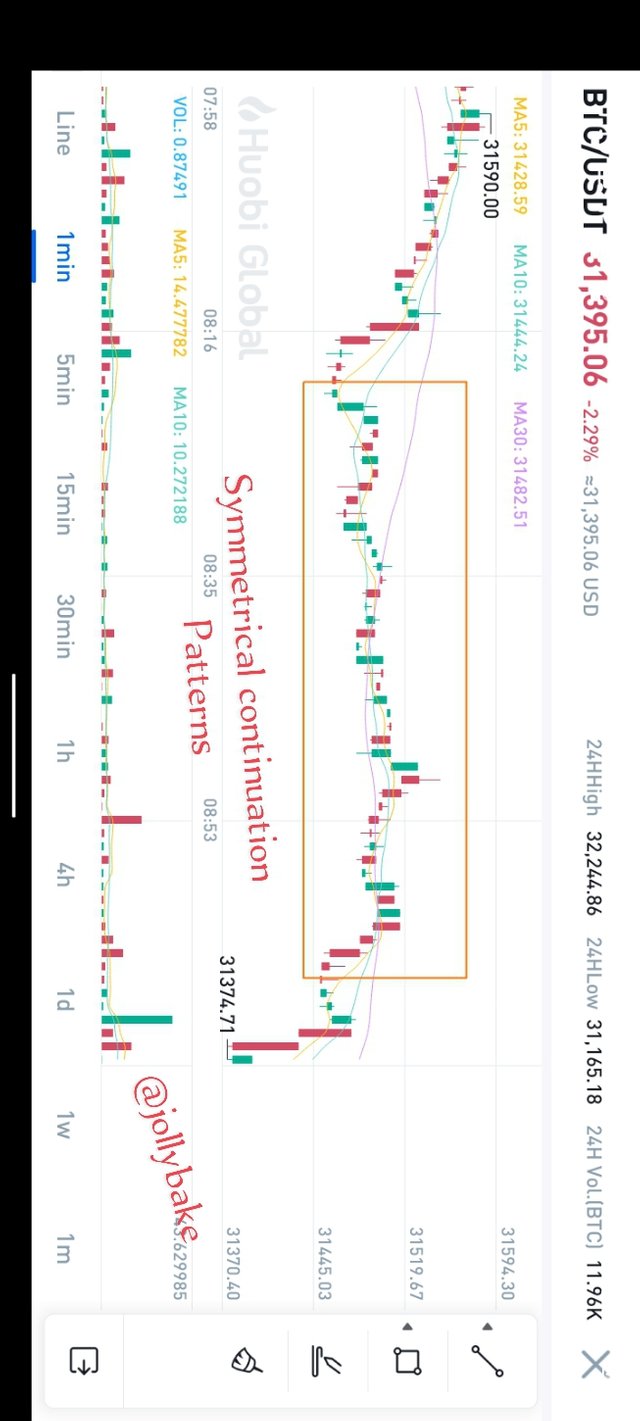
When a continuation pattern is formed after an uptrend, it means that the next continuation trend will be a downward trend.

45GhBmKYa8LQ7FKvbgfn8zqd6W2YEX34pMmaoxBszxVcFZxVom1ueqEqJNng7wby7Ah9gZF4maTBUPujZMDF8pACCbc5cqNmHJQgougiYhK2SLRK5hJWjQVLvBWvRg...sv6hQf5RabPkgHeRHD6BNkWaY42m55ywdkEiVhTJhHKtFUmwyW1G57Bowkzqt1jzg2UfZBoyGbu9Uf8F1TsvWXbkGrLBsu8SshXXDp5tbmaPHQBM3SDQ7E2Aar.png

Conclusion

B1uMkP6d9YBFJqD9fH9yvXtvuVwVQPWrqRwT23Ybk4MPrYzggGcjtSBqVjQAHgvPg1mXjvXtV6KW4Bh7RYV21QC2uXrE33uZQQdPJDXGDYEJGUJXERNAF5DCJBTrM6...qfpRV8gmbocAYYCLBEfEMNtKRYHJ9XbrhCboNzrGYr9EENu7R84SyMm8QJqVtrkioY23CYFd47YygxPvX8EDFyvo9LbXFXmQUgXFYbSwc7ycyxYhRjYgaCCJS.jpeg

As much as it is important for a Crypto currency trader to make profit in trading so it is important for a Crypto currency trader to understand the importance of trend line in chart because that is where his or her success in trading lies.

Sort:  
Loading...

Coin Marketplace

STEEM 0.36
TRX 0.12
JST 0.040
BTC 70446.49
ETH 3571.68
USDT 1.00
SBD 4.73