Crypto Academy / Season 3 / Week 4- Homework Post on candlestick pattern for Professor @reminiscence01 by @joelmaxwell
INTRODUCTION
Hello steemian,I am very happy to be part of this great community and be involved in the lecture on candlestick patterns as a beginner I have really learn alot about different pattern and how it can be identified.I also found interest in the bullish engulfing candlestick pattern which is every traders choice.
Thank you prof @reminiscence01 for the wonderful and interesting lecture.

QUESTION 1
In your own words, explain the psychology behind the formation of the following candlestick patterns
• Bullish engulfing Candlestick pattern
• Doji Candlestick pattern
• The Hammer candlestick pattern
• The morning and evening Star candlestick pattern
ANSWER
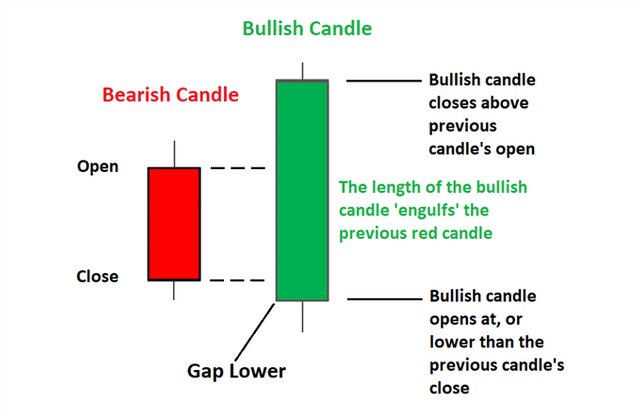
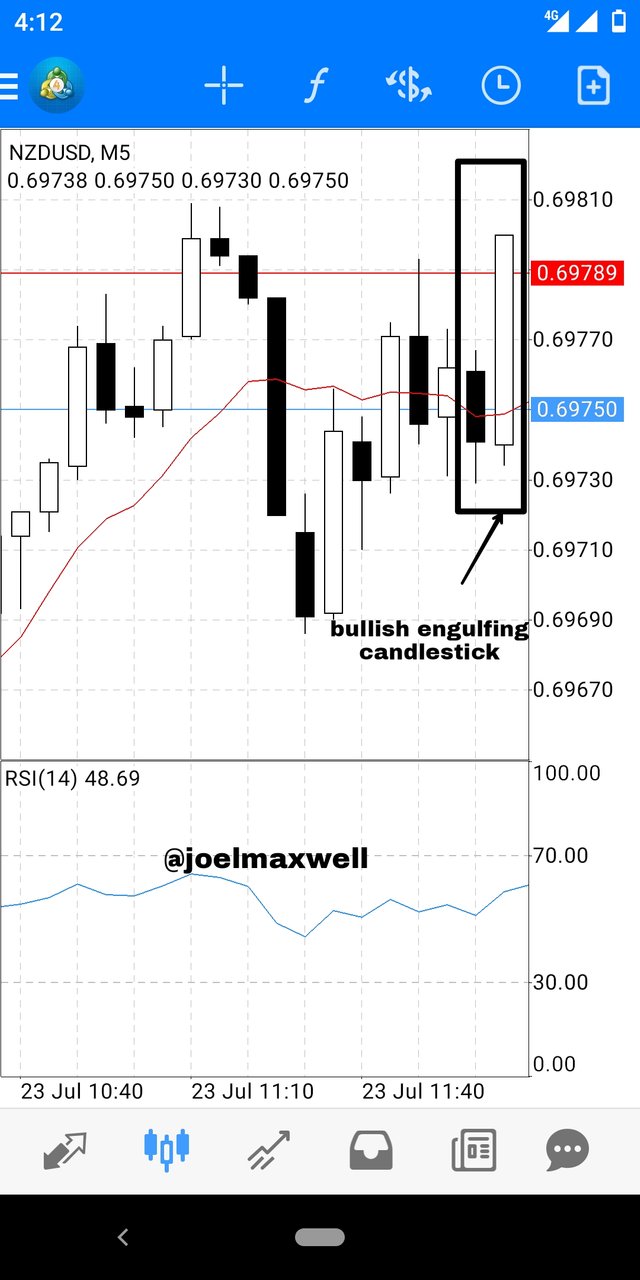
Bullish engulfing candlestick pattern
This type of candlestick occur when the market is being taken over by the seller and by this the prices of assets have fall.it is a reversible pattern that is form when the second candle(bullish) completely engulf the first pattern(bearish) despite the length and body(shadow).
when the bullish pattern is form this is a good time for traders to start buying assets.
It is also a long downtrend form at the support zone when there is a fall in asset price before the bullish candle start engulfing the previous bearish candle.
The bullish candle is one of the best candle the traders alway look out for.
If the bullish candle does not engulfed the bearish then it is not bullish engulfing candlestick.
It is one of the best point to enter the market
Source
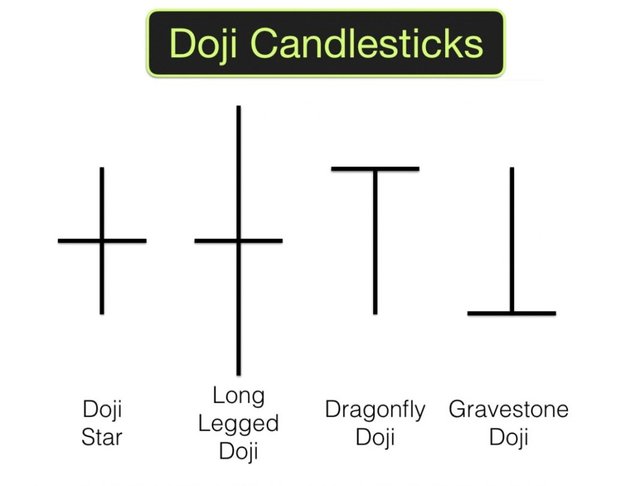
Doji candlestick pattern
This occur when the buyer and the seller are of the same level.
Here the market closes and open with the same price ,by this it mean the buyer will be struggling to make the price favor them by trying to move it and the buyer will also be struggling to move the assets price to it favor making them open and end with equal price.
It Japanese the word doji mean mistake and through this signify indecision in the market
There are 3 types of the doji candlestick which are gravestone(bullish reversal),long-legged and dragonfly(bearish reversal) doji pattern and the 3 of them depends on where the line fall open or close.
it also resembles the plus sign(+)
It is best advice the the trader following up this pattern should alway watch out for when there will be formation of the next candle because it does not tell when the price will go up and down.
Source
Hammer candlestick pattern
From the name,this candlestick look like hammer.
This is a reversal candlestick(bullish reversal),this pattern has only one candle,
Which is made up of a lower wick that represents period of trading and a short body at the top.
Here the lower wick which represents the time of trading shows when the sellers were in control of the market but their control was surpass by the buyers who were able to reverse it and took over the control moving the assets price close near the days high which will cause a formation of a short body at the candle top.
The formation of this candle normally shows that there will be a possible reversal in the market.
Source
Morning star candlestick pattern
Here the sellers control the price in the market before the buyers are able to make it reverse(take over the control).
It is also a pattern with 3 candle(bullish,doji and bearish) reversal candlestick pattern normally seen in the downtrend.when the price of assets experience a long downtrend during a particular period of time before the buyers makes the price move up and this will signify a bullish move.
And if found in downtrend it shows a possible reversal of price.
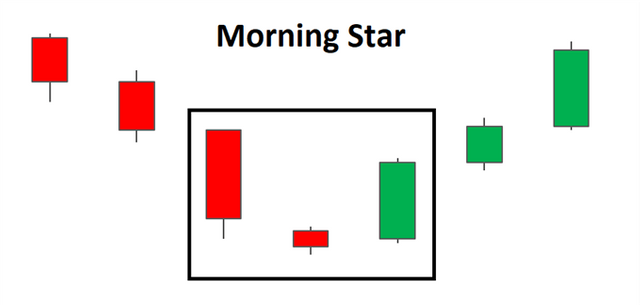
Source
It is used in predicting price in a short period
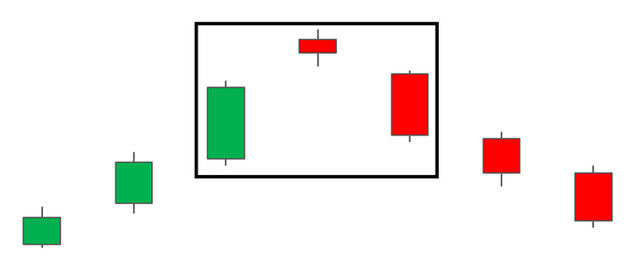
Evening star candlestick pattern
This is an inverse of the morning star candlestick pattern.it is a reversal pattern(bearish).
It is a pattern with 3 candle
It is use in detecting the when the trend want to make a reversal by this it helps the trader and investors to know the future plan of asset,normally in the uptrend unlike the morning that is seen in the downtrend
Source
QUESTION 2
Identify these candlestick patterns listed in question one on any cryptocurrency pair chart and explain how price reacted after the formation. (Screenshot your own chart for this exercise)
ANSWER
BULLISH ENGULFING CANDLESTICK PATTERN
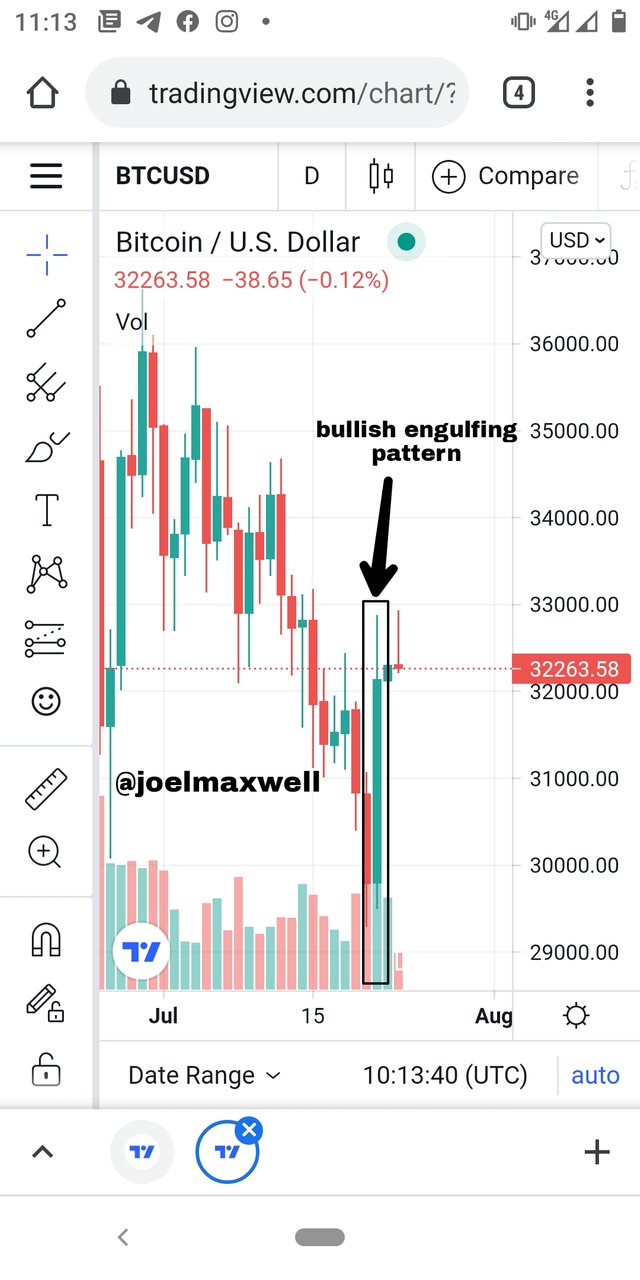
Source
From the screenshot above it was taken from a day chart which was from 20-21 july 2021 using BTCUSD in tradeview
On the 20 July 2021 as we can see the market was on a bearish candle which shows us that the sellers were in control of the market but on the 21 July 2021 a bullish candle engulfed the it thereby causing a reverse and making the buyers to take control from them.
The bullish was form in the downtrend toward this time of formation the sellers are leaving the market.
DOJI CANDLESTICK PATTERN
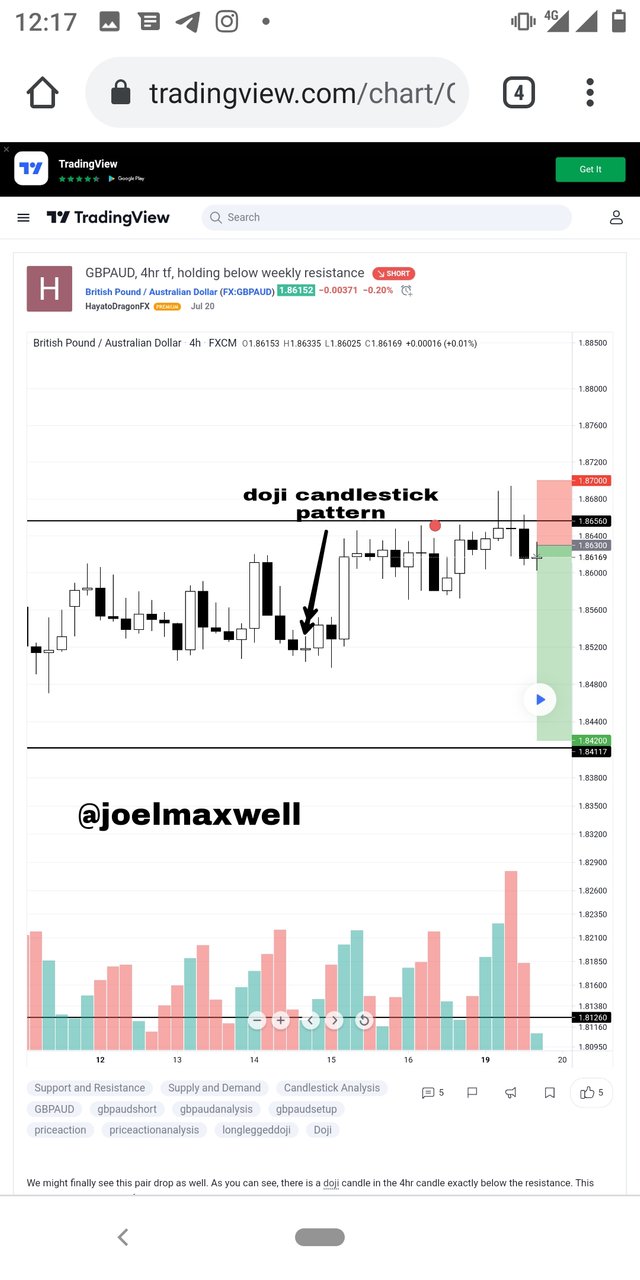
Source
Doji candlestick is indicated by the positive sign(+) and here no one is control of the market price the amount used in opening is the same amount the market is close with both the buyers in this pattern are the same.it also brings about indecision in the market to the buyers and sellers.
HAMMER CANDLESTICK PATTERN
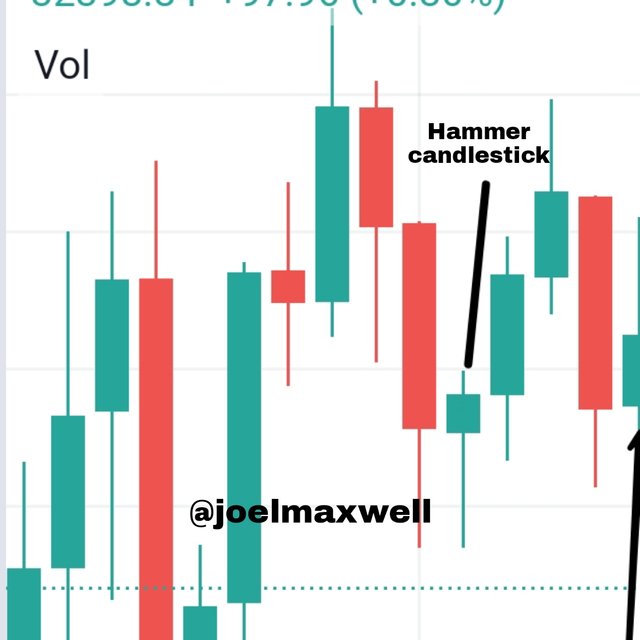
Source
Here the price of the market was controlled by the seller but unfortunately the buyer were able to take the control of the price again causing a reversal,when this pattern is seen it mean the will be a potential reversal in the market.
MORNING STAR CANDLESTICK PATTERN
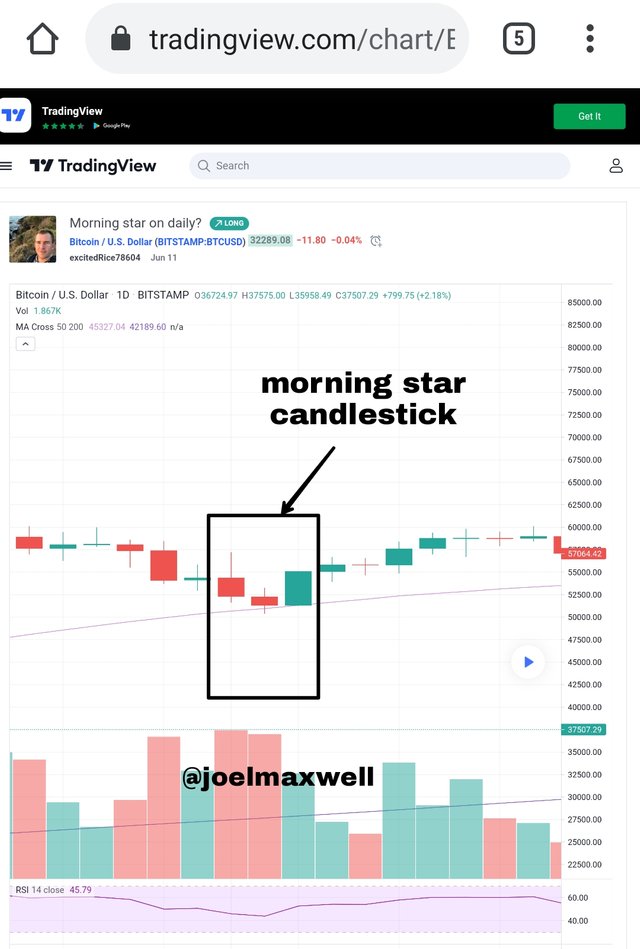
Source
It is made up of 3 candles and normally seen in the downtrend when assets price witness long down before the price rise up again.sellers control the price before the buyers reverse it.
When notice it means the will be a possible reversal in the price of assets.
EVENING STAR CANDLESTICK PATTERN
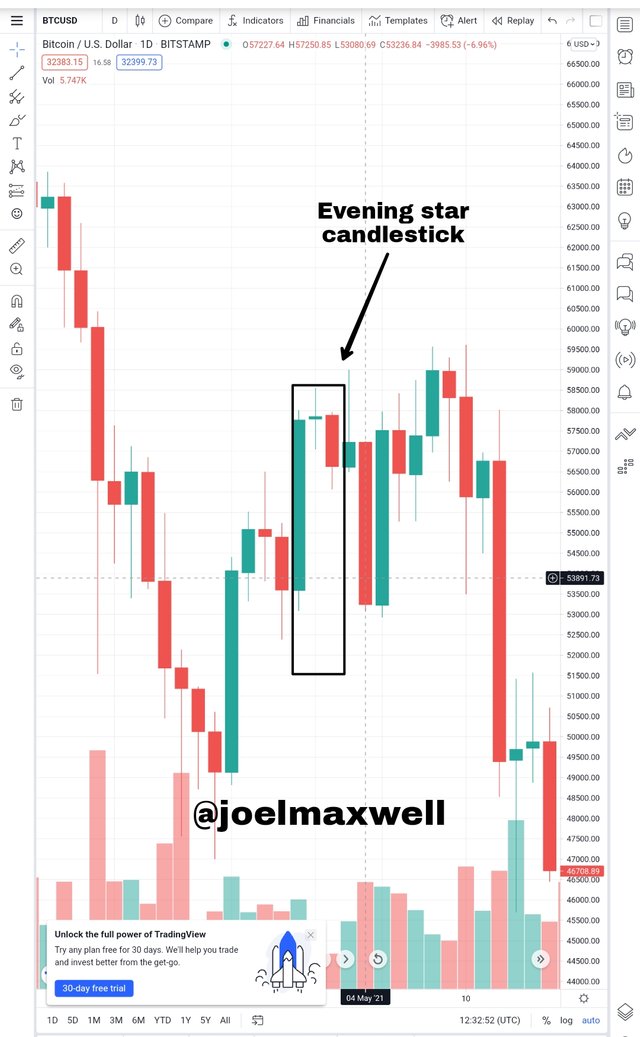
Source
it is a reversal pattern(bearish)
It is a pattern with 3 candle
It is use in detecting the when the trend want to make a reversal by this it helps the trader and investors to know the future plan of asset,normally in the uptrend .
QUESTION 3
Using a demo account, open a trade using any of the Candlestick pattern on any cryptocurrency pair. You can use a lower timeframe for this exercise.(Screenshot your own chart for this exercise).
ANSWER
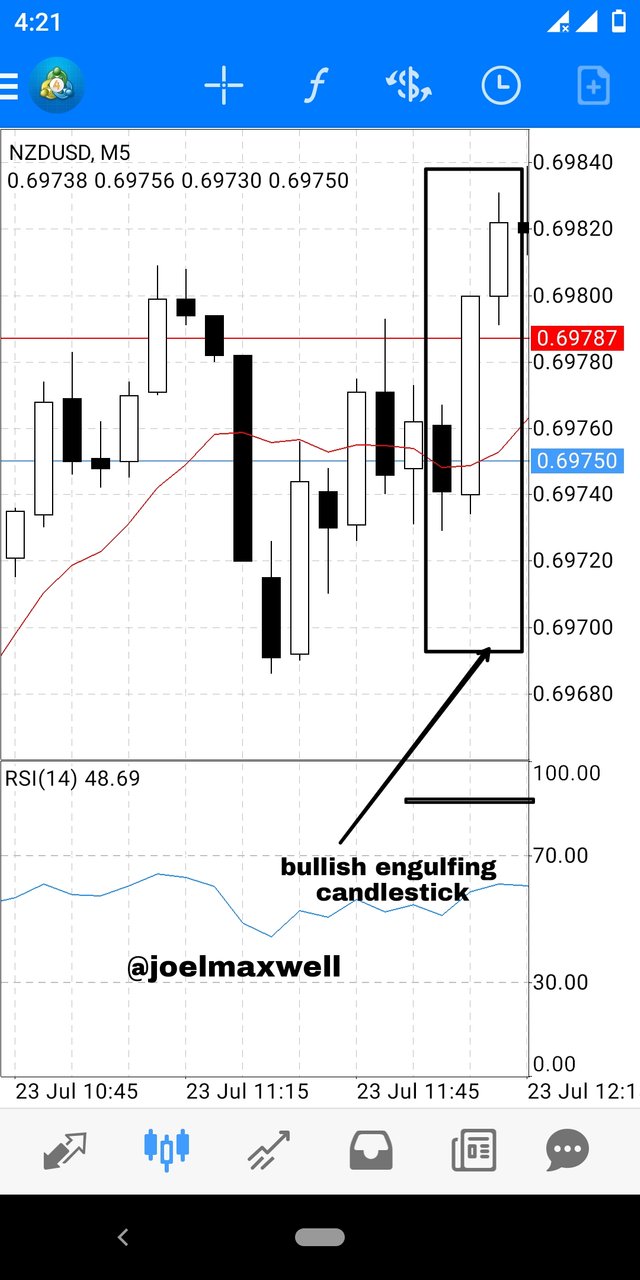
I will be using a bullish engulfing candlestick pattern because this is one of the best the traders always look out for.
Am working on a time frame of 5 minutes on metaTrader 4 demo account
With NZDUSD
[Screenshot from metaTrader 4]
Firstly,I look out for a point i will see a bullish candle engulf the previous candl.it is the i will enter the market because it is the best entry point for buyers.
[Screenshots from metaTrader4]
Seeing the engulfment i know that the will be a potential reversal,so i start buying.
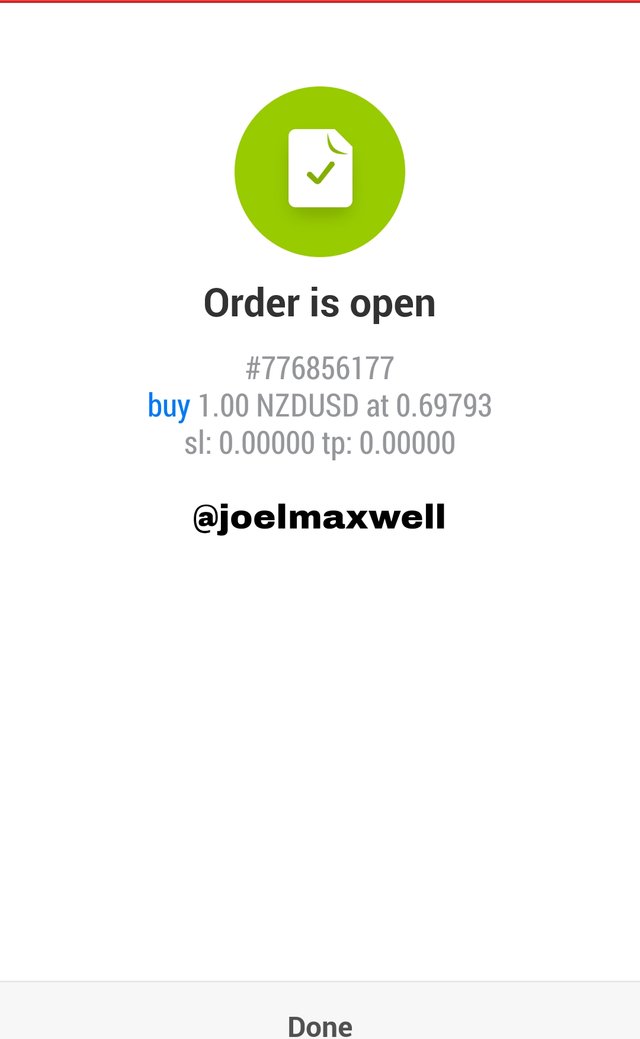
[Screenshot from metaTrader4]
CONCLUSIONS
I have been able to learn alot about candlestick and how to identify it and I also learn that you do not rush to enter the marker but sometimes you wait for the next candle.
I also learnt that the buyer and seller can enter the market and come out the same and the same price use in opening the market can also be the same used in the closing.
Lastly,I had the oppurtunity to use a demo account on metaTrader 4 to do a practice which was really interesting.
Hello @joelmaxwell , I’m glad you participated in the 4th Week of the Beginner’s class at the Steemit Crypto Academy. Your grades in this task are as follows:
Observations:
In this section, you were required to use your own chart on any cryptocurrency pair.
In this section, you were required to open a position on any cryptocurrency pair. But you used a currency pair for this section.
You have failed to adhere to the homework guidelines.
Thank you for participating in this homework task.