Crypto Academy Season 3|| Week 5 || Homework Post for Professor @lenonmc21 | Trade with 'Simple and Exponential Moving Averages' + application of 'Fibonacci Retracements' by @joelmaxwell

Introduction
Hello steemian,my name is @joelmaxwell am glad to be part of this lecture and participating in the homework task.I hope to really improve this week.

Question 1
Define in your own words what are simple moving averages and exponential moving averages.
ANSWER
simple moving average (SMA)
SMA is an indicator used by traders of cryptocurrency.it helps them in knowing the price of an asset at a given timeframe with so many importance.
It is also an indicator that can be used in calculating the average price of an asset price at a particular timeframe and also important to note that if we noticed the SMA moving downward it means that the asset price is also going down,same thing is applied when it is noticed going upward.
It is also an indicator that gives a trader an update about an asset price in a particular timeframe and because of this some trader normally sees it as an indicator of trend because it helps the trader to know about the trending in the price of assets in a particular timeframe.
Exponential moving average(EMA)
EMA is a moving average,it is similar to SMA ,it gives recent price of assets.also used in knowing how the price of assets is trending at a particular timeframe and also a fast moving indicator and mostly preferred by trader.
Question 2
Explain how simple and exponential moving averages are calculated
ANSWER
For simple moving average(SMA)
We use it to calculate the average closing os assets price and divide it by a the timeframe.
mathematically
The SMA of BTC/USD is 20.65,21.62,22.50,20.73 and 20.03 at the period of 5 years.
To calculate it
We will first take the average
20.65+21.62+22.50+20.73+20.03=105.53
We divide it by the timeframe which is 5yrs
105.53/5=89.51
Therefore the simple moving average for BTC/USD is 89.51
It is very simple as the name implies.
for exponential moving average
To calculate EMA
Formula
Price(A)× k + EMA(J) × (1-K)
Where
A= today price
J=yesterday price
N= number of days
K= 2/(N+1)
Question 3
Briefly describe at least 2 ways to use them in our trading operations.
ANSWER
There are being used to know the current trend of assets price and this helps the trader to know the type of decisions to make in the market.
It also helps trader in identifying the support and Resistance zone,which will help the traders in knowing the best point to enter and exist the market.
Question 4
What is the difference between simple moving averages and exponential moving averages (Explain in Detail)
ANSWER
for simple moving average calculation has the name implies,is simple which is just to take the average of the assets price and divide it by the timeframe.while for Exponential moving average it has a complex way in solving it.
simple moving average doesn't give the trader the recent price while Exponential moving average does
simple moving average is dull and this makes trader to prefer the Exponential moving average which is fast in giving of recent asset price
exponential moving average places more weight on recent asset price unlike the simple moving average that doesn't.
Question 5
Define and explain in your own words what "Fibonacci Retracements" are and what their gold ratios are
ANSWER
Fibonacci Retracement is a tool that is being used by trader in identifying the support and the resistance zone with a horizontal line that is being drawn on a chart of price of assets and this will help the trader in setting of target price for asset.
It is also made up of numbers that are arranged series, and the series numbers are being gotten when we add the last two figures
And the number gotten from the addition is the called the Fibonacci sequence for example we have 0,1,1,2,3,5,8 meaning 0+1 will give us 1,we add the last two again 1+1 will give us 2 etc. this number we get from the adding is what us known as the Fibonacci sequence.
Fibonacci retracement ratio is gotten when we divide the last number by the second number towards the right of the sequence
For example; we have numbers like 0,1,1,2,3,5,8
To calculate for the Fibonacci ratio
0/1=0
1/1=1
1/2 =0.5
1/3 = 0.33
2/3 = 0.67
3/5 =0.6
3/8= 0.37 etc
In order to obtain the ratio we will have to divide any number by it previous number such as 5/8=0.6 or 3/5=0.6
To obtain the Golden ratio will be dividing a number we have in the sequence by any of the number following it and calculate the percentage
For example percentage of 0.33
0.33×100/1=33%
practical(using your own images)
show step by step how to add a "Simple and Exponential Moving Average" to the graph (Only your own screenshots - Nothing taken from the Web).
step on how to add SMA
Adding a simple moving average to chart
Step one:
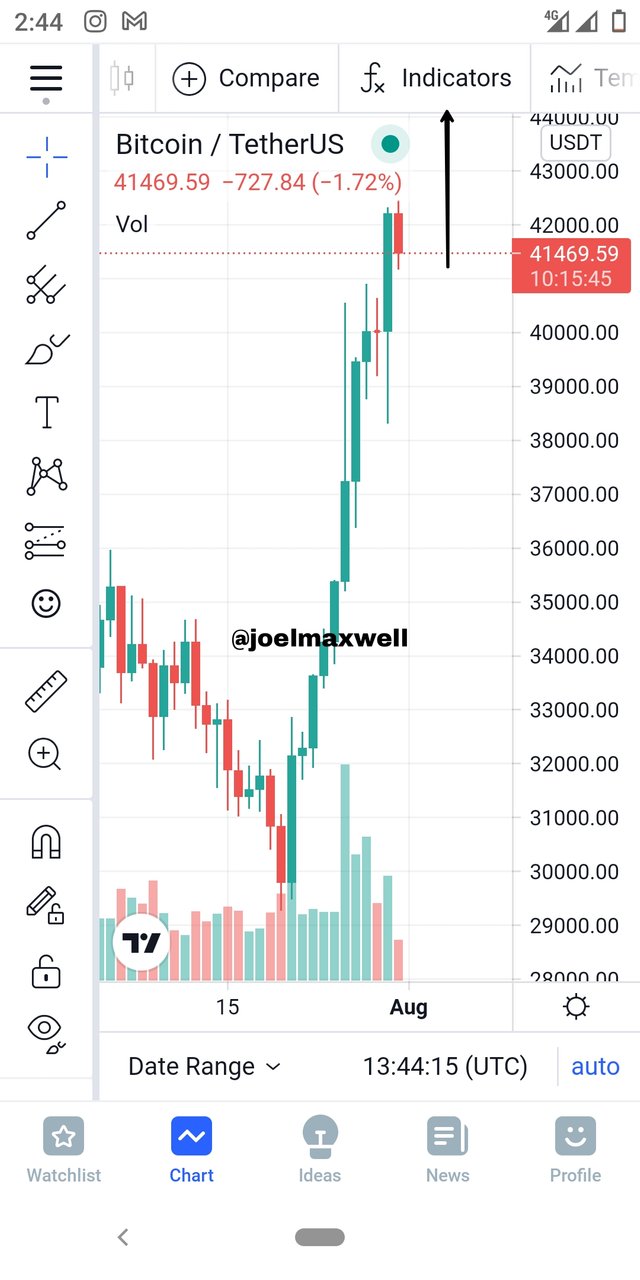
I will make use of the trading view platform by
tradingview application
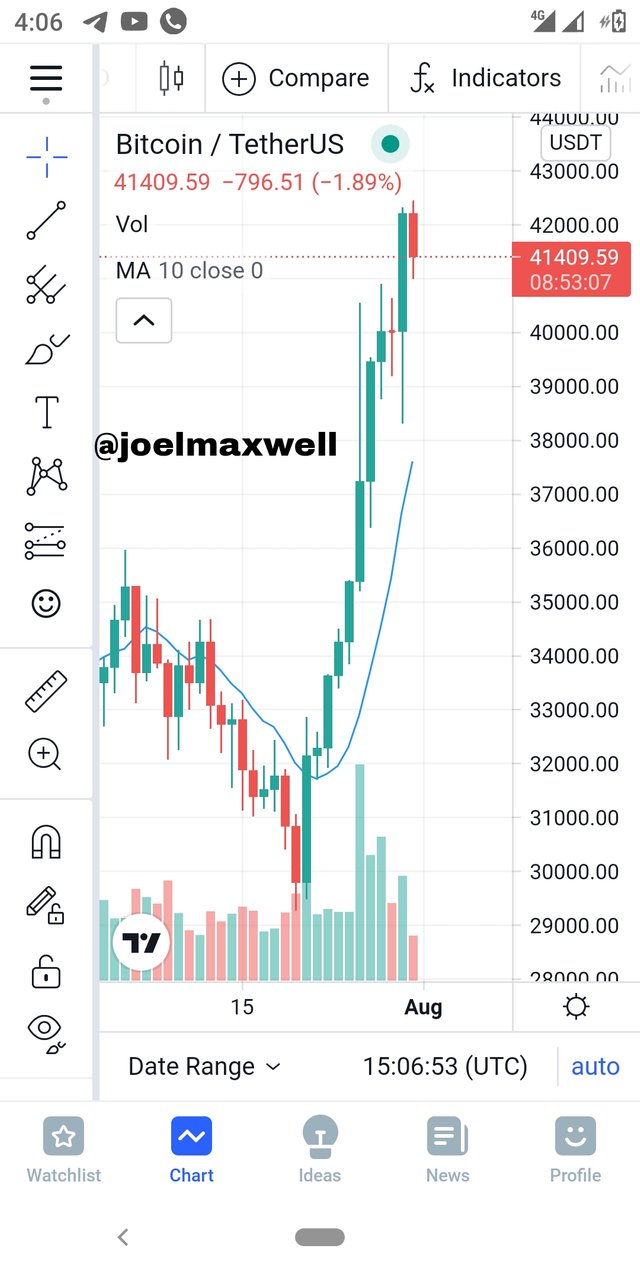
Once it open you will select any cryptocurrency pair of your choice and click on indicator
step two
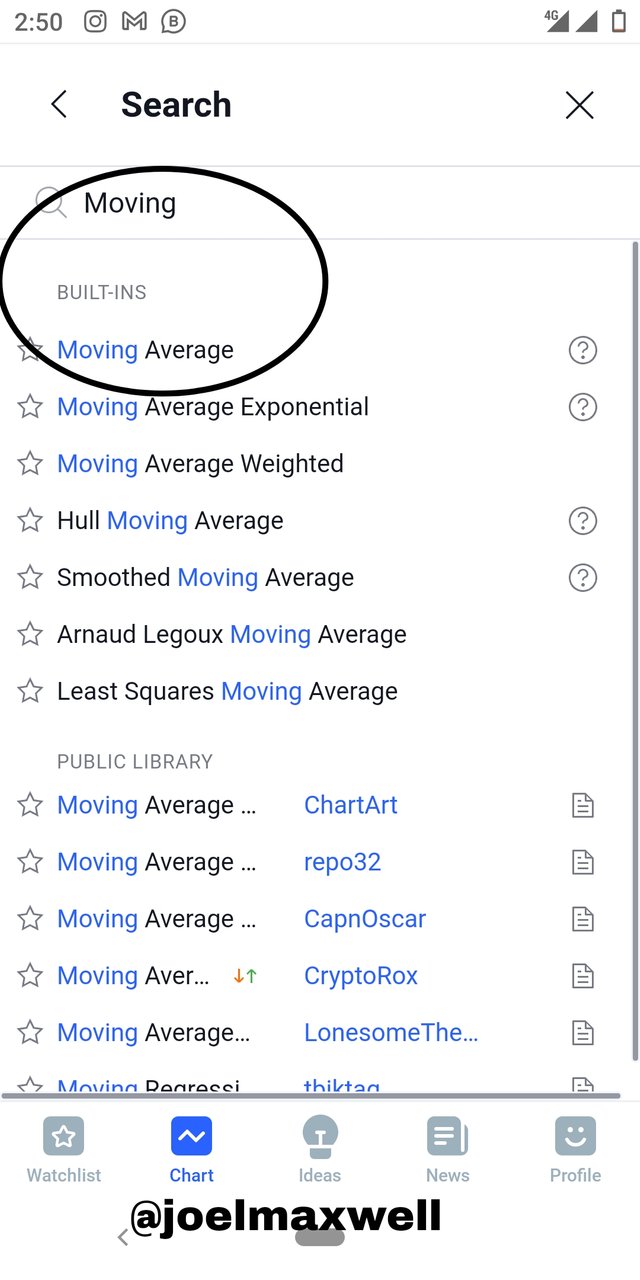
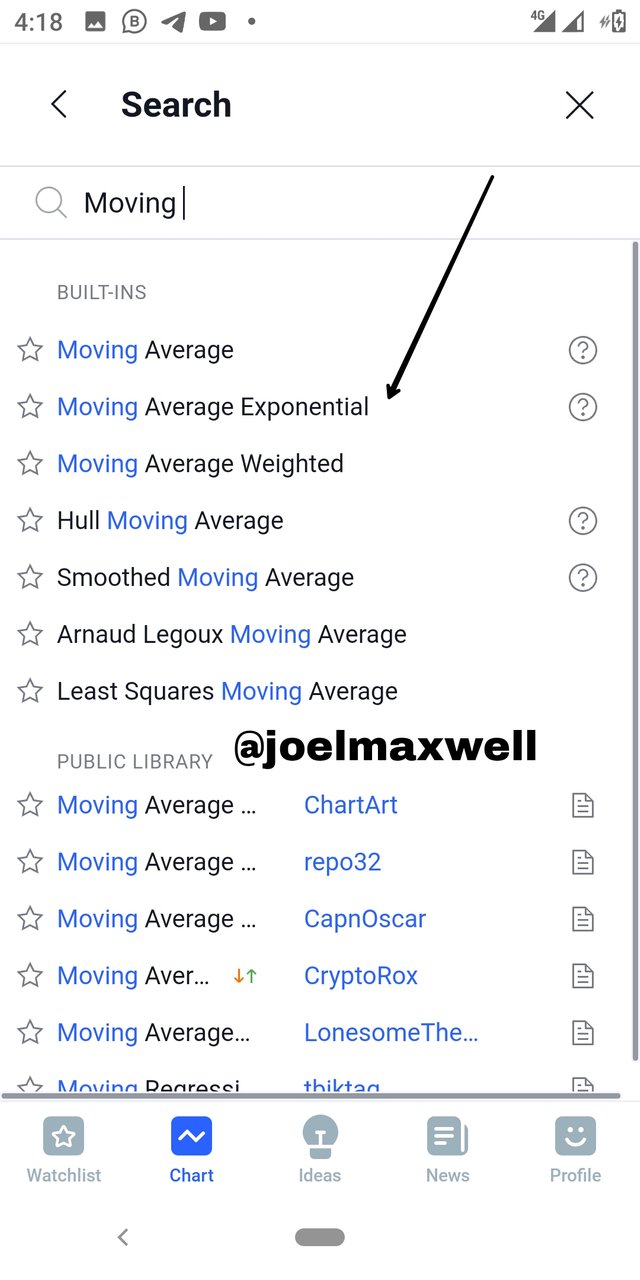
After clicking on the indicator,an icon will pop up with a search place there you type moving average
Step three:
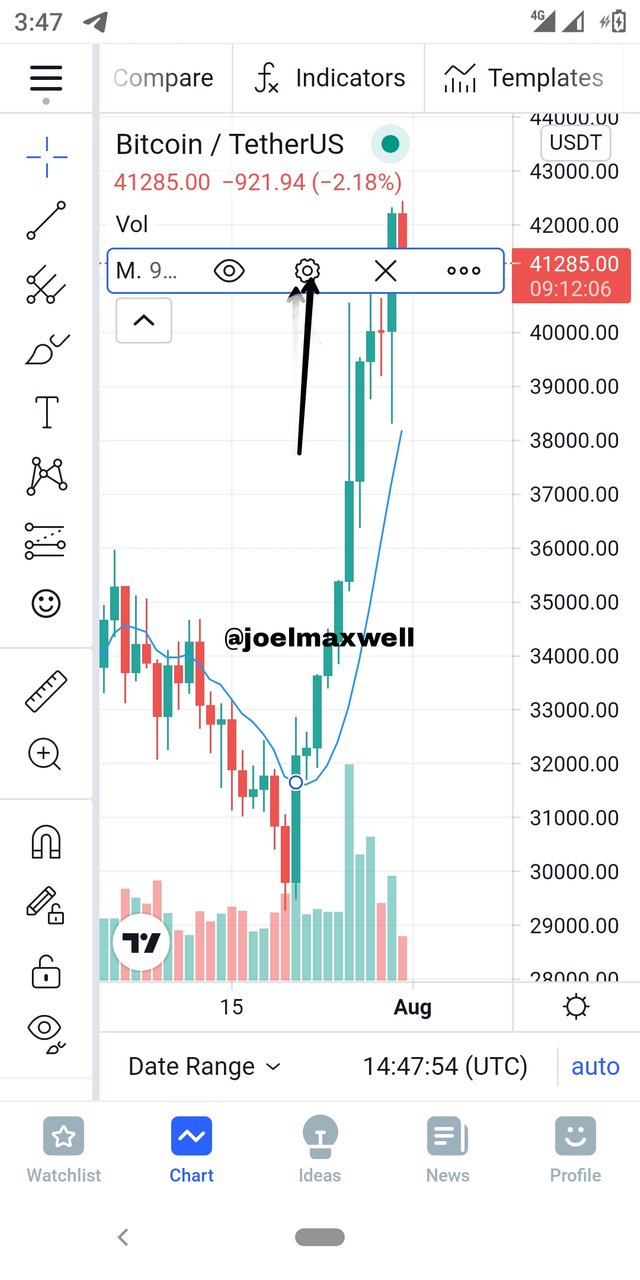
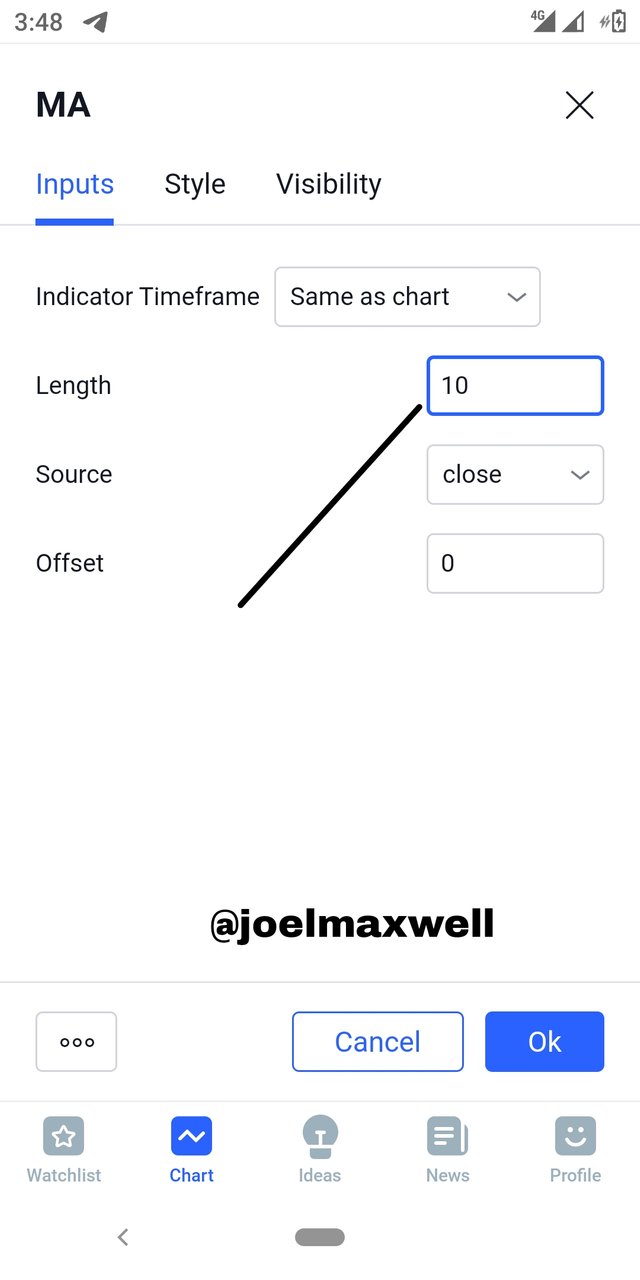
Next thing is to set our MA by editing from the top left corner of the assets price chart .we will
MA = 10
step four
To add exponential moving average
Same procedure but we change the following
step one
you click on the indicator and search for moving average exponential
step two
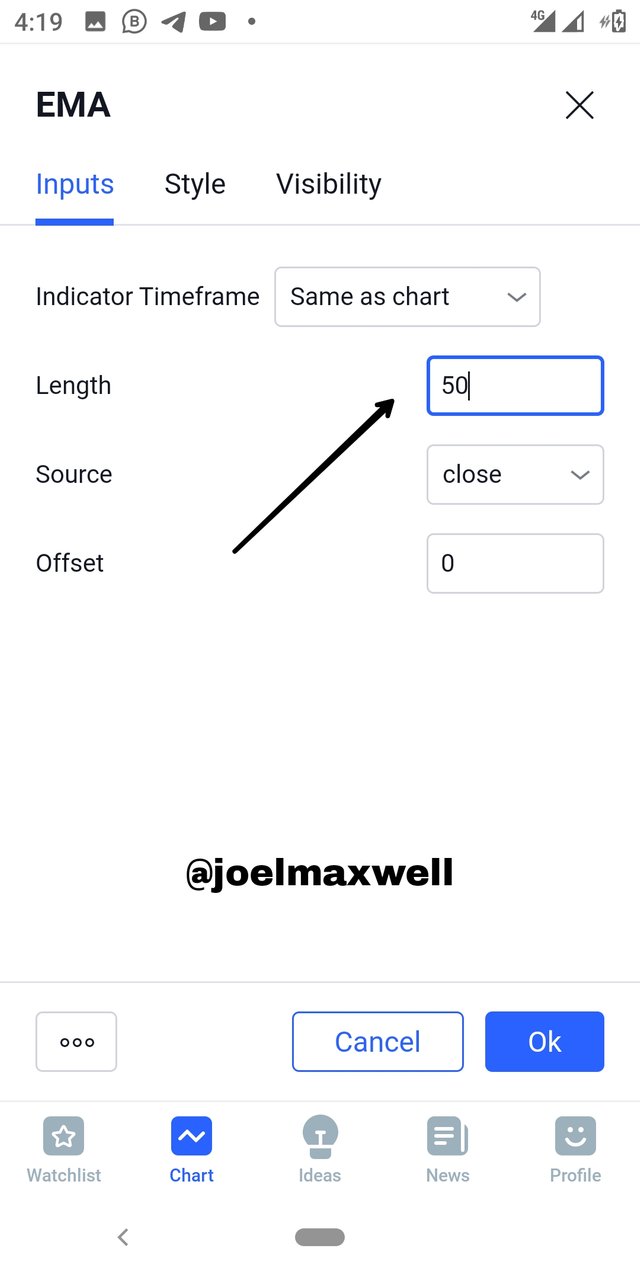
You reset it from default length 9 to 50
EMA=50
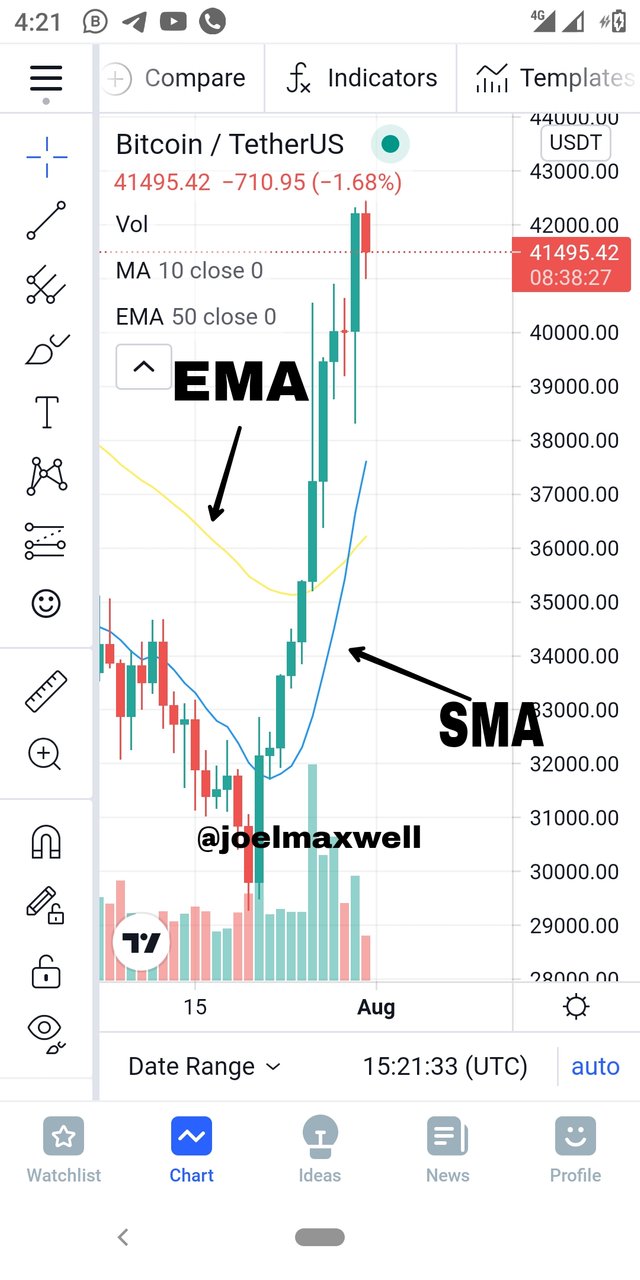
step three
Your chart of simple moving average(blue) and exponential moving average(yellow color)
Use "Fibonacci Retracements" to chart a bullish and bearish move (Own screenshots only - Nothing taken from the web).
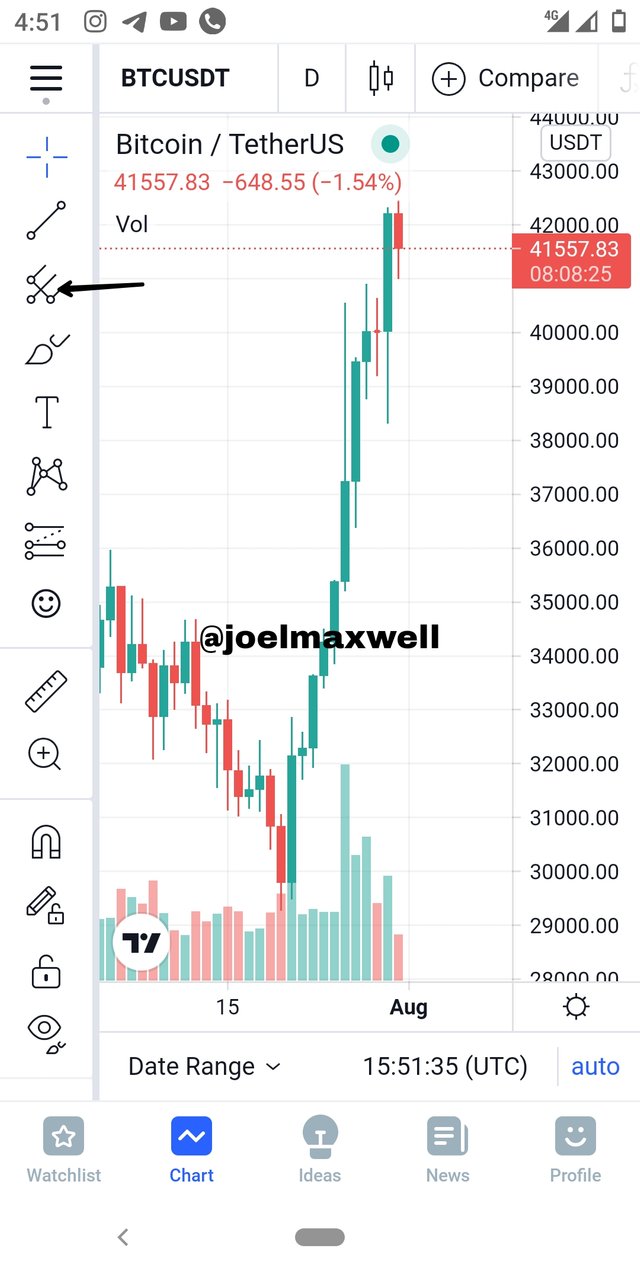
step one
I will still be using tradingview application
You will click on an icon the one arrow is pointing in the picture below.
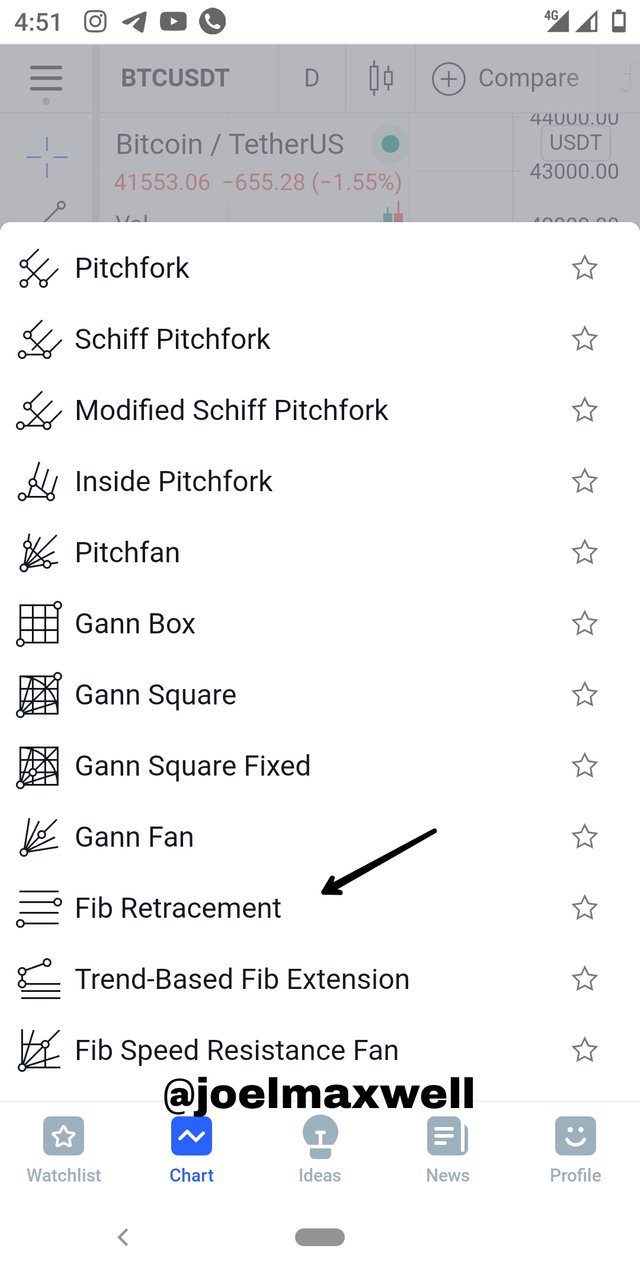
step two
After clicking the icon you check for fib retracement and click
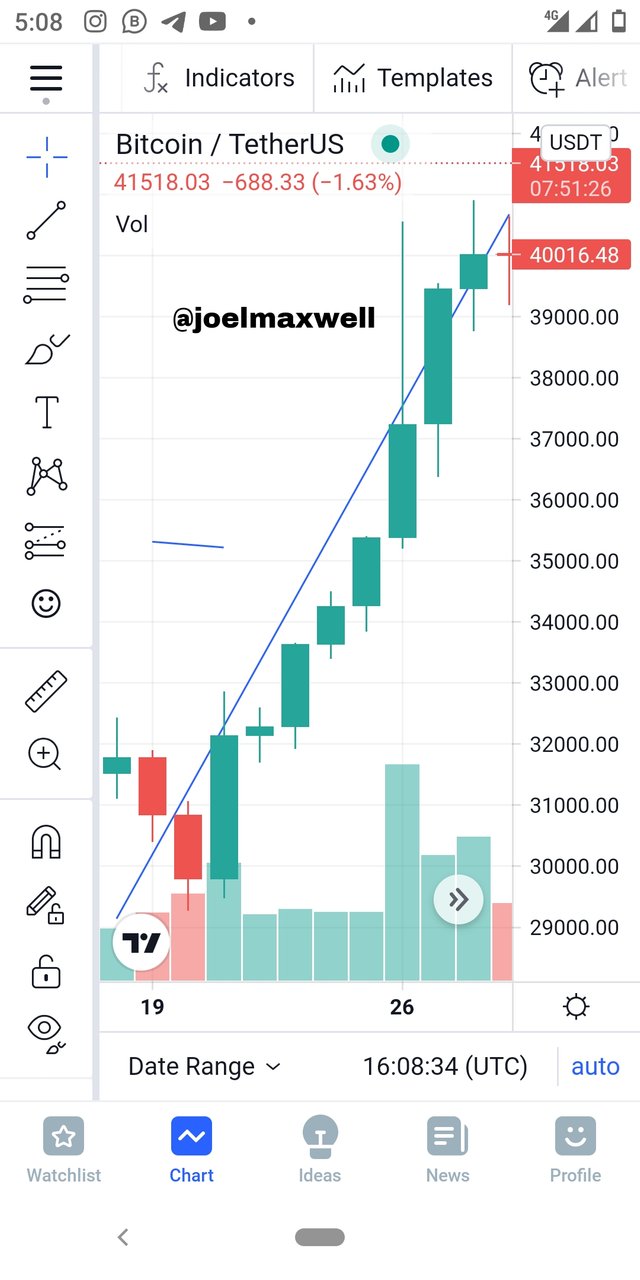
for bullish
It is drawn from the minimum point(low) to the maximum point(high)
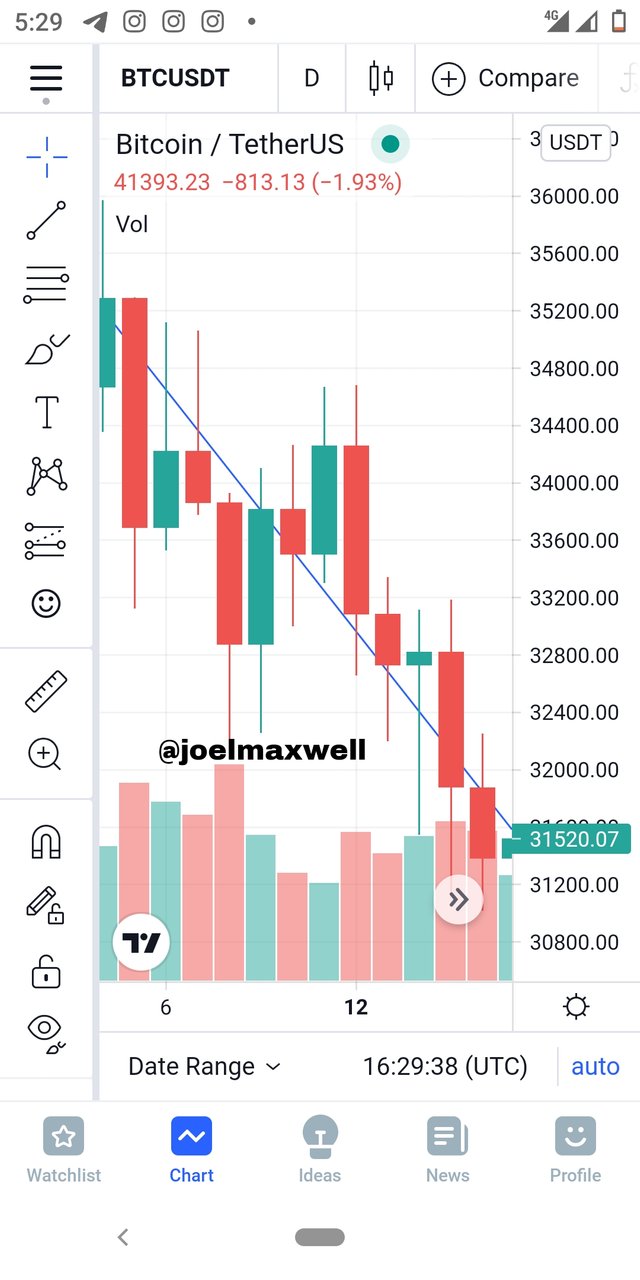
for bearish
It is drawn from maximum point(high) to the minimum point(low)
conclusion
This week lecture was really interesting,I learnt about simple and exponential moving average and how it is calculated,the practical part of it too using tradeview application.
I also learnt that traders makes good use of moving average in predicting future price of assets and Fibonacci retracement that is being use by traders to identify support and resistance zone and set target.
Thank you prof @lenonmc21 and hope I do better this week.