Candlestick patterns - Steemit Crypto Academy Season 4 - Homework Post for [ @reminiscence01 ] Task 10.
INTRODUCTION
Hello steemian, am very happy to be part of this community and participate in the beginners course task 10, which is all about the Japanese candlestick. The topic is really an interesting one because it as help me to know more about what this candlestick is all about.

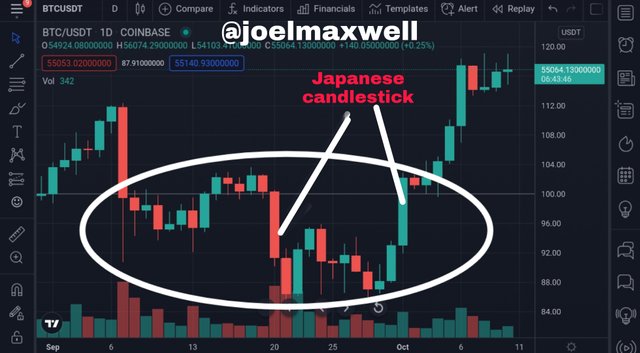
1a) Explain the Japanese candlestick chart? (Original screenshot required).
Source
Japanese candlesticks as the name imply is a candlestick that was developed by a Japanese rice farmer Munchisa Homma.
It is a technical tools in which the traders of cryptocurrency make use in analyzing the price movement of assets and how the market is trending if it is in the bullish or the bearish trend in a particular period of time it may be in hour,week etc.
In the Japanese candlestick chart, we have 2 candle which are the bullish candle and the bearish in color which have different color the bullish is green or white in color and bearish is red or black in color and the both of the signify different thing the bullish which is green in color help the traders to know the the price of assets is increasing and when it is in bullish trend. It is here that the trader enter the market and make decisions about when to enter the market and maximize profit while loss is minimized.
In the Japanese candlestick chart, we have to candle which are the bullish(green color)and the bearish candle (red color)
.jpeg)
Source
Here the bullish candle, it is shows when the assets price is increasing in a particular period of time while the bearish candle is red color and shows when the assets price is decreasing
The 2 candles(bullish and bearish candles) are similar in that the both of them are use in knowing the trend in the market if it is in an uptrend or downtrend.
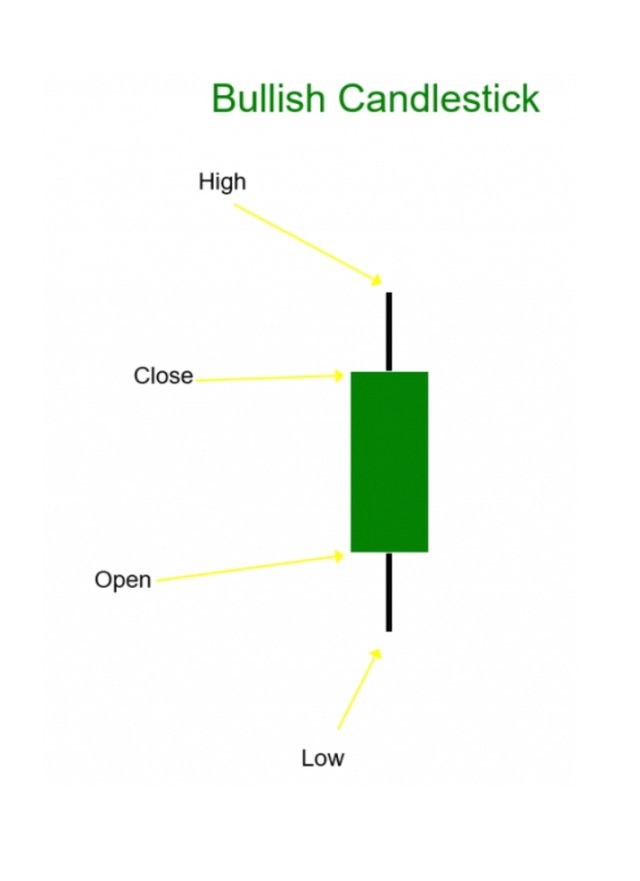
The 2 Japanese candlestick has four dimensions which are
- The high
Which is all about the highest price of assets in the market in a particular period of time - The low
Which has to do with the least price of assets in the market in a particular period of time. - The open
The price in which the market start with that is the opening price. - The close
The price in which the market close with that is the closing price in a period of time.

b) In your own words, explain why the Japanese Candlestick chart is the most used in the financial market.
The Japanese candlestick chart is mostly used because of the following features
The Japanese candlestick chart is a very simple chart which is easy for trader to understand due to the fact that there are 2 with different color, here the trader will always find it easier to understand which one is good and which one is bad.
This type of candlestick chart is also been used because it make it easy and simple for trader to understand and by this the decision will be easy for the trader to make because the will know when to enter the market and when to exist the market.
With the features above it will help the trader to know when to enter the market and minimize loss while profit is being maximize.
It help the trader to know the type of trend in which the market is moving, if the market is in an uptrend movement or is in a downtrend movement.

c) Describe a bullish and a bearish candle. Also, explain its anatomy. (Original screenshot required)
.jpeg)
Source
The bullish and bearish candle have similar features and both of them are found in the japanese candlestick chart.
The are use in knowing the trend movement in the market and the movement of assets price in a particular period of time.
The 2 candles also have 4 dimension which are the high, the low, the open, the close
THE BULLISH CANDLE
Source
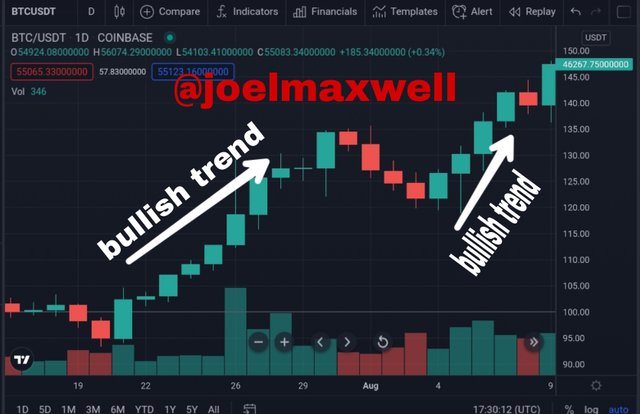
This type of candle is green or white in color and is also shows when the price of assets is in an increasing state with this candle we can also know the type of trend the market is moving to, which is uptrend(bullish trend) when it comes to bullish candle.
Whenever a trader spot this candle, the trader enter the market because the will be able to sell most of their assets and profit will be maximize.
The bullish candle, has explained earlier has 4 dimension which are
- The high
Which shows the trader the highest price the asset is in the particular period of time. - The low
Just has high is the highest amount of assets, the low is the least price of assets in a particular period of time. - The Open
This is the price in which the market start with, that is the opening price of assets in the market. - The close
This is the price in which the market end with, that is the closing price of assets in the market.
Source
THE BEARISH CANDLE
Source
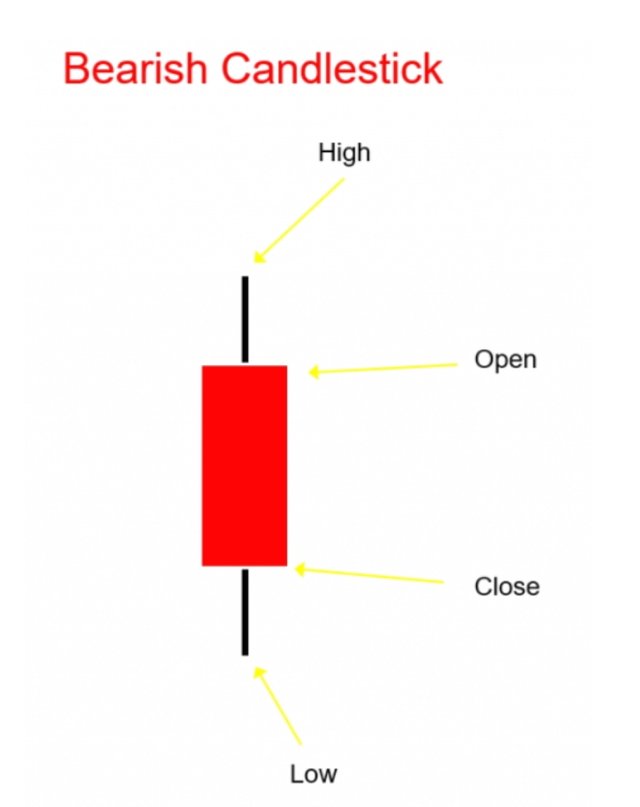
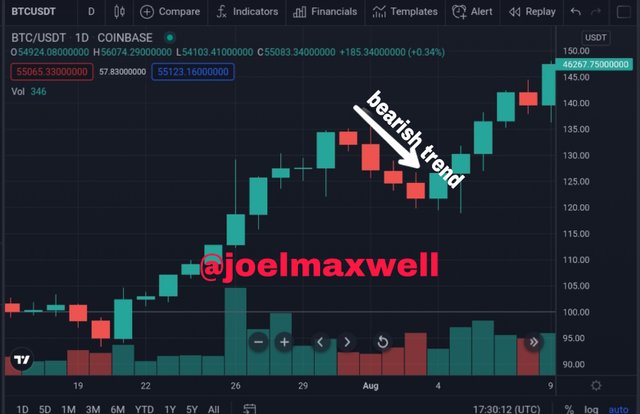
This type of candle is red or black in color and is also shows when the price of assets is in an decreasing state with this candle we can also know the type of trend the market is moving to, which is downtrend trend(bearish trend) when it comes to bearish candle.
Whenever a trader spot this candle, the trader exist the market because the will not be able to sell most of their assets and will have to leave the market to minimize loss
The bullish candle, has explained earlier has 4 dimension which are
- The high
Which shows the trader the highest price the asset is in the particular period of time. - The low
Just has high is the highest amount of assets, the low is the least price of assets in a particular period of time. - The Open
This is the price in which the market start with, that is the opening price of assets in the market. - The close
This is the price in which the market end with, that is the closing price of assets in the market.
Source

CONCLUSION
The topic is really an interesting one, it help me to know more about what the Japanese candlestick is all about and how it help traders in making decisions in the market and maximizing profit.
It is one of the mostly used chart because it is simple and easy to understand.
I want to thank prof @reminiscence01 for the interesting lecture
Cc : @dilchamo