Candlestick Patterns- Steemit Crypto Academy Season 4 - Homework Post for Task 10
.png)
1a) Explain the Japanese candlestick chart? (Original screenshot required).
b) In your own words, explain why the Japanese Candlestick chart is the most used in the financial market.
c) Describe a bullish and a bearish candle. Also, explain its anatomy. (Original screenshot required)

.png)
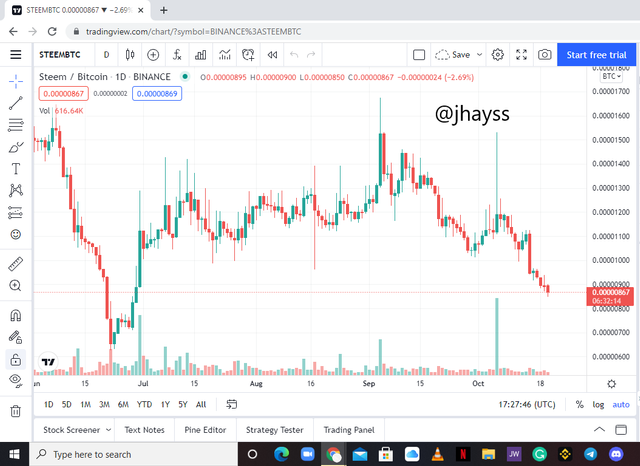
STEEM/BTC candlestick chart screenshot from Tradingview.com
The Japanese candlestick charts are one of the most popular candlestick charts. With this chart, traders use it to make trading decisions that are based on regular occurring patterns that help forecast the very short-term direction of the price. Thus, the candlestick charts are used by traders to determine the possible price movements that are based on past patterns.
Trading as we know is often directed by emotion. This can be read in the candlestick charts. The candlestick chart is very useful in trading since they show four price points. These are: open, close, low, and high. They tend to show throughout the period of time the trader sets or specifies.
A Japanese man by the name of Homma discovered this in the 1700s. This was a Japanese rice trader who had very good knowledge of demand and supply theories. He wanted to understand the price fluctuations and the particular market behaviors for the respective fluctuations. This is because tho there was a link between the price and the supply and demand of rice, their markets were really influenced by the emotions of the traders.
The candlesticks as we know show these emotions by representing or showing the size of price moves with different colors. In the candlestick charts, time frames can be changed so that it will create a good platform for predictions in future asset prices. The structure of the candlesticks as mentioned above consists of open price, highest price, lowest price, and the final price.
These candlesticks can be seen in exchanges like Binance, web-based charts like trading view.com and Poloniex.
It helps traders to take straight decisions.
The Japanese candlestick charts make it very easy to read and understand the price fluctuations very quickly. The compositions of the candlestick charts really make it easy to understand this since it consists of high, open, low, and close prices.The Japanese candlestick charts make it very easy to understand the uptrends and the downtrends of a market.
This is possible by just looking at the length and the color of the candles. The candlestick chart is usually made up of two colors with which one color always represents a positive price movement while the other color represents a negative price movement in the market.The Japanese candlestick chart gives the patterns in a very visible and clear picture to understand. It also presents users with a very user-friendly interface.
The chart gives great reliability of market information.
This chart is very popular because of how reliable it is. The reliability of the information in the chart is directly proportional to the success of the trader in trading. The Japanese candlestick chart provides more information about the movement of prices in the market. This is very useful to traders.
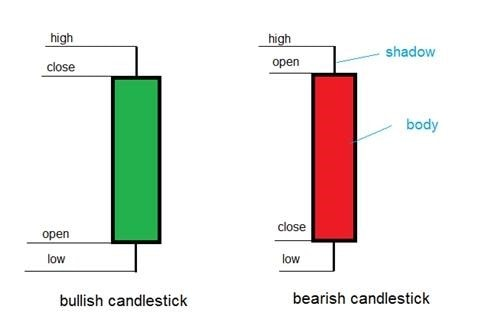
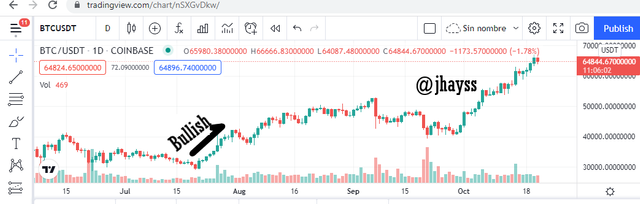
Bullish Candlesticks
The Bullish Candlestick indicates or shows how the price movement of assets increases over time in the market. The identification of a bullish candle indicates the increase of a price of an asset in the near future. These candles can be identified in green color and the closing price of an asset for a given time period is higher than the opening price of an asset for a given time period. With its anatomy, the bullish candlestick shows Close and High prices at the top of the candle while open and Low prices at the bottom of a bullish candle.
High Price
The high price indicates the highest price which is noted throughout a bullish price chart for a given time period. The price can be higher than or equal to the close price of an asset.
Low Price
The low price indicates the highest price which is noted throughout a bullish price chart for a given time period. This low price can be equal to or lower than the open price of a price chart.
Close price
The close price is the end of the candle for a given time period. This is the last noted price of the candle. Considering a bullish candle for a given time period, the close price is higher than the open price.
Open price
The open price is the initial price where the candle chart begins its activity in a given time period. Moreover, the open price indicates that the price will move in a bullish direction.
.png)
Screenshot taken from Tradingview.com
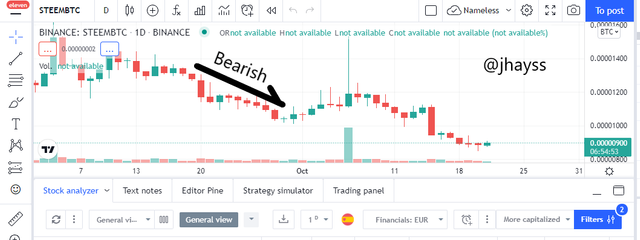
Bearish Candlestick
The Bearish Candlestick shows how the price movement of assets decreases over time in the market. The bearish candle can be identified in red color. The closing price of an asset is lower than the open price of an asset for a given period of time. It indicates a reduction of an asset price in the future while also urging traders to buy assets and invest for the future. This Candlestick always indicates both open and high price at the top of the candlestick and close and low price below the Candlestick.
Close price
The close price is the end price of the price chart for a given period of time. The open price of an asset is higher than the close price of an asset.
Open price
The open price shows the start of a price chart. It also helps to identify that the price will move in a bearish direction.
Low Price
This is the lowest price shown throughout a price chart during a specific period of time. This can be equal to or lower than the close value of the price chart.
High price
This indicates the highest value of an asset shown throughout a price chart for a given period of time. This can be equal to or lower than the open price.
.png)
Screenshot taken from Tradingview.com
Conclusion
I'm thankful to professor @reminescence01 for this amazing lecture. I've come to understand the Japanese Candlestick and the types of candles be it the bullish candle and the bearish candle.
You should only use the #club5050 tag when your power-ups at least equal, or better exceed, your cash-outs and transfers away over the past 7 days.