Steemit Crypto Academy Season 4 Beginner's Course - Task 10: Candlestick Patterns By @jerryofkingz

Hello great steemians, I'm glad to be a partaker of this very important task (Candlestick pattern) by professor @reminiscence01, I will be answering the number 3 question.
Identify these candlestick patterns listed in question 2b on any cryptocurrency pair chart and explain how price reacted after the formation. (Original Screenshot of your chart required for this exercise).
Explain the measures taking by the trader before trading candlestick patterns.
Using a demo account, open a position (buy or sell) on two crypto assets using any candlestick pattern and explain your reason for taking the trade. You can perform this operation using lower timeframes. (Show screenshots of your position and also your chart.
The following are the candlestick patterns listed in question number (2b) are :
Bullish engulfing Candlestick pattern
Doji Candlestick pattern
The Hammer candlestick pattern
The morning and evening Star candlestick pattern.
The Harami Candlestick pattern.
Bullish engulfing Candlestick pattern
This candlestick pattern is seen when the bullish candle after a bearish candle, is longer in size (in a layman's understanding). This candle sticks are shown by height according to the measure of time of trade per minute .This depicts the increase in buying activity in crypto/forex/trading market to selling activity, below is an illustration of the "bullish engulfing candle".
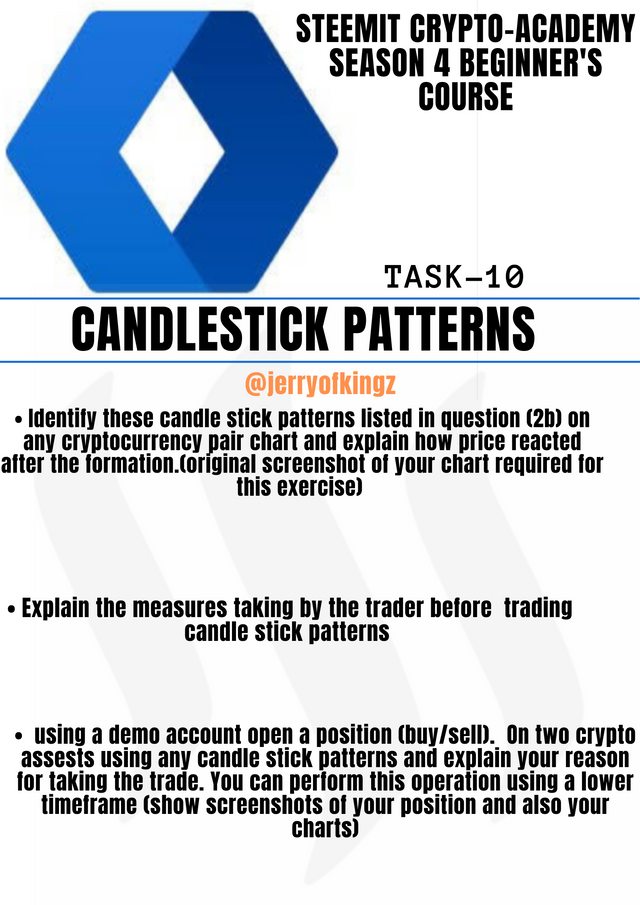
Bullish engulfing candlestick: HOT/USDT chart source
At the "wick" & "body" of the Bullish engulfing candlestick shown above, the low, high, open & close of the bullish candle after the bearish candle is longer.
We could see from the chart that after the bullish engulfing candlestick pattern, the volume increased, forming another bullish candlestick at 0.010060 making an uptrend movent of the market, which shows that buyers are in control at the moment and minute.
Doji Candlestick pattern
This candlestick pattern occurs due to the unstable decisions made by both traders (the buyers' and sellers') at the time. The Doji candle stick patter shows that neither the buyer or the seller is in control of the market.
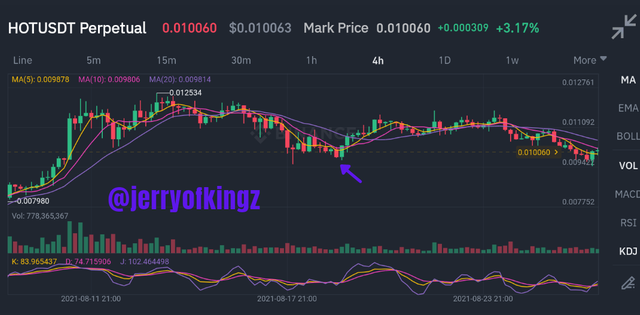
the three types of "doji candlestick pattern": HOT/USDT chart. source
After the occurrence of the Doji candlestick, the chart moved in equilibrium towards the up and down trend, I would say; forming a stable flow of the market . The chart remained at a stable rate between 0.010014 - 0.010019 due to the inability of either the buyers or sellers to possess control towards the market. The Doji candlestick shows that the candlestick opened and closed at the same price
The Hammer candlestick pattern
This candlestick pattern has a long tail with it's open price above the long tail and almost at the same price with it's closing price. This signals a strong reversal in trade when occured at the support level .
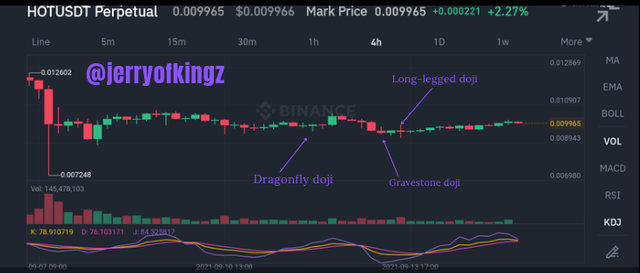
Hammer candlestick : HOT/USDT chart source
Starting from the point which the hammer formed, it has a high of 0.010061 and after the formation of the hammer candlestick the chart fluctuated uptrend and downtrend but increased past it's "low"(hammer candlestick picked out in the illustration above) resulting profit to buyers who swinged trade.
The morning Star candlestick pattern
The morning star candlestick is formed by three different candle pattern which includes firstly a bearish candle following a doji and a bullish candle.
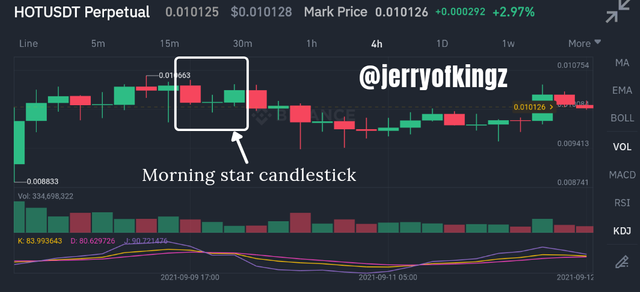
morning star candlestick: HOT/USDT chart source
After the morning star candlestick, there was a downtrend reversal which shows the control of the market by sellers. This downtrend starts with a bearish candle with its open at 0.010415 and it's high at 0.010507 signaling that buyers are trying to take over the market at the time but later been won over by sellers. As the chart moves from this point there was a downtrend and an uptrend fluctuation of the market.
The evening star candle pattern
The evening star candlestick pattern is comprised also of three different candlestick patterns just like that of the "morning star candlestick"but the reversal. The comprise firstly of a bullish candlestick followed by a doji and a bearish candlestick. here is an illustration of the evening star candlestick pattern.
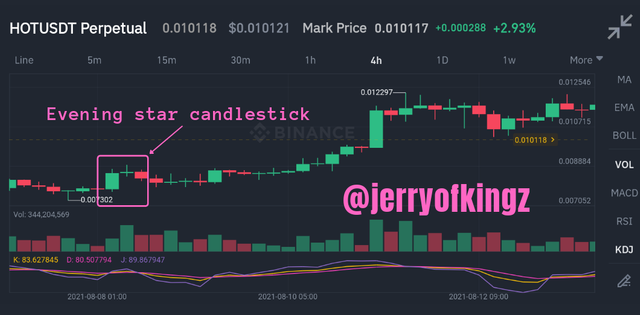
evening star candlestick: HOT/USDT chart source
After the "evening star candlestick" was a bearish candlestick which opened at 0.008315 and it's high at 0.008413 which shows the inability of buyers to control the market at the time. The chart moved in an uptrend direction after the formation of the evening star candlestick making profits to buyers who swinged the trade.
The Harami Candlestick pattern
There are two types of Harami candlestick which comprises of the ;
- Bullish Harami
- Bearish harami
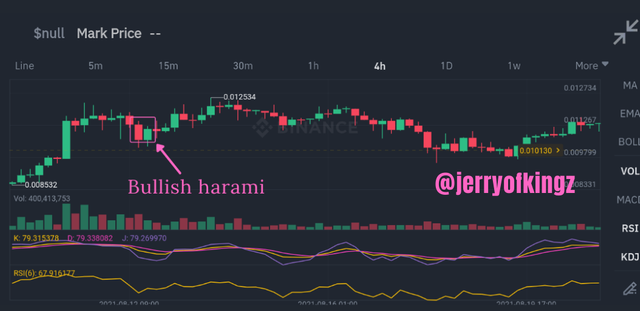
The bullish Harami -
This is the formation of a large bearish candlestick and a small bullish candlestick which shows a high probability of an uptrend reversal in the market, especially when formed at the support level of the chart.
They bearish harami -
this is the formation of a larger bullish candlestick and a small bearish candlestick, depicting a high probability of a downtrend reversal especially when formed at the resistance level of a chart.
They Harami candlestick pattern shows the indecision making between both buyers and sellers, here is an illustration of "the Harami candlestick pattern" below.
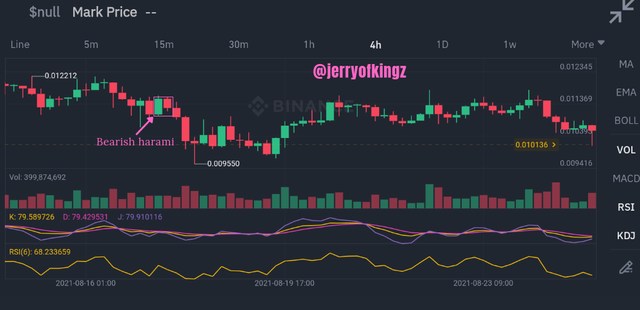
After the bearish harami was a downtrend flow in the chart up until a bearish candlestick with it's high at 0.009550(shadow weak) before the formation of an uptrend flow in the chart.
After the bullish harami was an uptrend flow in the chart up until a bullish candlestick with it's high at 0.012534 before the formation of a downtrend flow.
Explain the measures taking by the trader before trading candlestick patterns
The following measures are meant to be taking before trading the candlestick patterns;
The trader should be aware of the strategic positions to trade the candlestick patterns explained above. For instance, when placing a trade using the harami candlestick pattern, it is more strategic to place the trade either at the support region of the "bullish harami" or the resistance region of the "bearish harami"
The trader should avoid all sort of guessing work in the trading market and study the technical analysis meant for trading.
- The trader should be more patient and not to trade when there is a formation of a "doji candlestick pattern" until a lead is shown by the formation of another candle.
- The trader should learn to swing trades for better profit and also for the regain of lost profit if any, with time.
- The trader is advised to set up a "stop loss" and "take profit" in a particular trade opened, for safer purposes such as the termination of a trade when in loss (stop loss) & the collection of profit from a trade when in gain. These would help the trader minimize the rate of loss and an increase in profit.
- The trader is advised to study the previous chat of a trade and also mark out notable positions and candle patterns in comparison to the lesson taught here by professor @reminiscence01 and also with the use of technical analysis before setting up any trade.
With the use of forex demo account for this task question I will break down the process by which my trade is carried out and also the reason for taking the trade with the use of the "INVERTED HARMMER CANDLESTICK PATTERN".
Opening my MT5 application (forex trading app) I traded on EUR/USD
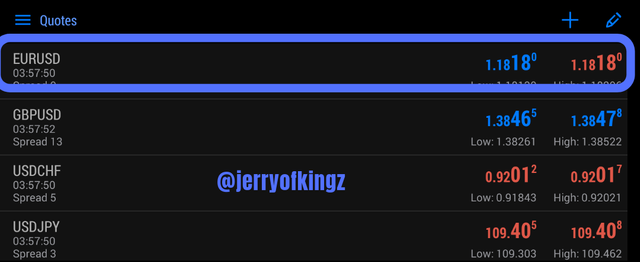
I placed a sell trade on EUR against USD,i.e; selling my EUR for USD, I placed the sell trade using the inverted hammer candlestick analysis which was at a resistance level signalling the downtrend flow of the chart, here is an illustration below;
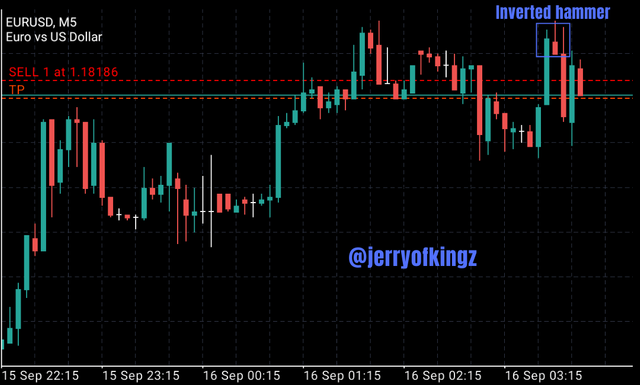
Opening the trade at 1.18186 and setting up my TP (take profit ) at 1.18180, I made profit due to the necessary precautions taking and the use of the "inverted hammer candlestick pattern" which I saw at the resistance level.
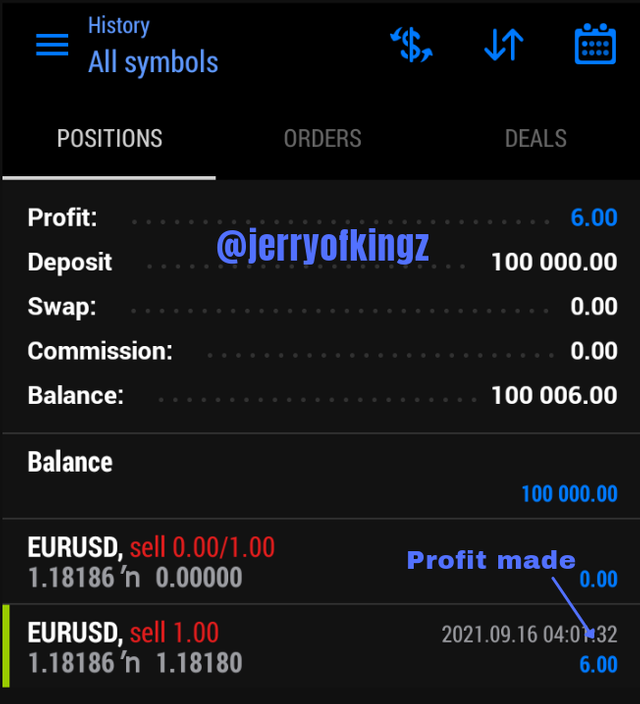
Made a profit of $6 using the inverted hammer techniques in my trade.
CONCLUSION
This lecture has made me to understand the importance of various candlestick patterns and there significant uses in trading, and has widened my knowledge in trading. I say a very big thank you to professor @reminiscence01 for this important lecture and I'm happy to must have understood the basic concept of trading and the risk involved in it.
Thank you all for reading.