Williams Percentage Range Indicator - Crypto Academy / S4W4 - Homework Post for @kouba01

Q.1. Explain the Williams %R indicator by introducing how it is calculated, how it works? And what is the best setting? With justification for your choice.
The Williams %R indicator is also called the Williams Percentage Range indicator or the WPR indicator for short. It is a technical trading indicator that can be used to ascertain the momentum of a trend as well as obtain other different trading signals.
This indicator was created by a commodities trader by name Larry Williams in 1973. The WPR indicator stands out among the other technical indicators invented by Larry Williams as it combines simplicity and effectiveness into one technical masterpiece.
Calculation
Calculating the WPR involves verified maximum and minimum price values of previous "n" periods, and daily closing price value of the observed period.
%R = ((Verified highest price of previous "n" periods - Daily closing price of current period) / (Verified highest price of previous "n" periods - Verified lowest price of previous "n" periods)) x (-100)%
E.g. The WPR is to be calculated for yesterday and observations were done for the previous 21 days. During observation period, it was verified that highest price was $200 and lowest price was $120. Yesterday, prices closed at $150. The WPR will be calculated this way,
%R = (($200 - $150) / ($200 - $120)) x (-100)%
%R = ($50/$80) x (-100)%
%R = (0.625) x (-100)%
%R = -62.5%
How WPR works
The WPR is like a more sensitive type of RSI and has similar working principles as the stochastic oscillator. It is plotted below the candlestick and is ranged to signal overbought and oversold conditions just like the RSI.
The WPR ranges from 0 to -100, all percentages. It has upper and lower thresholds of -20 and -80 respectively. These thresholds are referred to as "danger" values.
When the WPR rises above the -20% threshold, it indicates that the price is in the overbought region. The price is about reaching it recent peak and the bulls are taking over. It signals a buy trade.
However, when the WPR falls above the -80% threshold, it indicates that the price is in the oversold region. The price is about reaching it recent trough and the bears 🐻 are taking over. It signals a sell trade.
From our example, we arrived at a WPR of -62.5%. This falls within the upper and higher thresholds. Above -20% would have indicated an overbought condition while below -80% would have indicated an oversold condition.
Within the threshold, we can obtain the strength of the trend. If the WPR returns before hitting a threshold, we say the trend is getting week and this could likely be a buy or sell signal depending on the threshold and the trade type.
When using the WPR, the periods observed is usually set. It can vary depending on the choices and the type of the trader.
Best settings
The best settings for the WPR is 14 periods. This is the standard settings as it was the one favored by the inventor of the indicator.
It's best to use this standard settings until a trader finds (after testing and confirming) another period settings akin to them.
The reason why 14 periods is the best is because it was chosen by the inventor of the indicator as the standard setting.
Q.2. How do you interpret overbought and oversold signals with The Williams %R when trading cryptocurrencies? (screenshot required).
As was stated earlier, the WPR is scaled from 0 downwards to -100%. It has upper and lower thresholds within its range which are -20% and -80% respectively.
When the WPR goes above the upper threshold (i.e between -20% and 0%) the price is an overbought condition.
When the WPR goes below the lower threshold (i.e between -80% and -100%) the price is an oversold condition.
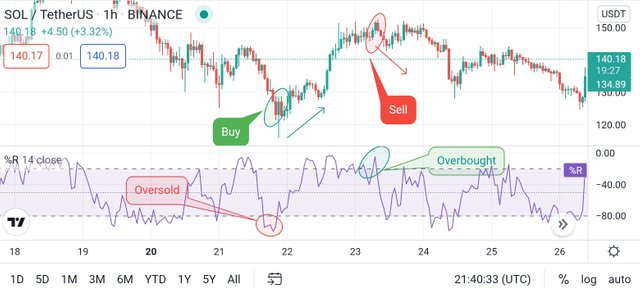
Generally, oversold conditions signal a buy entry or long position as the price is expected to rise from its low point. Overbought conditions signal a sell entry or short position as the price is expected to fall from its high point.
It's advised to wait for the %R to return after reaching the oversold or overbought zones in order to confirm a valid signal.
This is because, the price can continue rising for long periods even in overbought conditions and selling before it returns or corrects might result in premature selling.
Also, the price can continue falling for long periods even in oversold conditions and buying before it returns or corrects might result in premature buying.
Q.3. What are "failure swings" and how do you define it using The Williams %R? (screenshot required)
In trading charts, swings are price high and low points. When the price reaches a high point and returns, or when it drops to a low point and returns, those points can be called swing high and swing low respectively.
Now, when the price fails to reach a certain high point or fails to drop to a certain low point before returning, we say the swing is a failure.
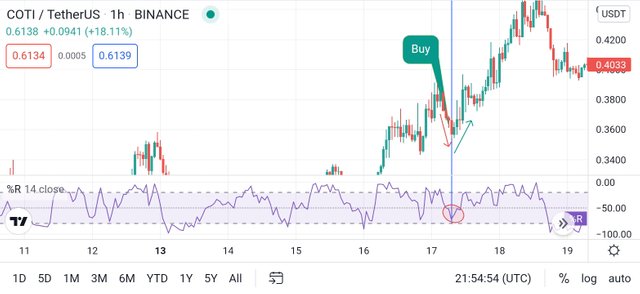
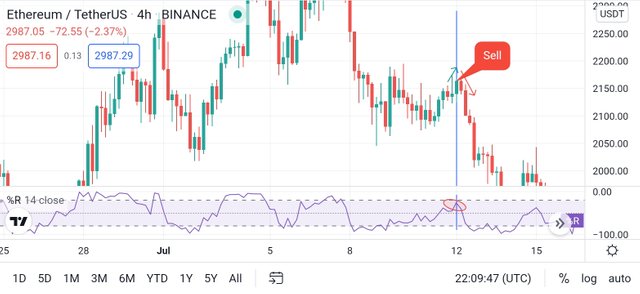
Using the Williams %R, the failure swing is a swing formed in which the indicator rises in a bullish rally but fails to reach the high reference line (-20%) or falls in a bearish 🐻 rally but fails to drop to the low reference line (-80%).
This premature reversal denotes a weakness in the trend and gives a signal. When the price turns back up before reaching the low reference line, it's a weak downtrend and a buy signal. When it falls back before reaching the high reference line, it's a weak uptrend and a sell signal.
Q.4. How to use bearish and bullish divergence with the Williams %R indicator? What are its main conclusions?
The bearish and bullish divergences spotted with the Williams %R informs of vital opportunities and this perhaps is enough reason to look out for these divergences using the Williams %R.
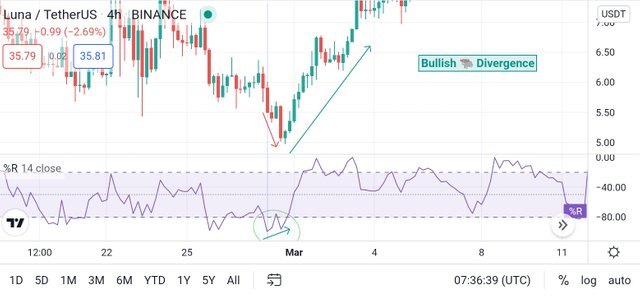
The bullish divergence occurs when the Williams %R forms an uptrend while at the same time, the price is falling. This shows that the sellers are growing weak and the price trend could possibly reverse. It's therefore a possible buying opportunity.
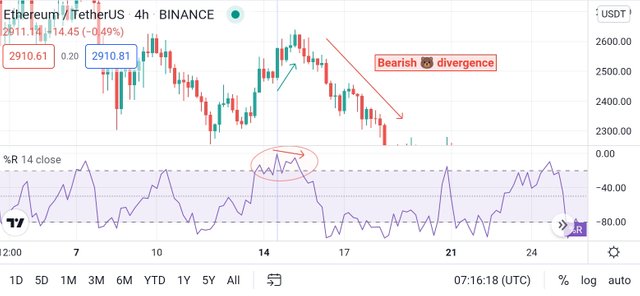
The bearish divergence occurs when the Williams %R forms a downtrend while at the same time, the price is rising. This shows that the buyers are growing weak and the price trend could possibly reverse. It's therefore a possible selling opportunity.
From the screenshots above, we see cases of bearish and bullish divergences clearly shown by the Williams %R.
Main conclusions on divergences
Williams %R is very effective in spotting trend reversals through divergences because it clearly shows the periods of weakness in a trend when there is a good chance of a reversal. Using this, the trader can decide to make a buy or sell trade depending on the divergence.
The trader should be careful to follow the correct procedure when spotting the trend in order to avoid getting a false signal.
Q.5. How do you spot a trend using Williams %R? How are false signals filtered? (screenshot required)
To spot a trend using the Williams %R, it's recommended to use it in combination with other indicators like the EMA. Different trends can be spotted using different formations on the %R like the failure swings and divergences.
To filter out false signals, confirmation needs to be done on any trend using other reliable indicator(s) like EMA. Consider the instances below
INSTANCE 1: EMA REFUTES BEARISH DIVERGENCE
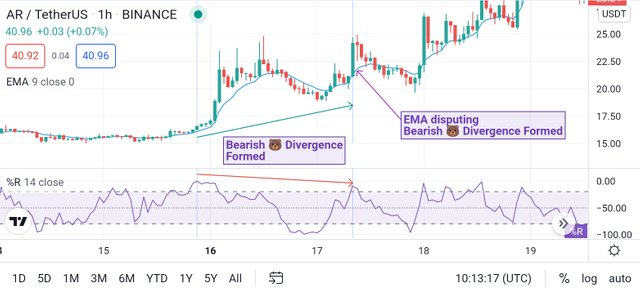
Here, we see a bearish divergence formed on the %R but the EMA fails to cross over and the price is still above the EMA. It turns out that the price respected the EMA and refuted the bearish divergence as it continued upwards.
INSTANCE 1: EMA SUPPORTS FAILURE SWING
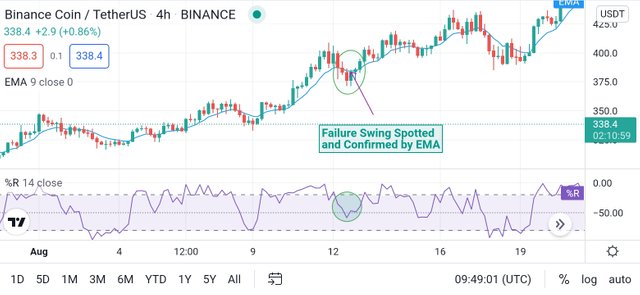
In the screenshot above, we see a failure swing on the %R and also we see the EMA keeping contact with the price, showing an inherent weakness in the short-lived downtrend. The result is a return to uptrend by the price.
Q.6. Use the chart of any pair (eg STEEM/USDT) to present the various signals from the Williams %R indicator. (Screen capture required)
Some of the signals that can be revealed using the Williams %R indicator are trend continuation and trend reversal. The %R uses failure swing to show trend continuation and uses divergences to show trend reversals.
Below are instances of failure swings on some pairs
COTI/USDT 1H chart - Failure swing showing a buy opportunity
ETH/USDT 4H chart - Failure swing showing a sell opportunity
Below are signals of trend reversals on some pairs, indicated by bearish and bullish divergences
ETH/USDT 4H chart - Bearish divergence
LUNA/USDT 4H chart - Bullish divergence
Below are signals of trend reversal, indicated by Overbought and Oversold condition signals
SOL/USDT 1H chart - Oversold and Overbought signals
CONCLUSION
The Williams Percentage Range indicator which is also know as WPR or %R, is a very sensitive momentum indicator that can provide reliable trading signals especially when used in conjunction with other technical indicators like the EMA.
The %R is very similar to stochastic oscillator as it also ranges between the numbers zero and 100, only that it's a negative scale, meaning Zero is on top. It has some danger values which also serve as thresholds a with -20% as higher threshold and -80 as lower threshold.
Above the upper threshold, it's considered an overbought condition and below the lower threshold is oversold condition. At either conditions, a reversal is imminent though it is better to see the price return before taking any action.
Within the threshold, there's an incidence known as failure swings and it occurs when a fails to reach either threshold. Below and above the threshold, there are incidences known as divergences and they're either bullish or bearish, both hinting on an imminent trading opportunity.
All signals should ideally be subjected to confirmation with other technical indicators like the EMA.
Thanks for reading
Cc:
@kouba01
Hello @jehoshua-shey,
Thank you for participating in the 4th Week Crypto Course in its 4th season and for your efforts to complete the suggested tasks, you deserve a Total|8.5/10 rating, according to the following scale:
My review :
An article with good content in general, as you managed to clearly answer most of the questions.Your explanation of the indicator was comprehensive and touched on all its characteristics.
Thanks again for your effort, and we look forward to reading your next work.
Sincerely,@kouba01