Price Action + Break-Even Technique - Crypto Academy / S4W4 - Homework post for @ lenonmc21

Q.1. Define in your own words what Price Action is?
Every technical analysis done in crypto is based on price action. Price action is the movement and/or behaviour of price in real time. Price action trading strategy deals only with price and doesn't depend on fundamental analysis. It focuses on price movement in real time.
Q.2. Define and explain in detail what the "Balance Point" is with at least one example of it (Use only your own graphics?
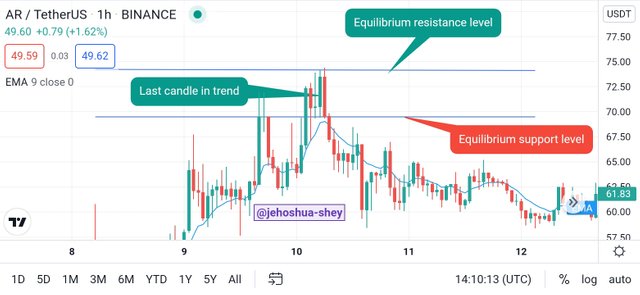
Balance or equilibrium point occurs at the end of a trend. At the end of a trend, we see a last candle which comes just before the reversal. For an uptrend, it's a green candle while for a down trend, it's a red candle. To get the equilibrium point, we need to draw a straight line at the top of the candle and at the bottom of the same candle.
Q.3. Clearly describe the step by step to run a Price Action analysis with "Break-even"?
Using the equilibrium point or break-even point, we can run price analysis without the use of indicators. This is how we can accomplish the analysis.
Firstly, we identify our timeframe. There are different timeframe on the chart, each having their own peculiarities. We have to select at least one to run our analysis on.
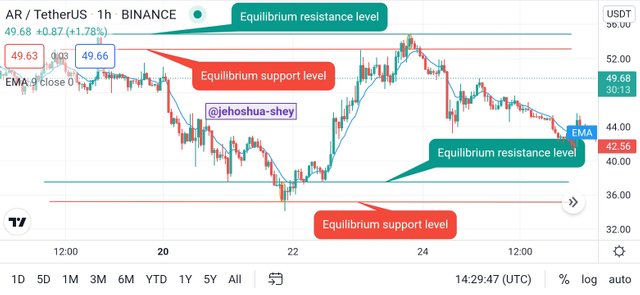
Next we draw our lines. We look for the highest price point on the chart over a good period of time and draw our line there. Then we also draw our line on the lowest price point.
After drawing our lines, we can then identify our equilibrium points on that time frame and identify points of entry as well as take profit.
Q.4. What are the entry and exit criteria using the breakeven price action technique?
Entry and exit criteria is very critical in trading with the price action technique.
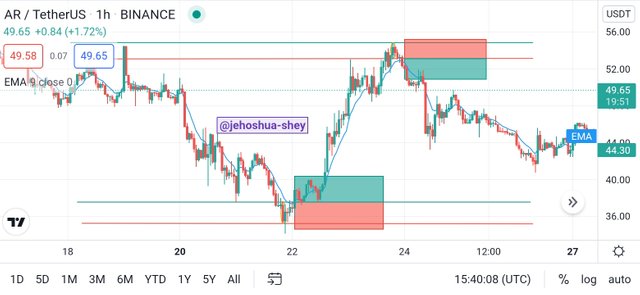
For entry, we identify the equilibrium and consider the breakout candle. When there's a clear breakout candle, it's a signal for entry. We enter at the breakout candle early enough. Just above the resistance or support line depending on the type of breakout, if it's downward or upward.
For exit, we set our stoploss a little above or below the opposite horizontal line, depending on the breakout if it's downwards or upwards. Our take profit will be in a ratio with the stoploss. It will depend on the stoploss. It is better set up using a 1:1 ratio for starters.
Q.5. What type of analysis is more effective price action or the use of technical indicators?
Technical indicators are more vast and cover more scenarios than price action. They are more elaborate and are also used in such a manner that they are combined to confirm their signals. They are more effective than price action.
Practice
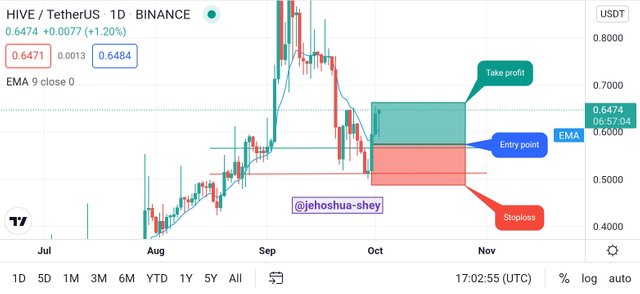
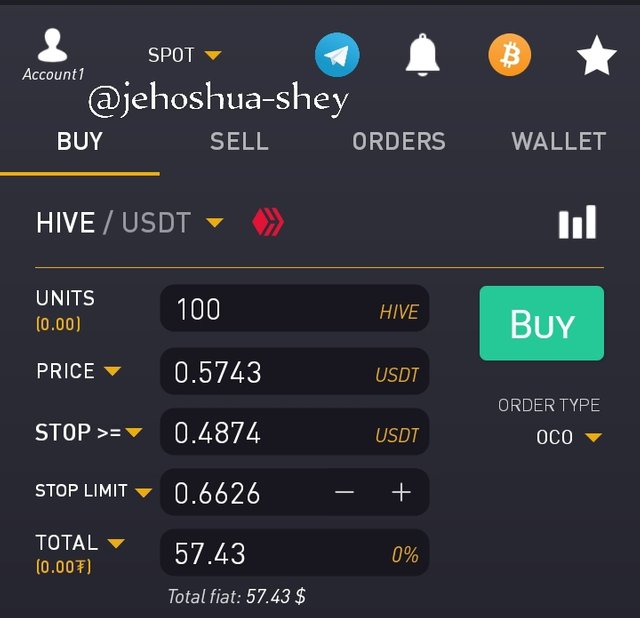
I'm the above practice, I did a demo trade on the HIVE/USDT pair. I entered at the end of a downtrend continuity and placed my stoploss below the support line. My take profit was placed to be at magnitude equal to the stoploss. (i.e I'm a 1:1 ratio).
CONCLUSION
Having to make an analysis without technical indicators might seem impossible but in reality, with a technique like price action equilibrium, it's a definite possibility. Price action considers price movement and/or behaviour in real time. To use it, you would only need to look at the price and not a technical indicator.
When using the price action technique, you look for equilibrium points where a trend ends and find suitable entry and exit points. If you get your findings right, you would most likely be in a profit.
Thanks for reading.
Cc:
@lenonmc21